Ripple, like Bitcoin and Ethereum, could not manage to break above the daily MA200 and has fallen into a downward trajectory. Technical Analysis By: Grizzly The Daily Chart: Source: TradingViewOn the daily timeframe, after the bears defended the resistance at %excerpt%.93 well, they were able to push the price down to %excerpt%.75 and deliver a 19% correction. Ripple is currently stuck between the daily MA100 (marked white) as support and MA50 (marked yellow) as resistance. If the bulls can push the price above %excerpt%.82, it’s reasonable to expect the resistance zone at %excerpt%.93 (marked red) to be tested again. Otherwise, the support zone at %excerpt%.7 (marked by green) has the potential to reverse the trend, and this can be considered the end of the uptrend. Although the ROC 14 indicator is below
Topics:
George Georgiev considers the following as important: Ripple (XRP) Price, XRP Analysis, xrpbtc, xrpusd
This could be interesting, too:
Jordan Lyanchev writes Ripple’s (XRP) Surge to Triggers Over Million in Short Liquidations
Jordan Lyanchev writes Trump Confirms Work on Strategic Crypto Reserve: XRP, ADA, SOL Included
Dimitar Dzhondzhorov writes Is a Major Ripple v. SEC Lawsuit Development Expected This Week? Here’s Why
Mandy Williams writes Ripple Releases Institutional DeFi Roadmap for XRP Ledger in 2025
Ripple, like Bitcoin and Ethereum, could not manage to break above the daily MA200 and has fallen into a downward trajectory.
Technical Analysis
By: Grizzly
The Daily Chart:
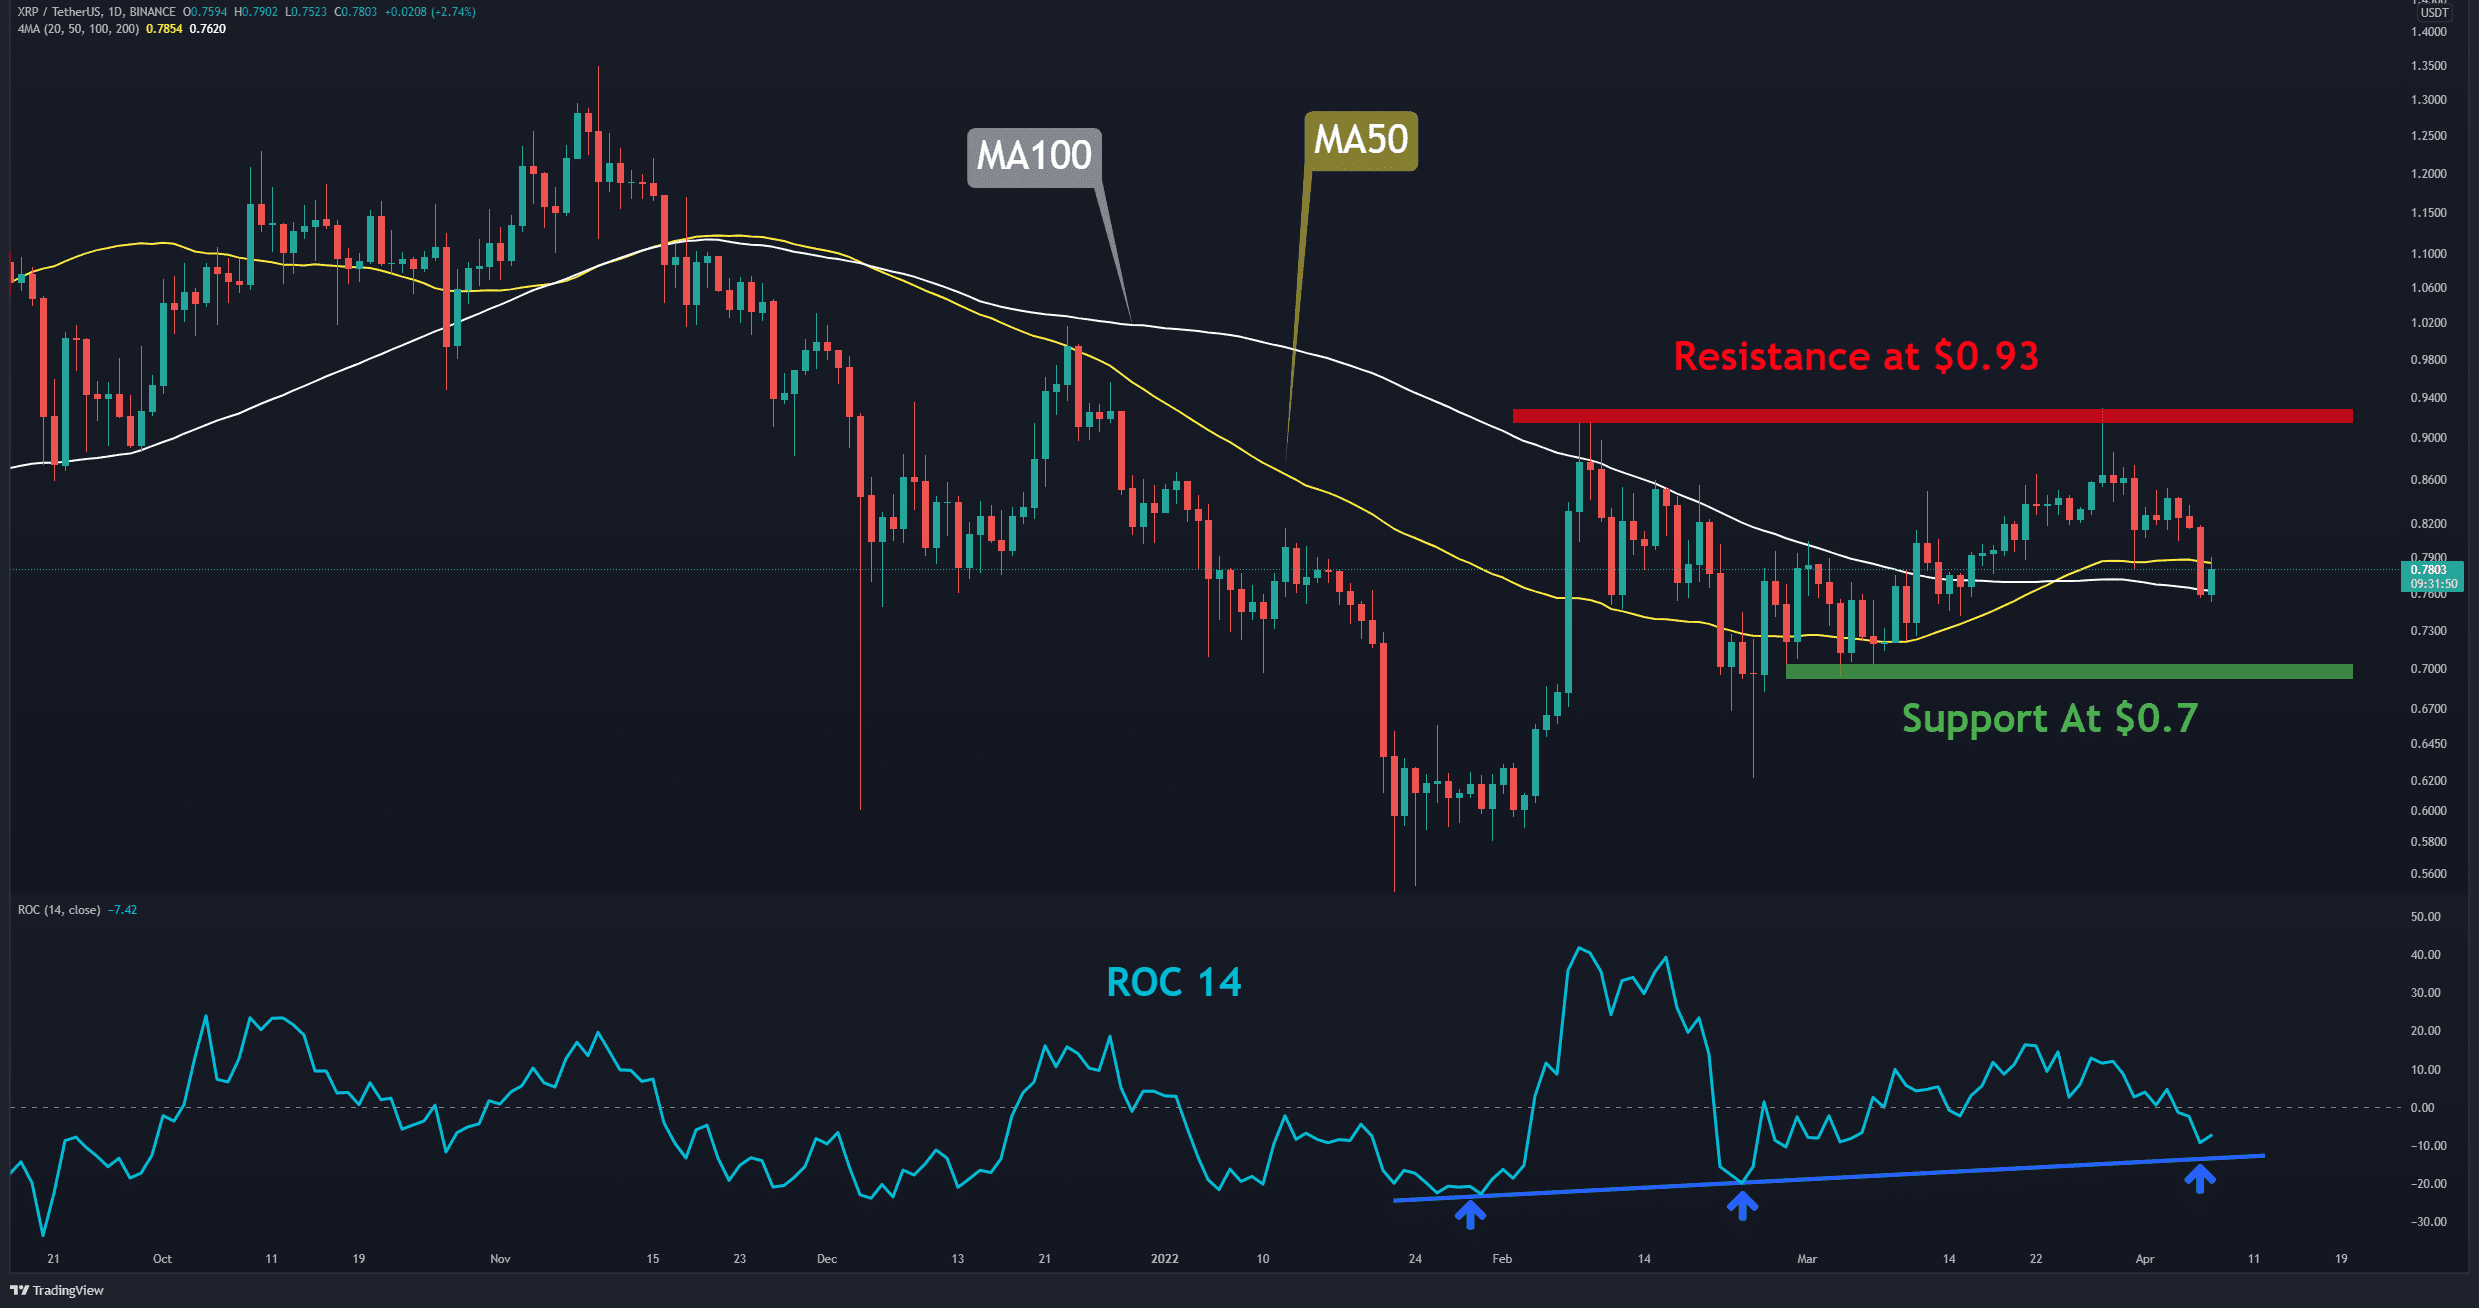
On the daily timeframe, after the bears defended the resistance at $0.93 well, they were able to push the price down to $0.75 and deliver a 19% correction. Ripple is currently stuck between the daily MA100 (marked white) as support and MA50 (marked yellow) as resistance.
If the bulls can push the price above $0.82, it’s reasonable to expect the resistance zone at $0.93 (marked red) to be tested again. Otherwise, the support zone at $0.7 (marked by green) has the potential to reverse the trend,
and this can be considered the end of the uptrend.
Although the ROC 14 indicator is below the baseline, it is still above the ascending line (marked blue). Overall, the trend is still bullish as long as XRP holds the mentioned supports.
The 4-Hour Chart:
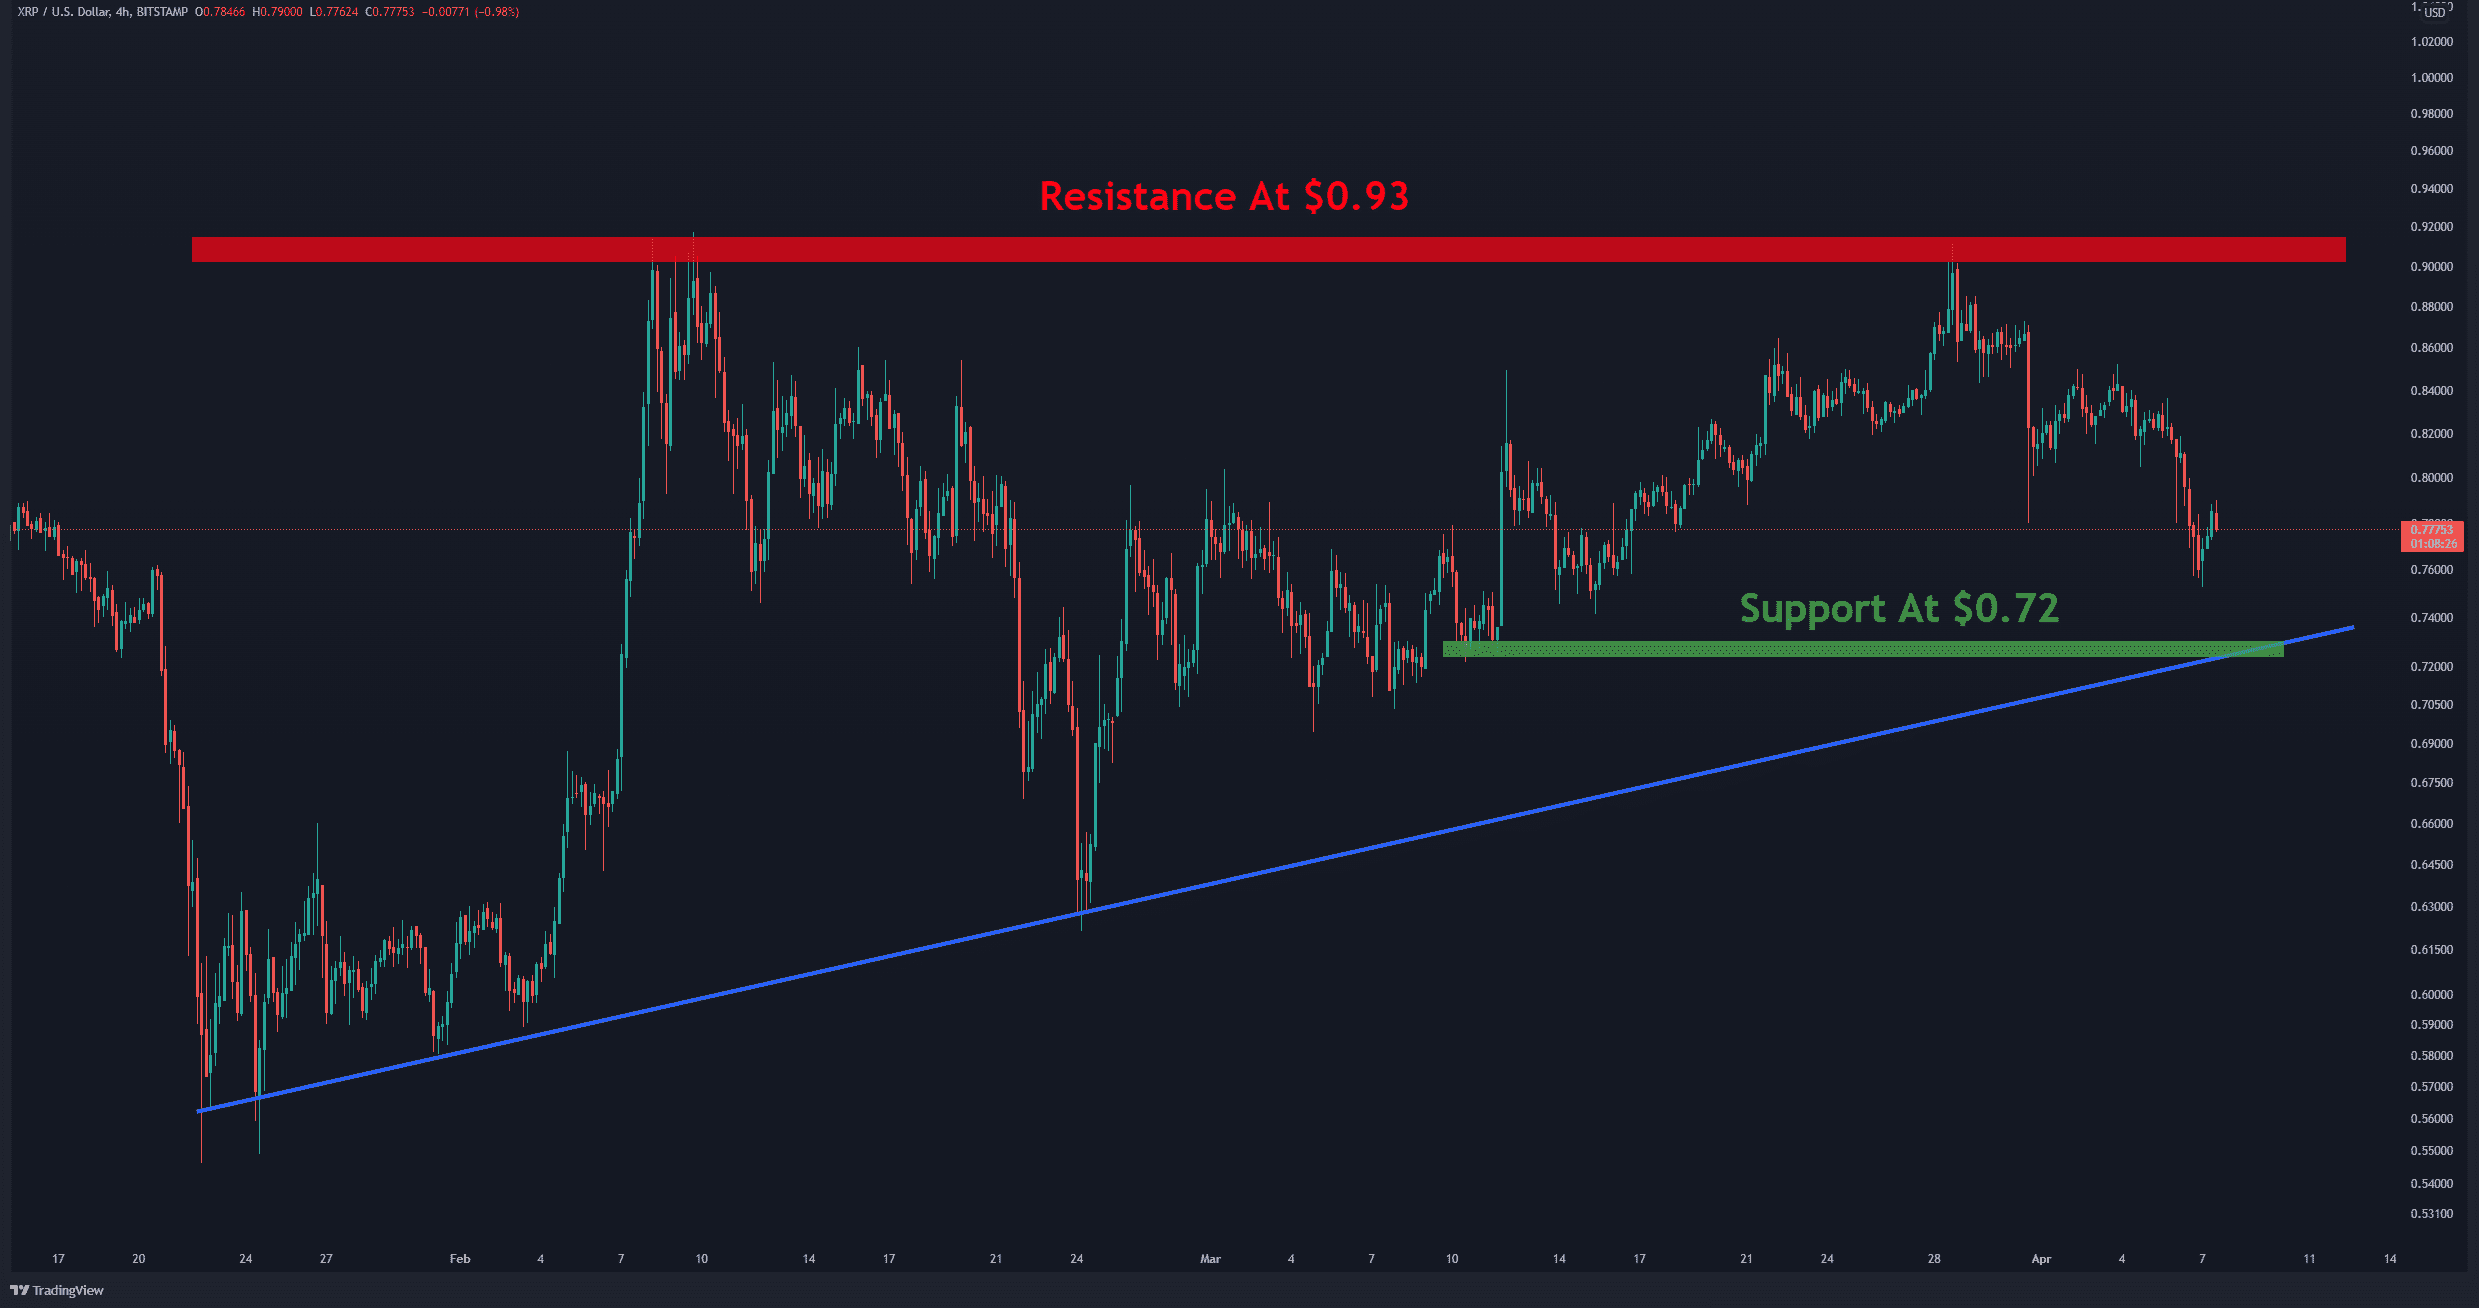
On the 4-hour timeframe, Ripple is fluctuating within an ascending triangle, which is technically a bullish pattern. However, in such cases, one has to wait for an exit from one side in order to make a better decision.
If the price breaks out of the upper side and crosses the resistance at $0.93, one can expect the targets above $1 to be touched. And if it breaks out of the bottom and crosses the support at $0.72, one can expect the support level at $0.62 to be tested again.