Bitcoin’s price has been rejected from the 200-day moving average and is currently experiencing a sharp downtrend. The Daily Timeframe Technical Analysis By: Edris The 50-day and 100-day moving average lines printed a bullish crossover last week. However, instead of holding the price, BTC broke to the downside. These moving averages have also acted as resistance and pushed the price further down over the past week. BTC is currently heading towards the K support level, which has held the price multiple times. However, if the price breaks below it, followed by strong momentum and volume, the K demand zone would be a critical area that could act as a reversal point. On the other hand, if the K support level holds, the 50-day and 100-day moving averages would be
Topics:
CryptoVizArt considers the following as important: Bitcoin (BTC) Price, BTC Analysis, BTCEUR, BTCGBP, btcusd, btcusdt
This could be interesting, too:
Chayanika Deka writes XRP, SOL, and ADA Inclusion in US Crypto Reserve Pushes Traders on Edge
Chayanika Deka writes Why Arthur Hayes Is Bullish on Bitcoin Under Trump’s Economic Strategy
Mandy Williams writes Why the Bitcoin Market Is Stuck—and the Key Metric That Could Change It: CryptoQuant CEO
Wayne Jones writes Metaplanet Acquires 156 BTC, Bringing Total Holdings to 2,391
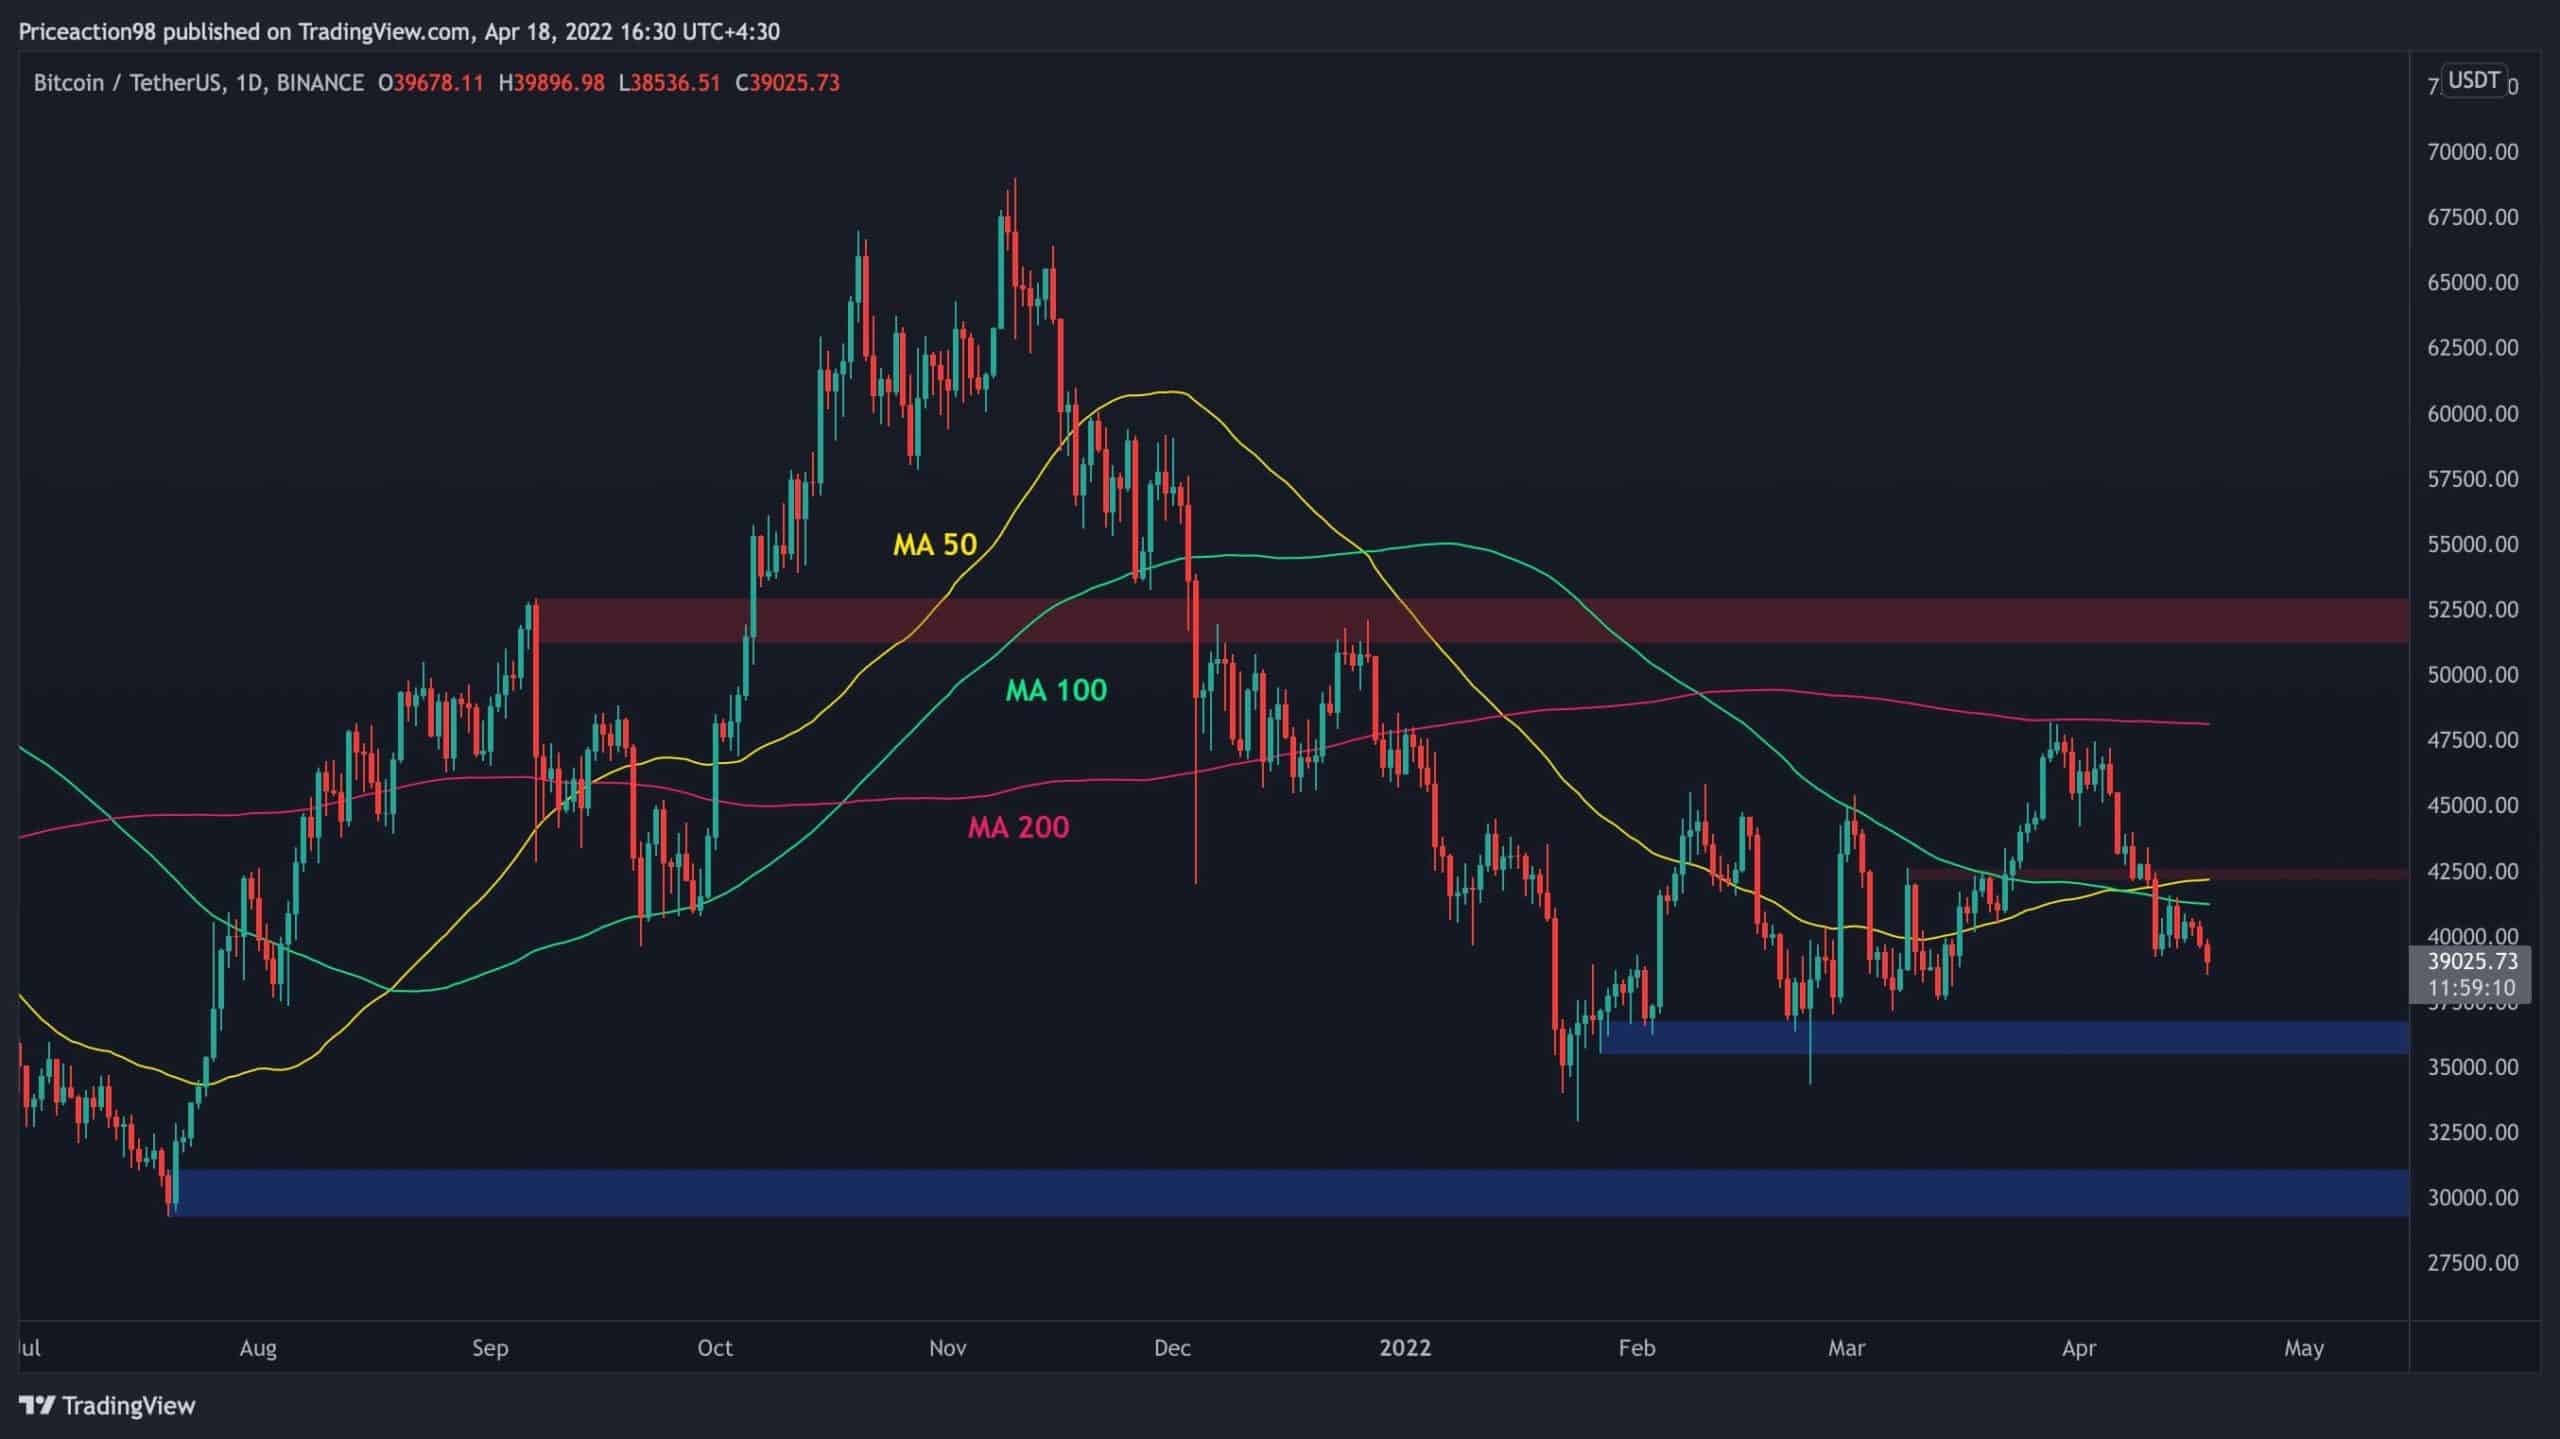
Bitcoin’s price has been rejected from the 200-day moving average and is currently experiencing a sharp downtrend.
The Daily Timeframe
Technical Analysis By: Edris
The 50-day and 100-day moving average lines printed a bullish crossover last week. However, instead of holding the price, BTC broke to the downside. These moving averages have also acted as resistance and pushed the price further down over the past week.
BTC is currently heading towards the $36K support level, which has held the price multiple times. However, if the price breaks below it, followed by strong momentum and volume, the $30K demand zone would be a critical area that could act as a reversal point.
On the other hand, if the $36K support level holds, the 50-day and 100-day moving averages would be significant obstacles in Bitcoin’s path to recovery.
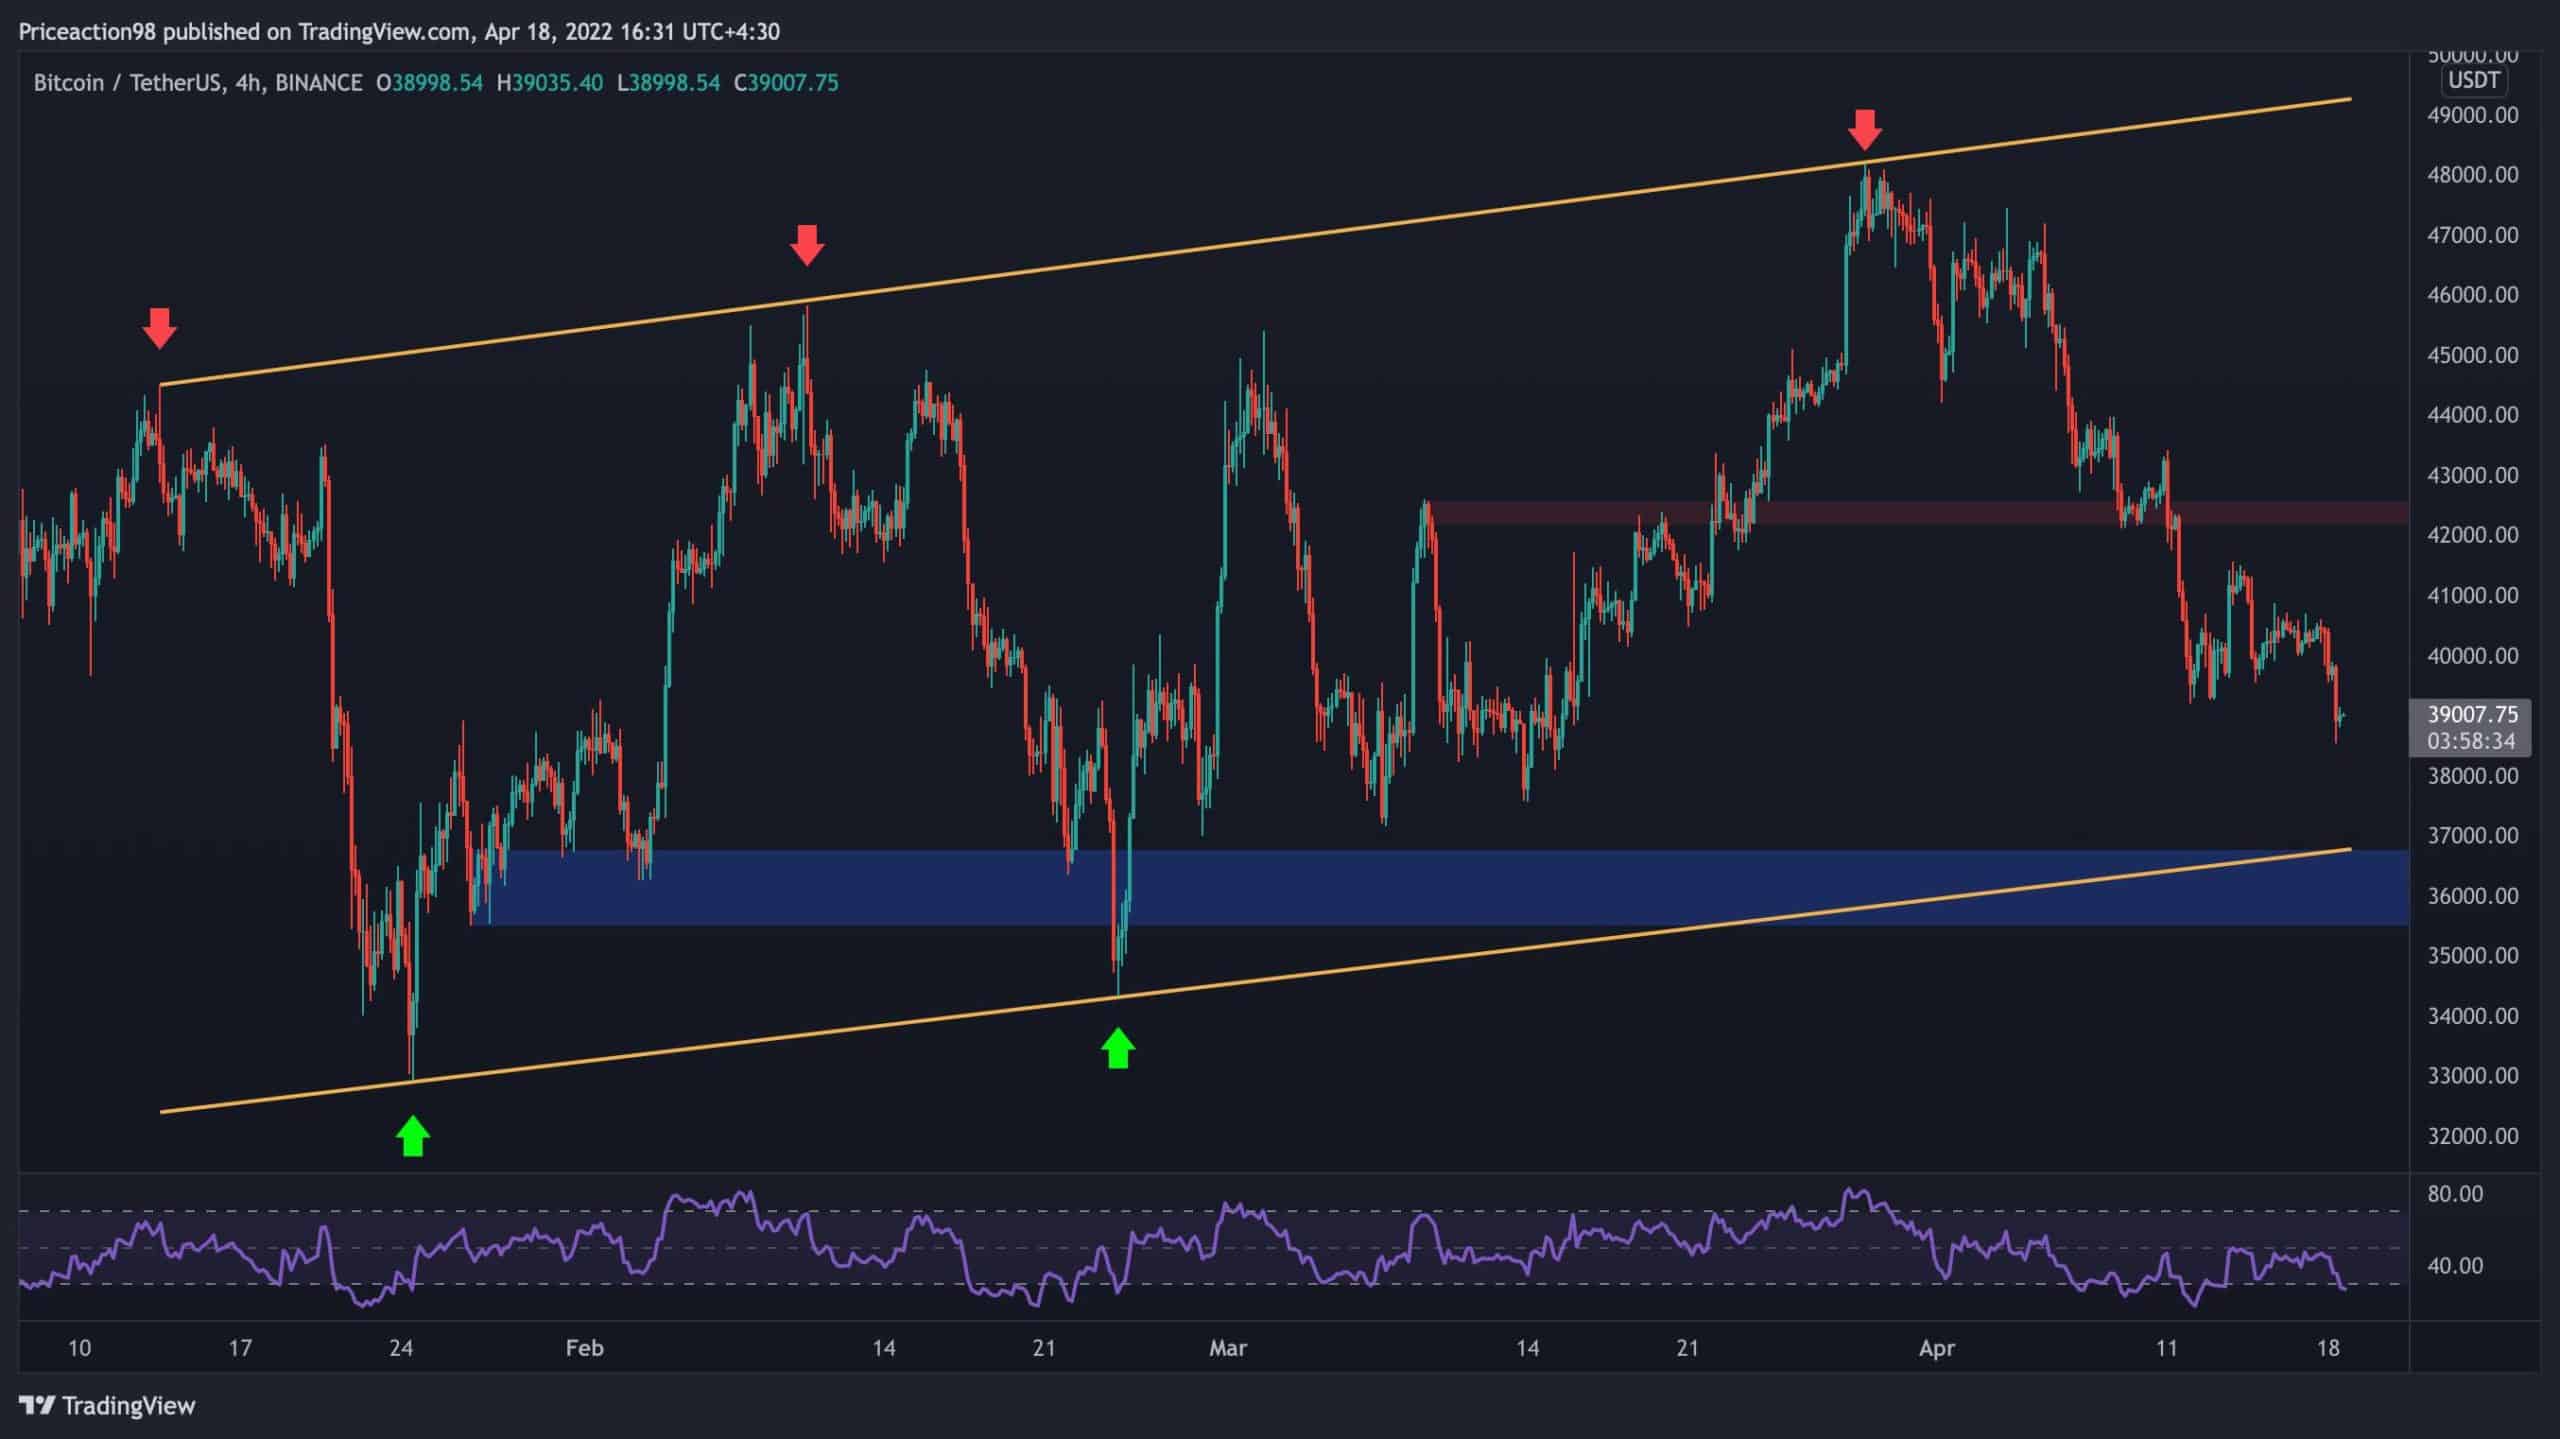
The 4-Hour Timeframe
On the 4-hour time frame, the price has broken below the $42K support level and completed a pullback before continuing to the downside.
The overlapping lower boundary of the bearish flag and the $36K level are currently the primary support levels.
A breakdown below these levels would lead to a continuation of the downtrend, and the price could see a new low below $33K.
On the other hand, the RSI indicator has entered the overbought zone (below 30%), and a bullish pullback might be seen in the short term before the next bearish leg.
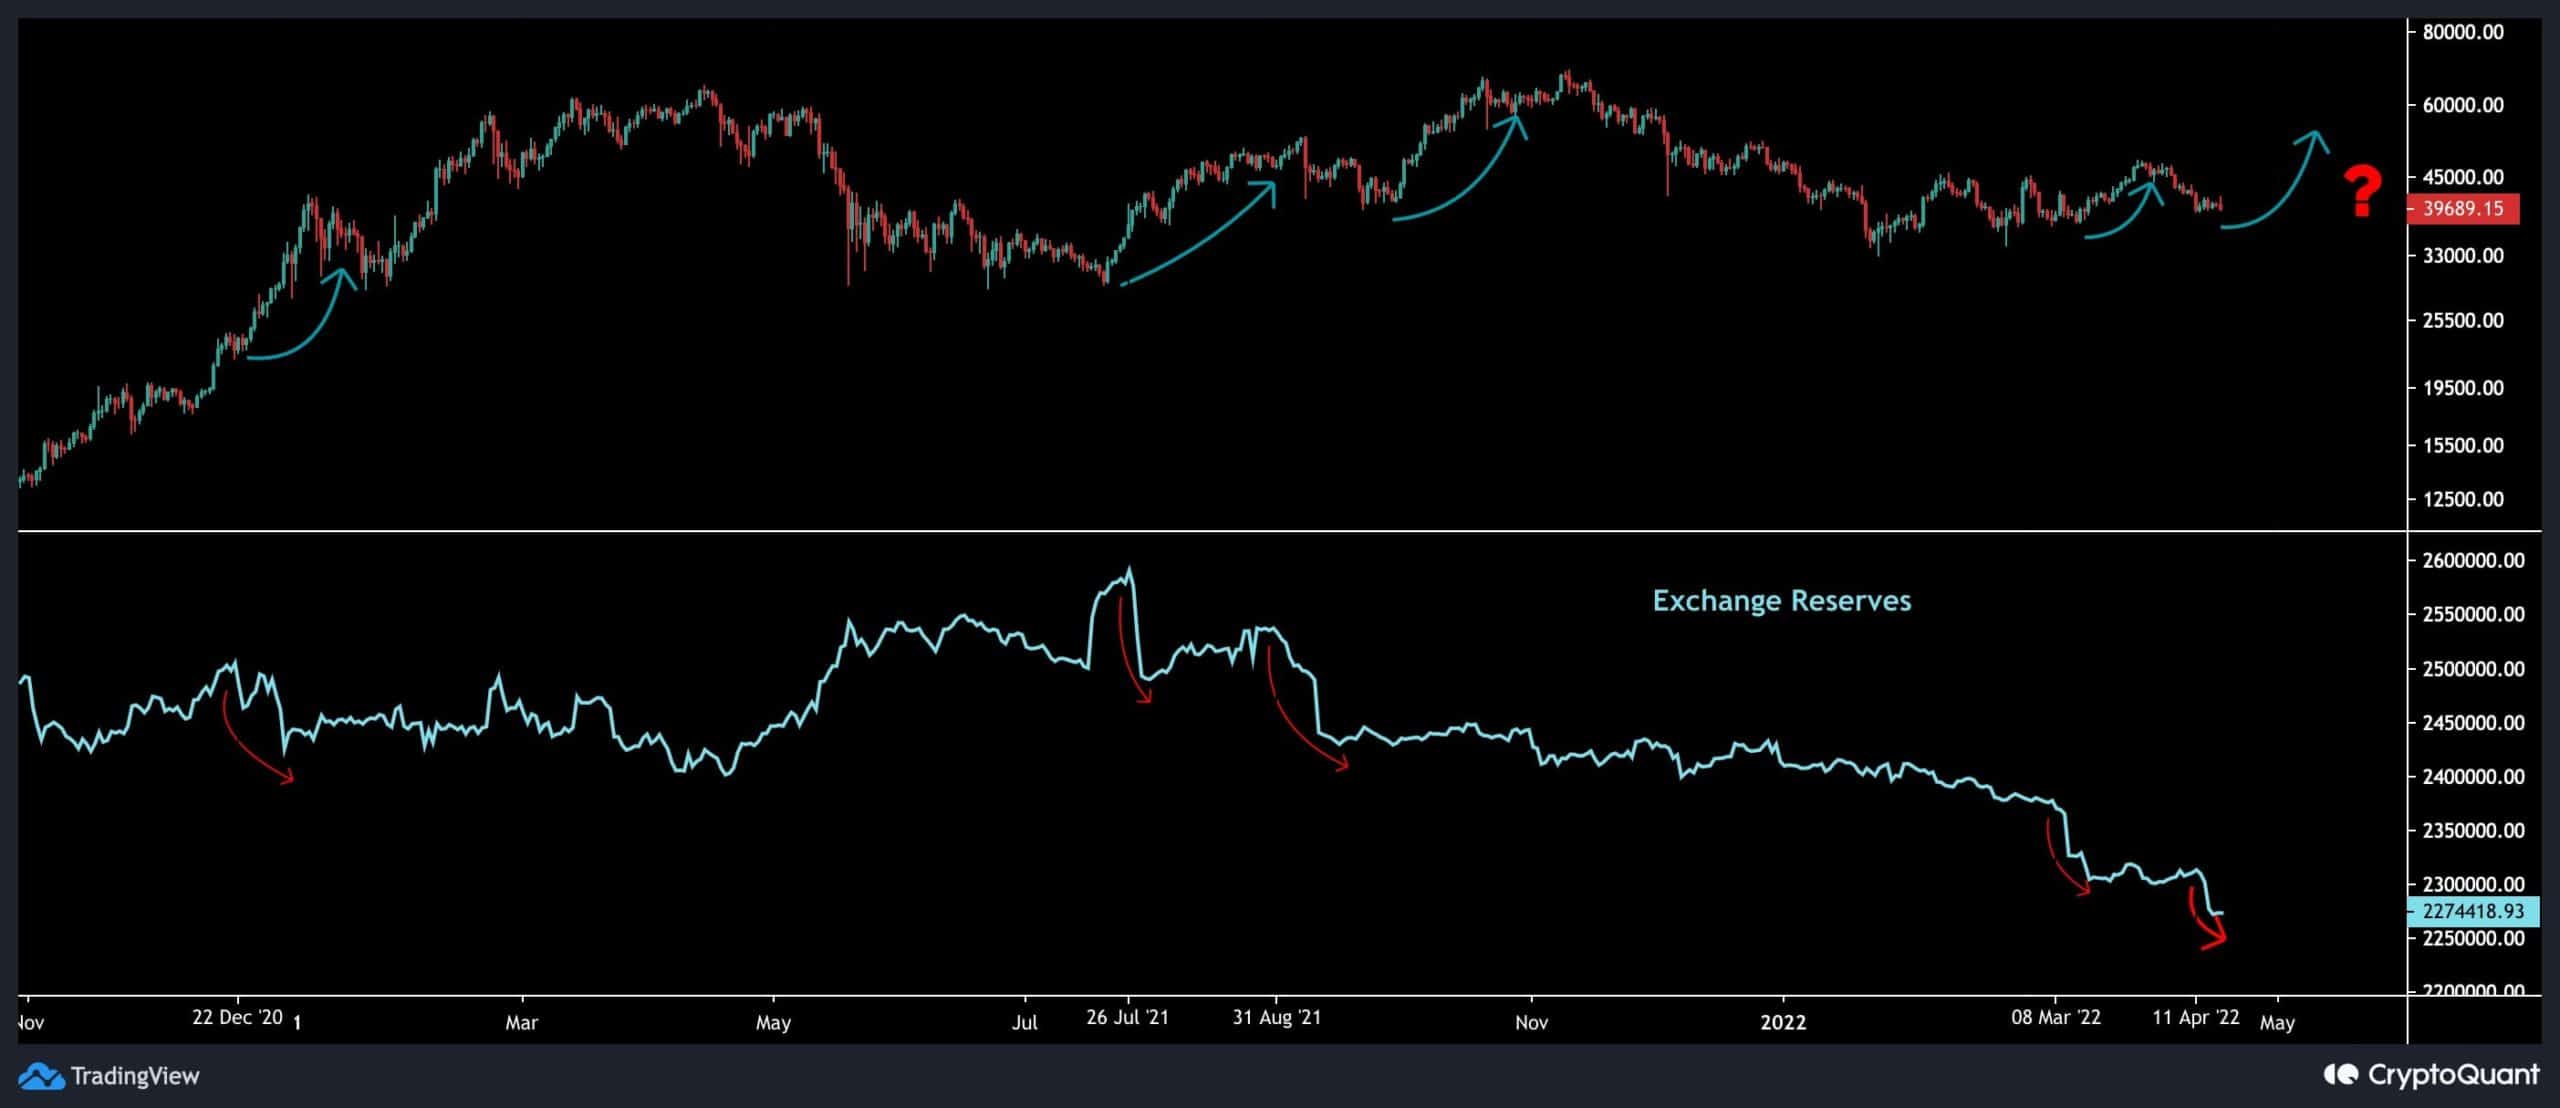
Onchain Analysis
By Shayan
Since the exchange reserves have been in a downward trend for most of the current cycle, the primary decline may not provide a clear signal of price fluctuations.
A sudden drastic drop or change of direction, on the other hand, might be a good indication.
The metric has recently declined dramatically, indicating the accumulation phase in the $37K-$42K price range.
A sudden massive decrease in this indicator has historically signaled the start of a new bullish leg for Bitcoin. Given the current shakeout in the measure, another bullish rally might be on its way shortly.