Ripple is on the verge of breaking the 5-month consolidation range. Doing so could cause the bullish rally we saw last month to resume. Technical Analysis By Grizzly The Daily Chart Although XRP concluded the week with a red candlestick, the daily chart suggests an increase in buying pressure. The cryptocurrency hit the descending line (in yellow) 10 days ago, which had been a major barrier over the past 300 days. In hindsight, testing the static resistance at %excerpt%.55 (in red) while also breaking the 14-day RSI indicator above 70 indicated the rising possibility of a correction. Fortunately, the buyers were able to defend the critical level at %excerpt%.42 (in green). If they can keep up the momentum, a possibility to retest the resistance at %excerpt%.55 could come to light. If the pair
Topics:
CryptoVizArt considers the following as important: Ripple (XRP) Price, XRP Analysis, xrpbtc, xrpusd
This could be interesting, too:
Jordan Lyanchev writes Ripple’s (XRP) Surge to Triggers Over Million in Short Liquidations
Jordan Lyanchev writes Trump Confirms Work on Strategic Crypto Reserve: XRP, ADA, SOL Included
Dimitar Dzhondzhorov writes Is a Major Ripple v. SEC Lawsuit Development Expected This Week? Here’s Why
Mandy Williams writes Ripple Releases Institutional DeFi Roadmap for XRP Ledger in 2025
Ripple is on the verge of breaking the 5-month consolidation range. Doing so could cause the bullish rally we saw last month to resume.
Technical Analysis
By Grizzly
The Daily Chart
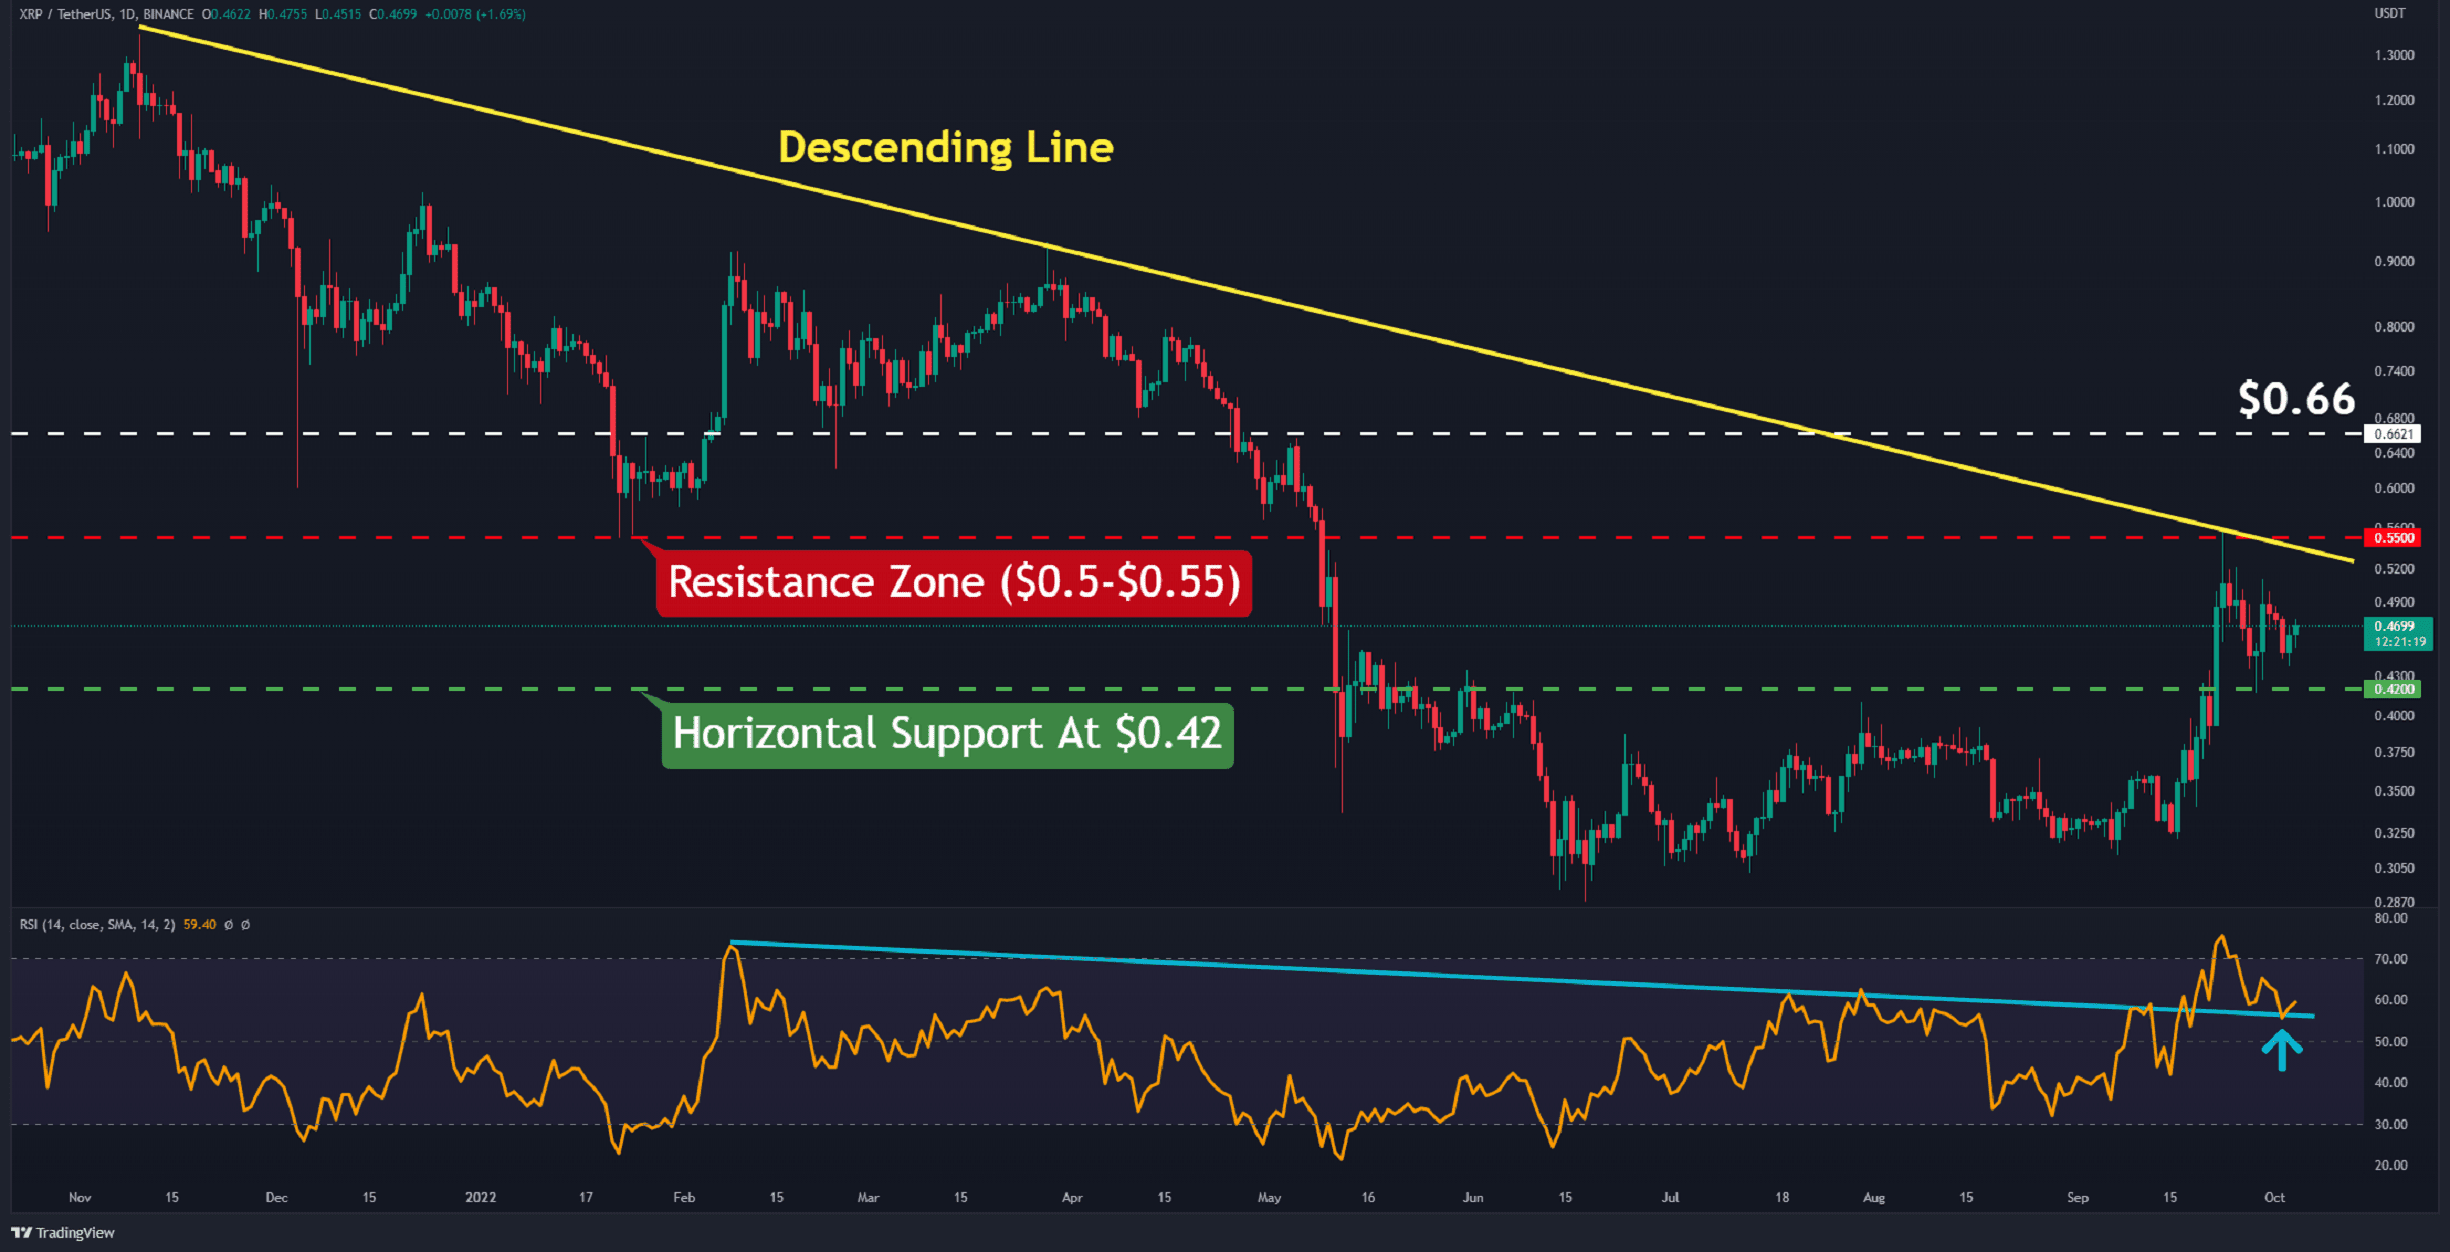
Although XRP concluded the week with a red candlestick, the daily chart suggests an increase in buying pressure.
The cryptocurrency hit the descending line (in yellow) 10 days ago, which had been a major barrier over the past 300 days. In hindsight, testing the static resistance at $0.55 (in red) while also breaking the 14-day RSI indicator above 70 indicated the rising possibility of a correction.
Fortunately, the buyers were able to defend the critical level at $0.42 (in green). If they can keep up the momentum, a possibility to retest the resistance at $0.55 could come to light.
If the pair flips this resistance, a bullish rally would become more likely. In this case, the first hurdle is found at $0.66 (in white). The bullish scenario would become invalid if the price slips below $0.42.
Key Support Levels: $0.42 & $0.33
Key Resistance Levels: $0.55 & $0.66
Daily Moving Averages:
MA20: $0.43
MA50: $0.38
MA100: $0.36
MA200: $0.46
The XRP/BTC Chart
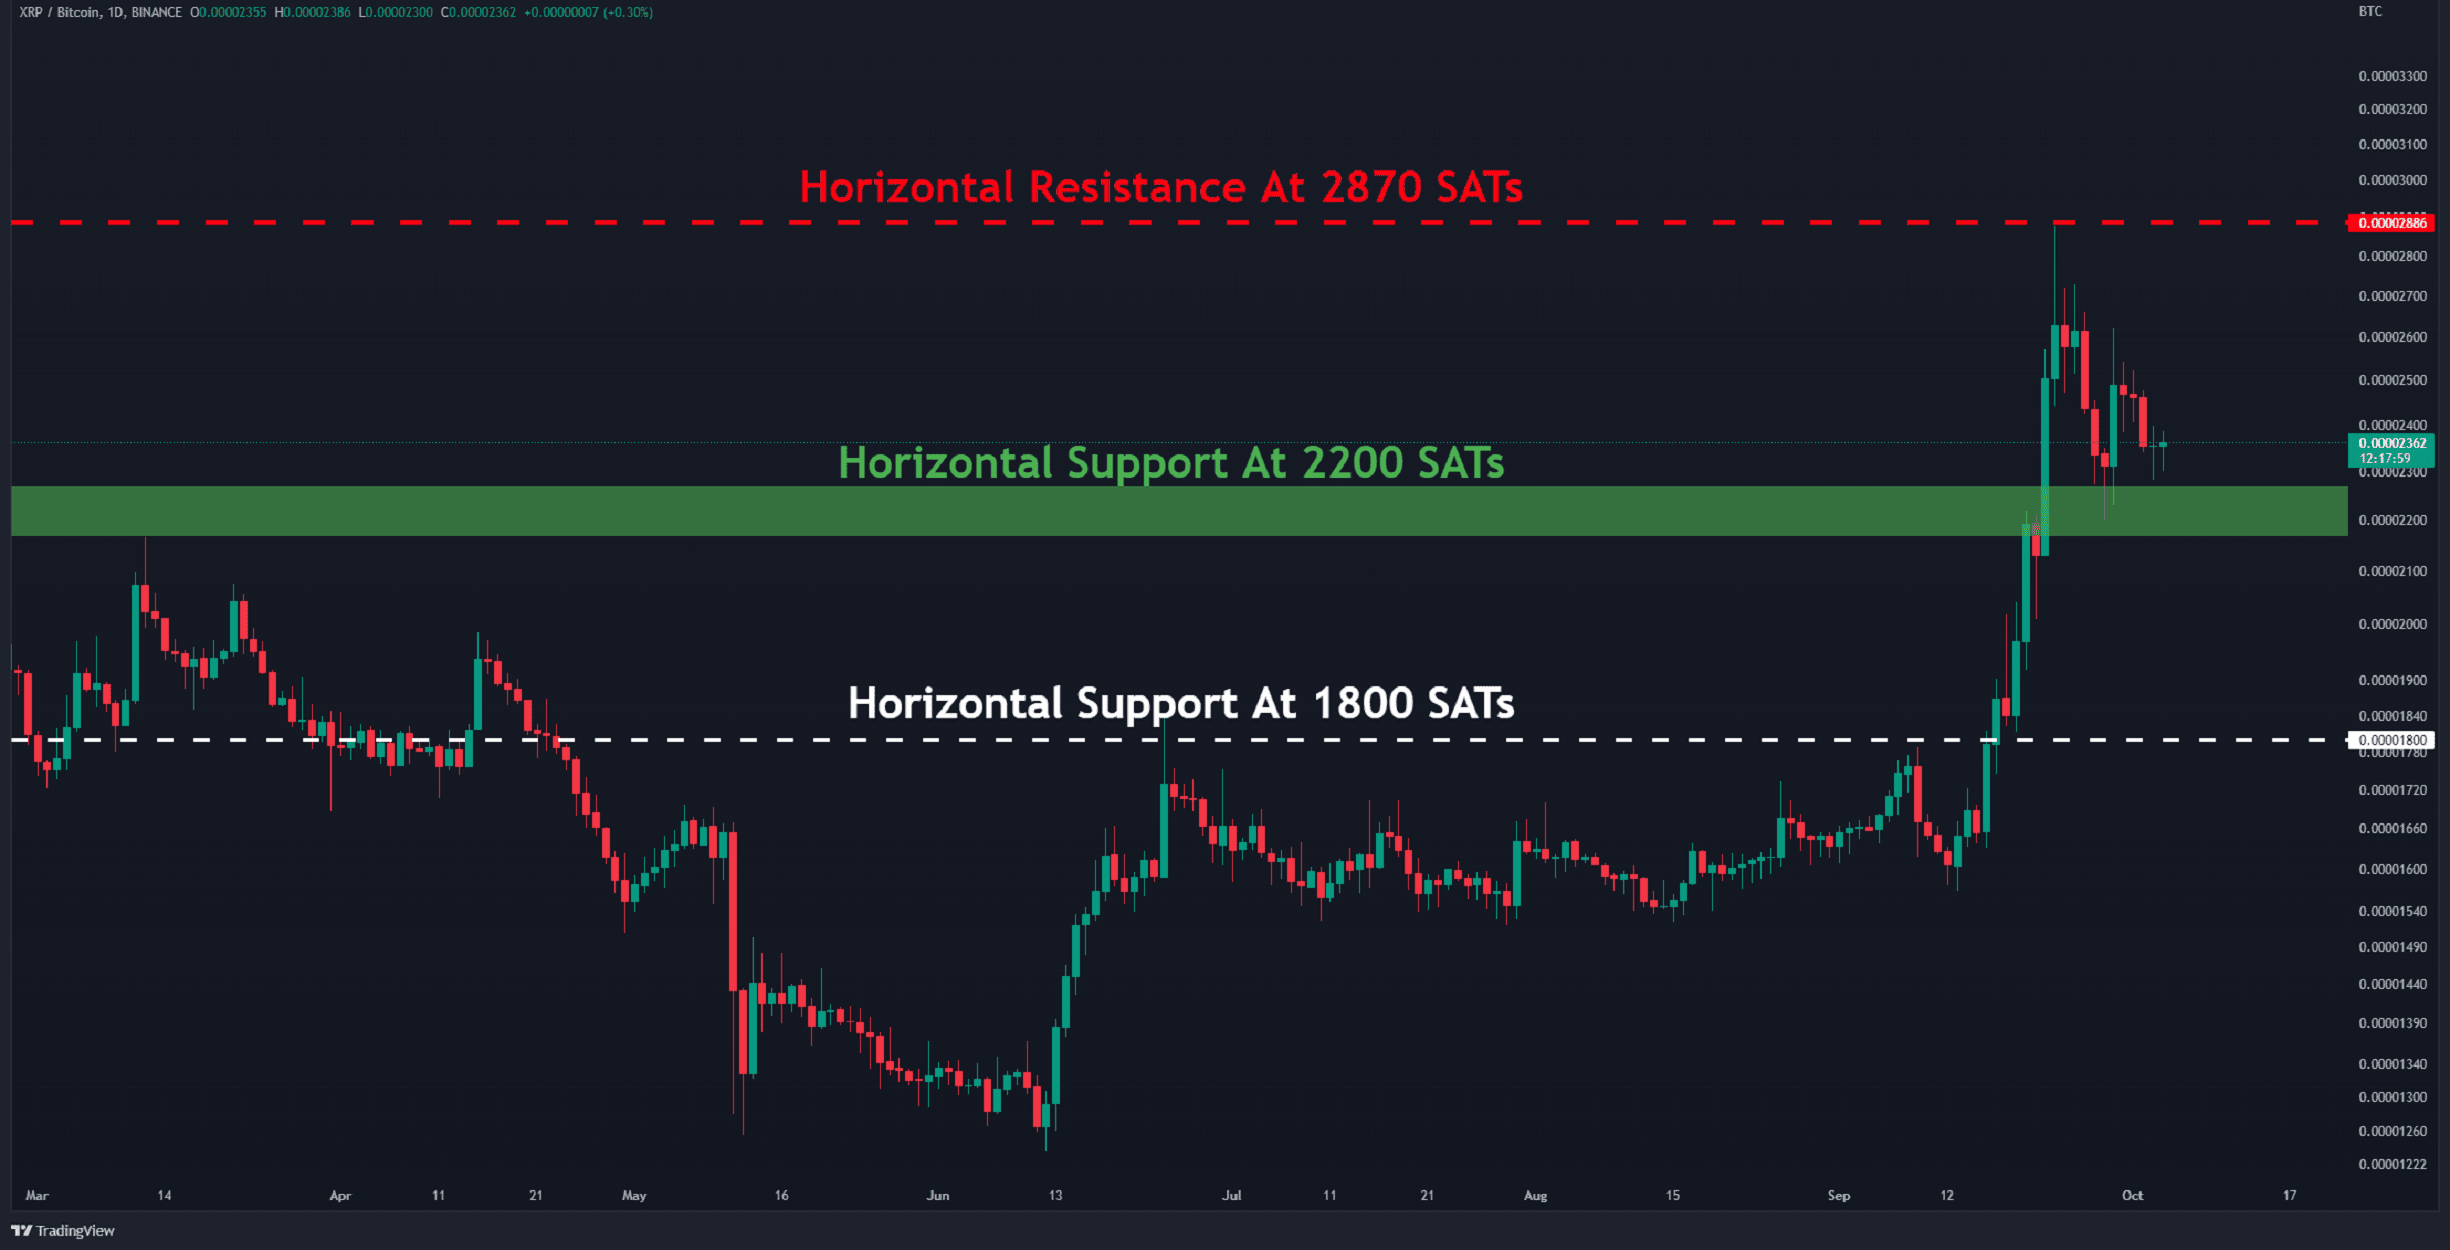
Against BTC, XRP appears bullish. There’s an evident correction that started when the cryptocurrency failed to breach 2870 SATs (in red), and it’s been going on for 10 days so far.
The positive sign is that the horizontal support at 2200 SATs (in green) has been quite solid. However, considering the sharp price move above the 2200 SATs range, this also increases the possibility of a further downturn. Therefore, if the price falls below this level, it could spell serious trouble for Ripple’s price.
Nevertheless, the bullish structure would remain intact as long as the price is trading above the 2200 SATs support level. A bA break and close below it, on the other hand, will send the price towards 1800 SATs (in white).
Key Support Levels: 2200 SATs & 1800 SATs
Key Resistance Levels: 2870 SATs & 3900 SATs