Following bitcoin, The crypto market is having a green day so far. Investors who hold altcoins are optimistic and hoping for a trend reversal. The Daily Chart Technical analysis by Grizzly On the daily timeframe, Ripple experienced fluctuations inside its Fibonacci channel over the last two years, starting since the Covid crash in March 2020. The price failed to reach its ATH at .3 and began a ‘boring’ correction in May last year. The news regarding the Ripple vs. SEC case and the corresponding statements by the SEC had made its holders completely disappointed. But with the recent release of positive news, hopes returned to the project, which led to positive price movements in XRP. The price is now trading near the bottom of its Fibonacci channel and has formed a higher
Topics:
CryptoVizArt considers the following as important: Ripple (XRP) Price, XRP Analysis, xrpbtc, xrpusd
This could be interesting, too:
Jordan Lyanchev writes Ripple’s (XRP) Surge to Triggers Over Million in Short Liquidations
Jordan Lyanchev writes Trump Confirms Work on Strategic Crypto Reserve: XRP, ADA, SOL Included
Dimitar Dzhondzhorov writes Is a Major Ripple v. SEC Lawsuit Development Expected This Week? Here’s Why
Mandy Williams writes Ripple Releases Institutional DeFi Roadmap for XRP Ledger in 2025
Following bitcoin, The crypto market is having a green day so far. Investors who hold altcoins are optimistic and hoping for a trend reversal.
The Daily Chart
Technical analysis by Grizzly
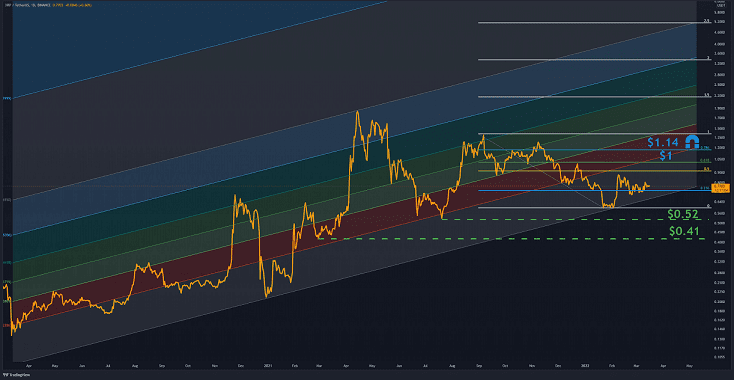
On the daily timeframe, Ripple experienced fluctuations inside its Fibonacci channel over the last two years, starting since the Covid crash in March 2020.
The price failed to reach its ATH at $3.3 and began a ‘boring’ correction in May last year. The news regarding the Ripple vs. SEC case and the corresponding statements by the SEC had made its holders completely disappointed.
But with the recent release of positive news, hopes returned to the project, which led to positive price movements in XRP.
The price is now trading near the bottom of its Fibonacci channel and has formed a higher high in the past month. It seems that if the market endures the current instabilities caused by macro, XRP can reach the specified Fibonacci targets, as seen below.
The first major resistance is at $1 and then $1.14. If the market can not get back these levels, the notable supports at $0.51 and $0.42 are the levels where the bulls are expected to defend their positions.
Indicators
RSI-14D: Bullish and above baseline (bulls control the market)
MACD: Sideways but in the bullish area
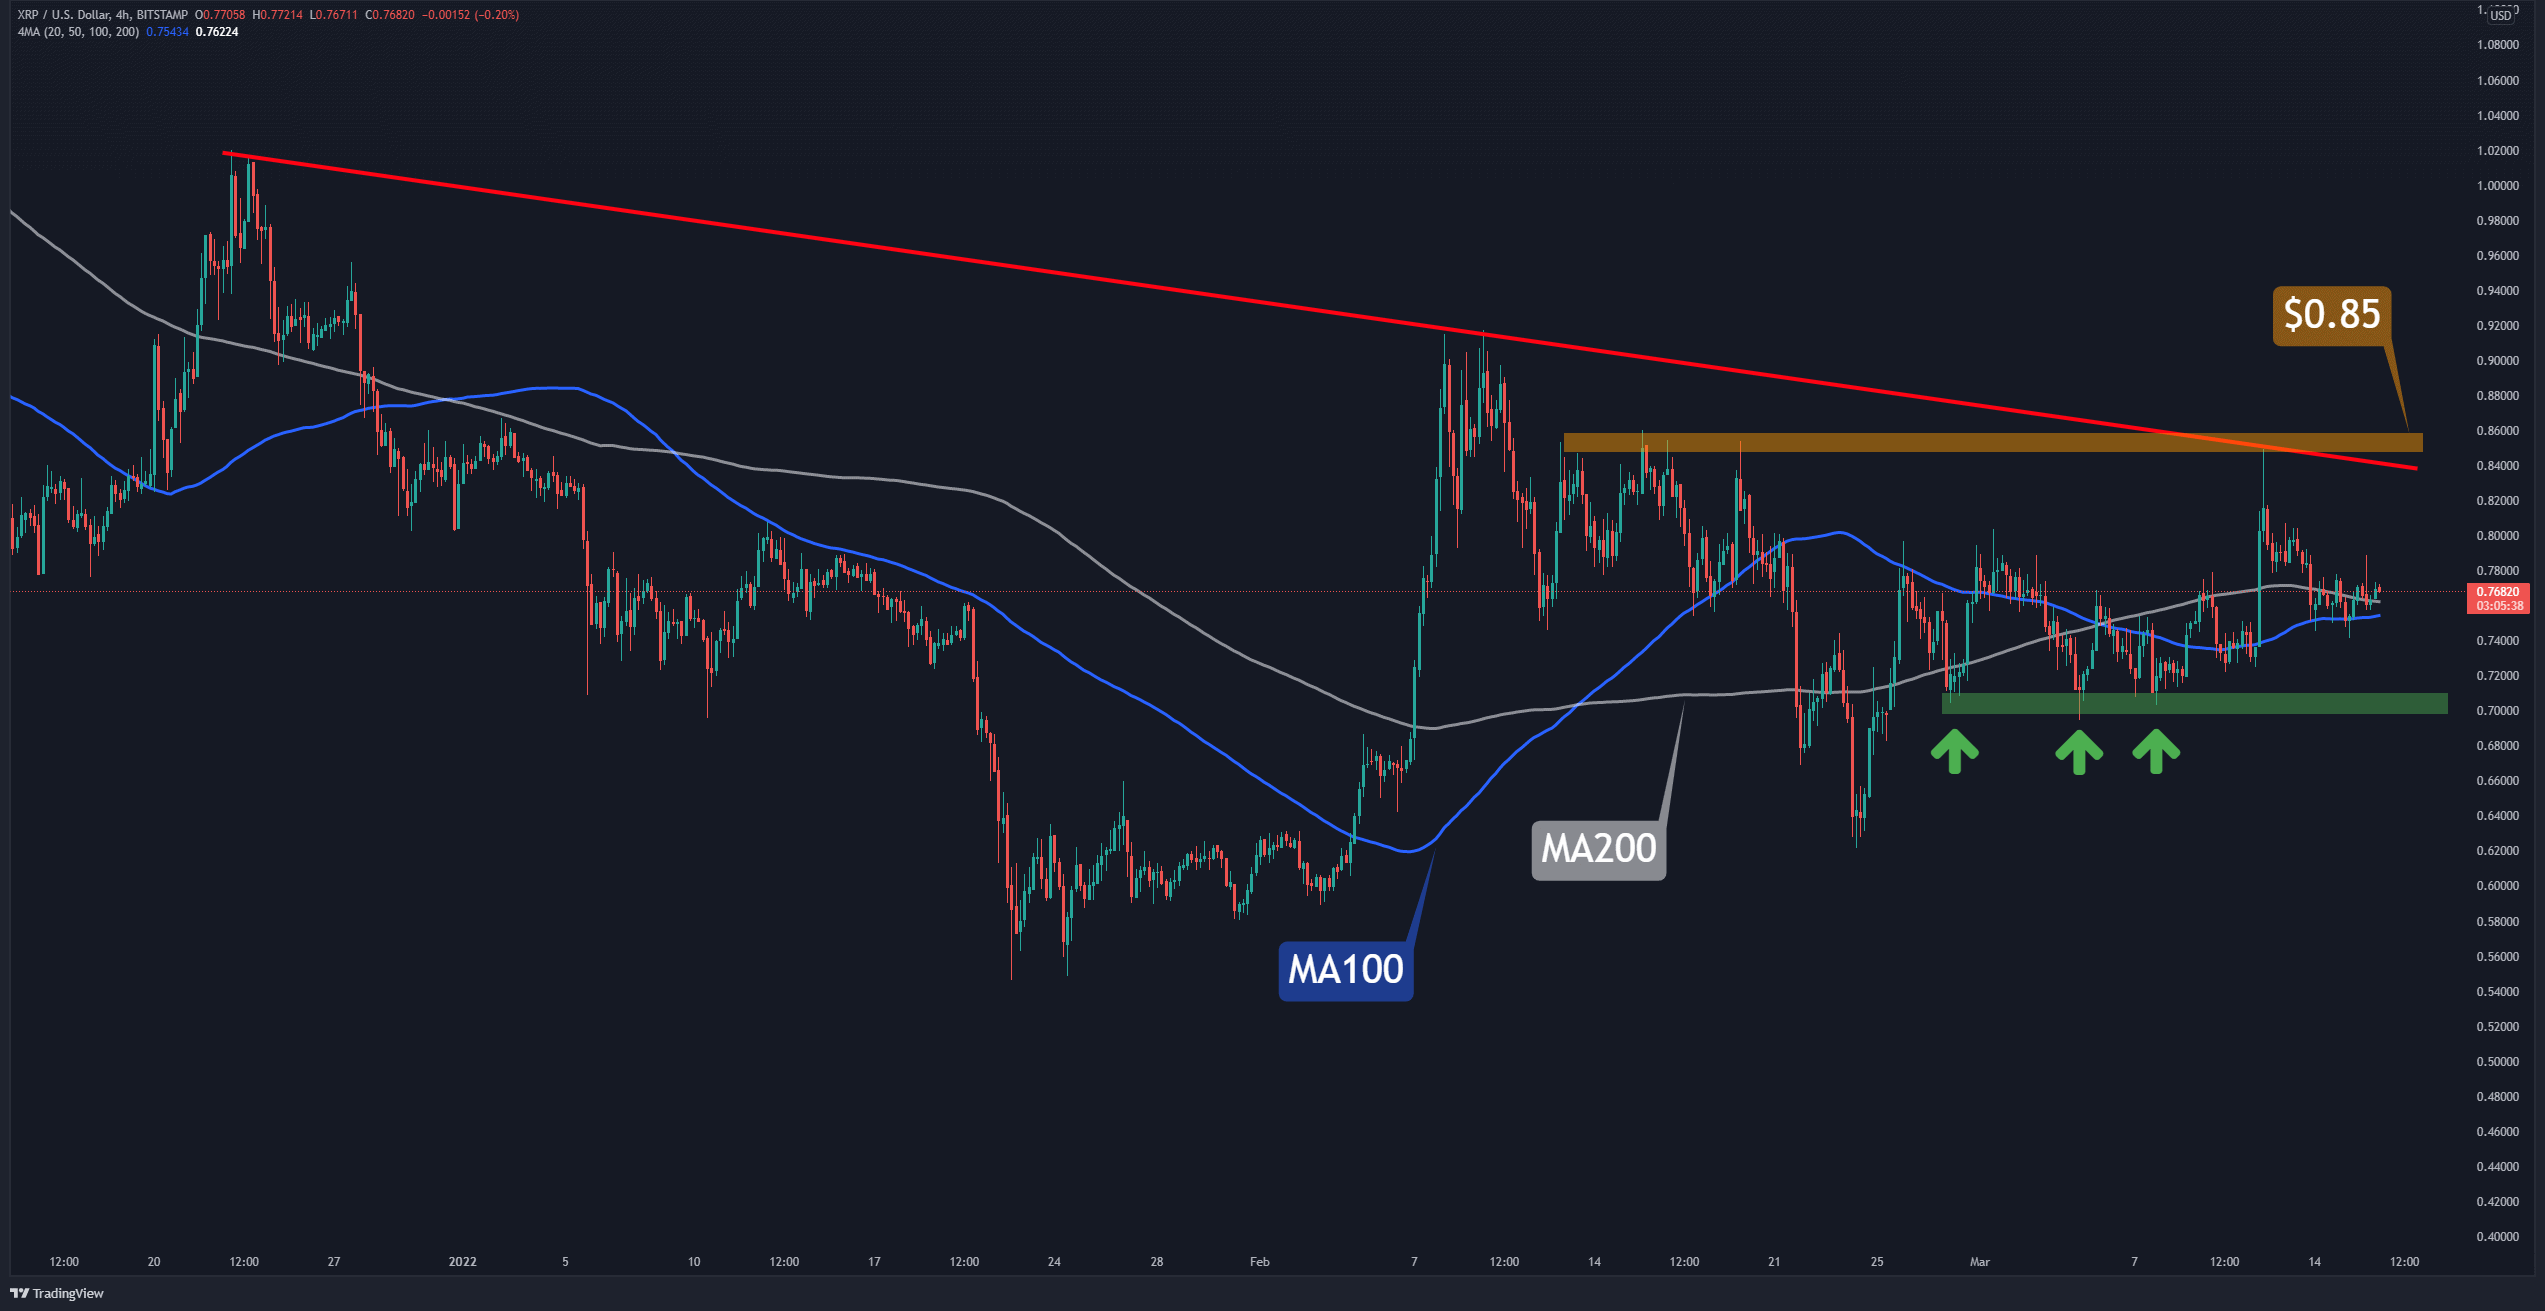
The 4-Hour Chart
On the 4-hour timeframe, after the bears failed to push the price below $0.70, XRP started a quick upward trend, crossing above the MA 100 and MA 200 lines (marked blue & white) and moving towards its dynamic resistance (marked by red). The reversal of the downtrend will be confirmed in the short-term when Ripple can form a higher high above $0.85