Bitcoin’s price action has rebounded significantly while testing key support levels. The next few days could determine whether the market would start a mid-term recovery or the gruesome downtrend would still continue. Technical Analysis By: Edris The Daily Chart: Looking at the daily chart, the correction has been halted over the last couple of weeks above the K support level. Regardless, bullish momentum is still lacking, and the price has failed to retest the K level. Interestingly, a wide descending channel, considered a bullish reversal pattern, seems to be forming in this timeframe. So, a breakout from the higher boundary of the pattern could signal the beginning of a mid-term bullish trend and potentially the end of the bear market. However, the mentioned K
Topics:
CryptoVizArt considers the following as important: Bitcoin (BTC) Price, BTC Analysis, BTCEUR, BTCGBP, btcusd, btcusdt
This could be interesting, too:
Chayanika Deka writes XRP, SOL, and ADA Inclusion in US Crypto Reserve Pushes Traders on Edge
Chayanika Deka writes Why Arthur Hayes Is Bullish on Bitcoin Under Trump’s Economic Strategy
Mandy Williams writes Why the Bitcoin Market Is Stuck—and the Key Metric That Could Change It: CryptoQuant CEO
Wayne Jones writes Metaplanet Acquires 156 BTC, Bringing Total Holdings to 2,391
Bitcoin’s price action has rebounded significantly while testing key support levels. The next few days could determine whether the market would start a mid-term recovery or the gruesome downtrend would still continue.
Technical Analysis
By: Edris
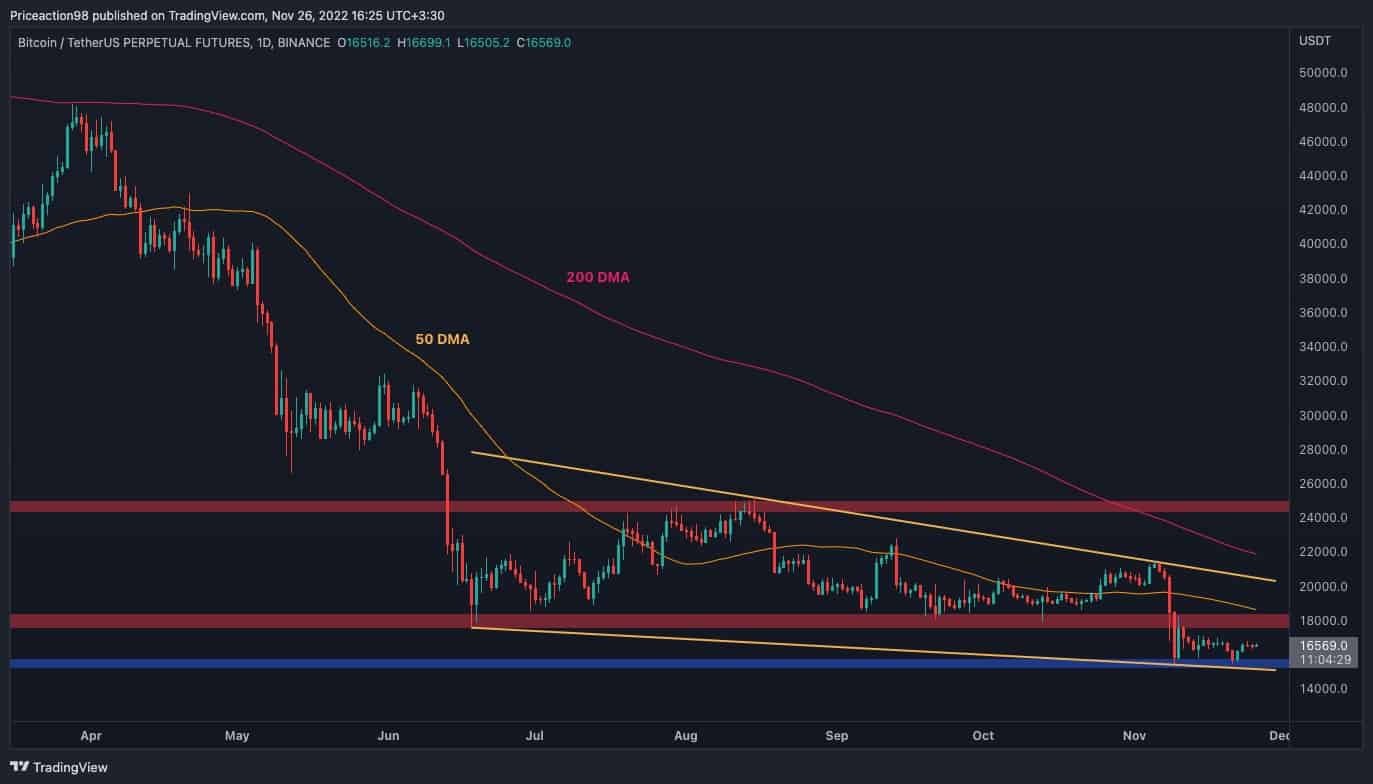
The Daily Chart:
Looking at the daily chart, the correction has been halted over the last couple of weeks above the $16K support level.
Regardless, bullish momentum is still lacking, and the price has failed to retest the $18K level. Interestingly, a wide descending channel, considered a bullish reversal pattern, seems to be forming in this timeframe. So, a breakout from the higher boundary of the pattern could signal the beginning of a mid-term bullish trend and potentially the end of the bear market.
However, the mentioned $18K level, alongside the 50-day moving average located around $19K, will be strong obstacles that could keep the price from even reaching the higher trendline of the channel. On the other hand, the probability of a bearish breakout and failure of the pattern cannot be dismissed, and it would likely lead to a further plunge and elongation of the bear market.
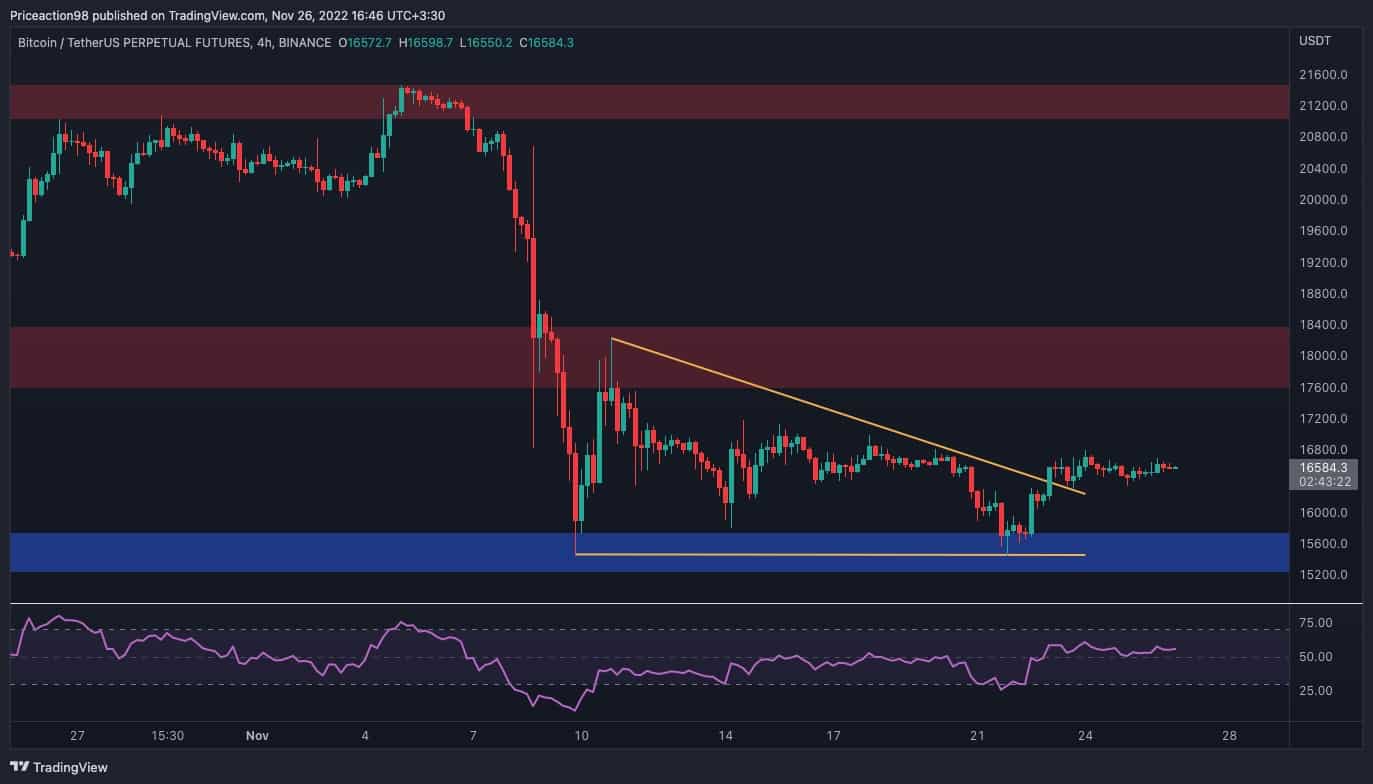
The 4-Hour Chart:
The 4-hour timeframe offers a clear view of the current consolidation. The price has recently rebounded from the $15,500 level for the second time and broken the triangle pattern to the upside. Theoretically, a rally toward $18K could be expected from a classical price action standpoint.
However, the bullish momentum has faded over the last few days, raising doubts about whether the rebound would continue. The RSI indicator, measuring the current price momentum, is also approximately flat. Although the price shows little intent to rally higher since RSI is trading above 50%, the bulls are still relatively in control, and a positive continuation towards $18K might still be the case.