Ripple’s monthly candlestick appears to be closing in the red tonight, despite the fact that the long lower wick implies the presence of buyers around %excerpt%.3. However, the cryptocurrency’s performance in the past month has actually been stronger than Bitcoin’s. Technical Analysis By Grizzly The Weekly Chart The weekly chart reveals that the downward trend initiated in April 2021 is continuing. The pair has made multiple attempts to break through the descending resistance line (in red) but has been stalled each time. The 14-week RSI, on the other hand, has moved away from the oversold zone and is approaching the middle line. The primary impediment to gaining momentum in the bullish zone with this indicator is the diagonal resistance (in yellow). If XRP can break through the
Topics:
CryptoVizArt considers the following as important: Ripple (XRP) Price, XRP Analysis, xrpbtc, xrpusd
This could be interesting, too:
Jordan Lyanchev writes Ripple’s (XRP) Surge to Triggers Over Million in Short Liquidations
Jordan Lyanchev writes Trump Confirms Work on Strategic Crypto Reserve: XRP, ADA, SOL Included
Dimitar Dzhondzhorov writes Is a Major Ripple v. SEC Lawsuit Development Expected This Week? Here’s Why
Mandy Williams writes Ripple Releases Institutional DeFi Roadmap for XRP Ledger in 2025
Ripple’s monthly candlestick appears to be closing in the red tonight, despite the fact that the long lower wick implies the presence of buyers around $0.3. However, the cryptocurrency’s performance in the past month has actually been stronger than Bitcoin’s.
Technical Analysis
By Grizzly
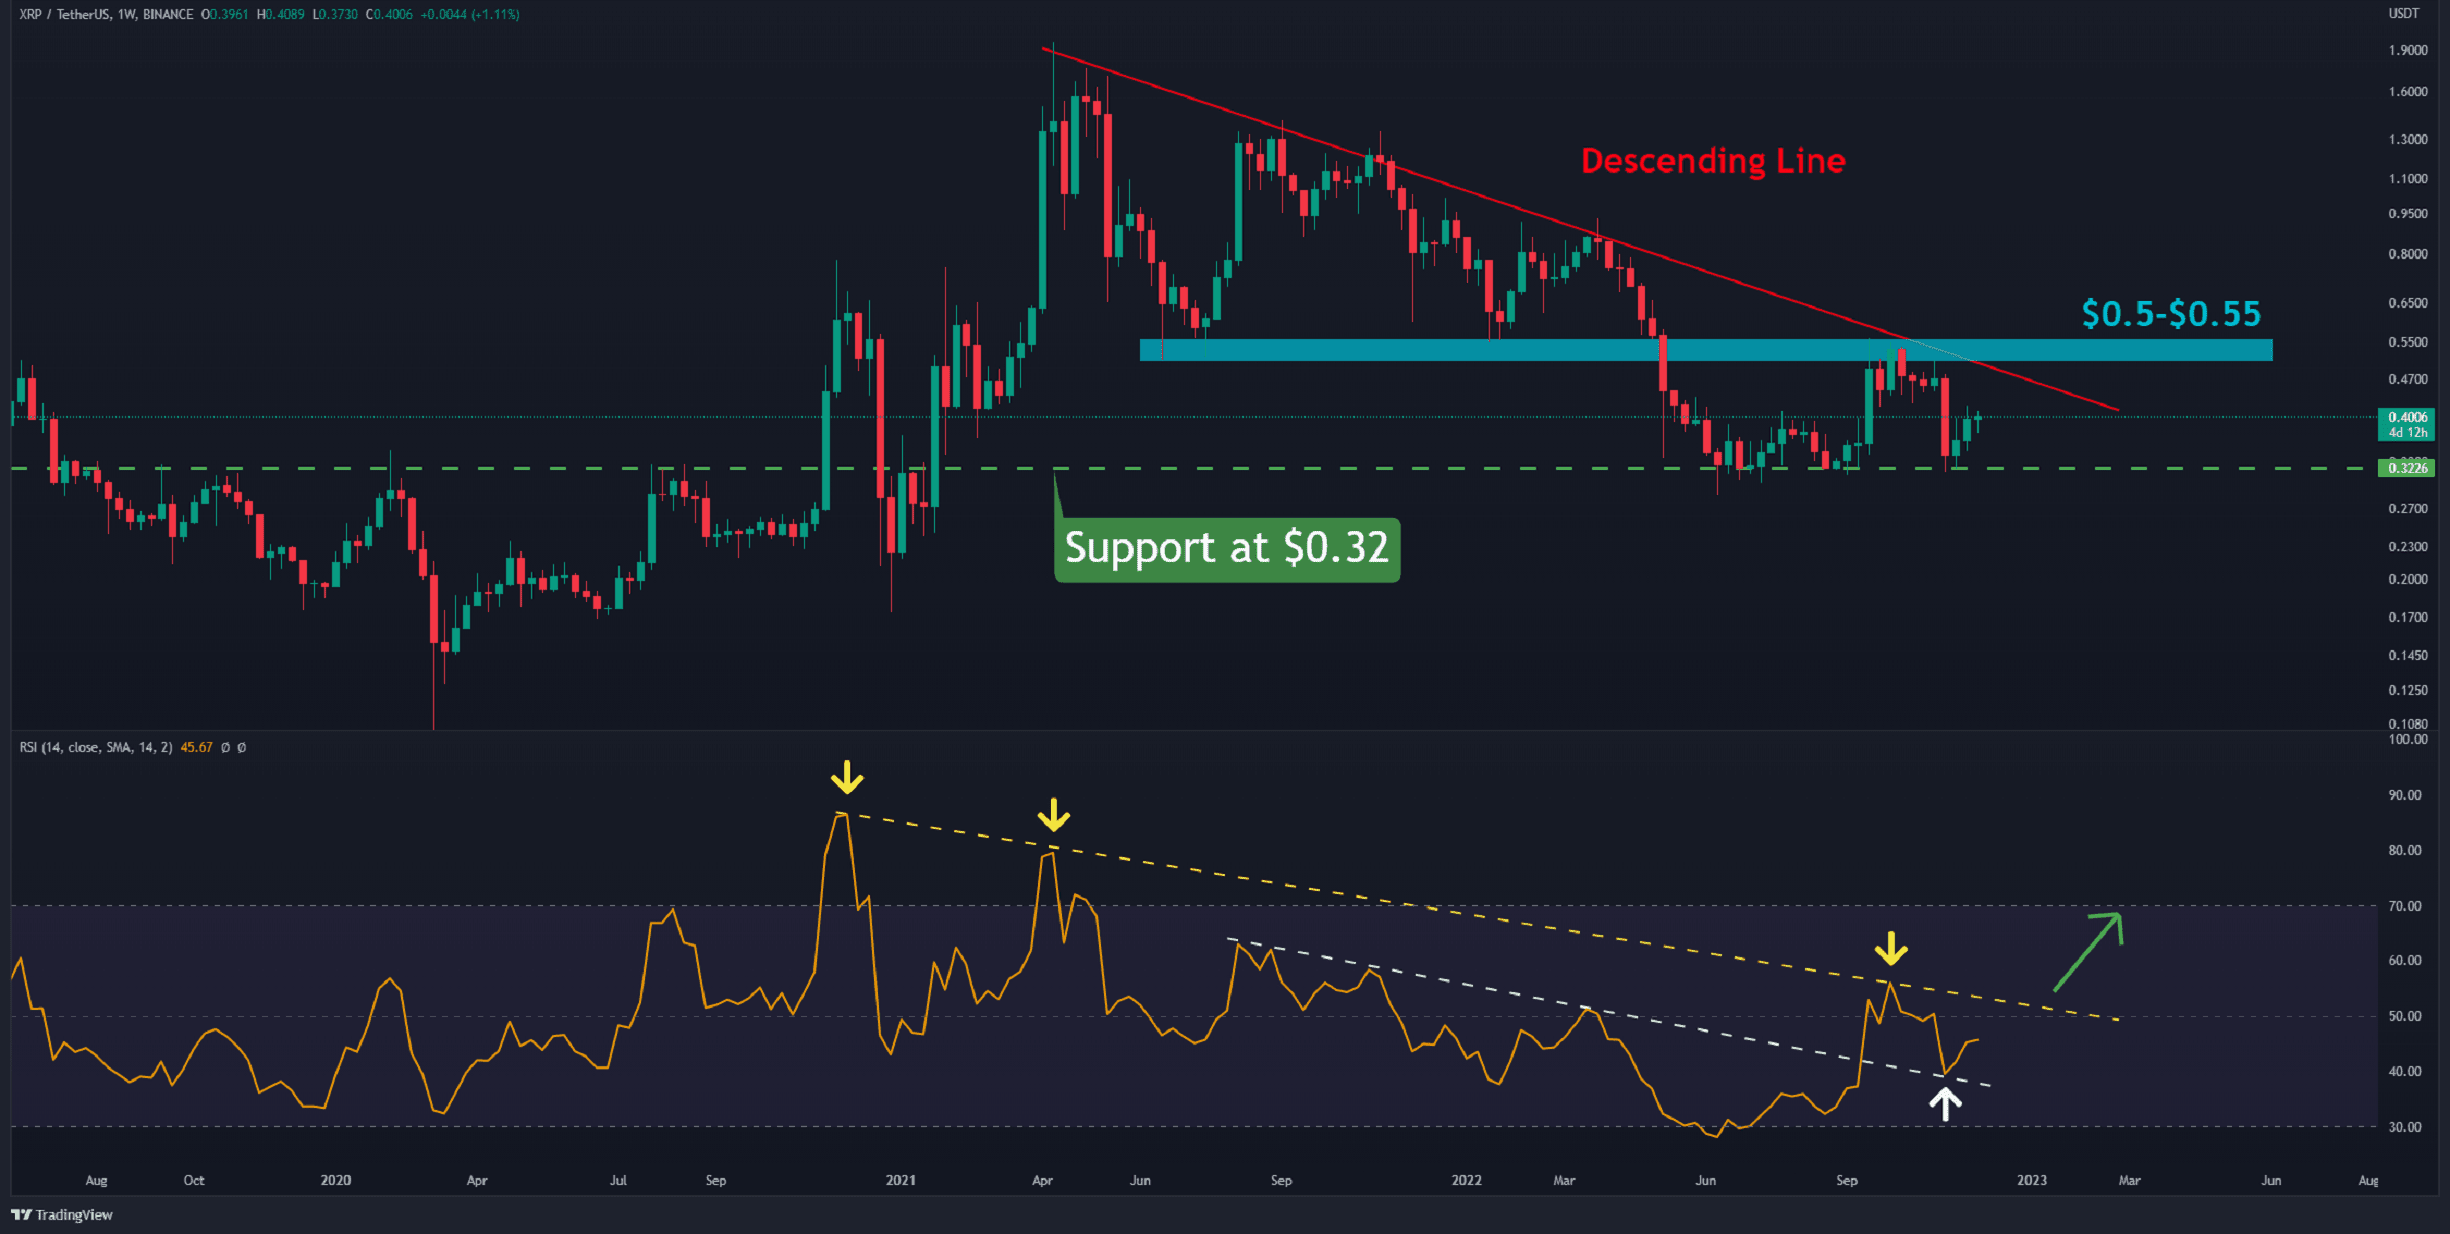
The Weekly Chart
The weekly chart reveals that the downward trend initiated in April 2021 is continuing. The pair has made multiple attempts to break through the descending resistance line (in red) but has been stalled each time.
The 14-week RSI, on the other hand, has moved away from the oversold zone and is approaching the middle line. The primary impediment to gaining momentum in the bullish zone with this indicator is the diagonal resistance (in yellow).
If XRP can break through the resistance zone between $0.5 and $0.55 (in light blue), an upward surge with a goal of $0.8 will be a bit more likely to take place. This rally corresponds with the RSI moving above the baseline, which is a positive sign.
If the asset closes below $0.3, sell setups would be triggered in what will likely be a bearish scenario. In this case, the likelihood of touching $0.24 increases.
Moving Averages:
MA20: $0.40
MA50: $0.53
MA100: $0.70
MA200: $0.49
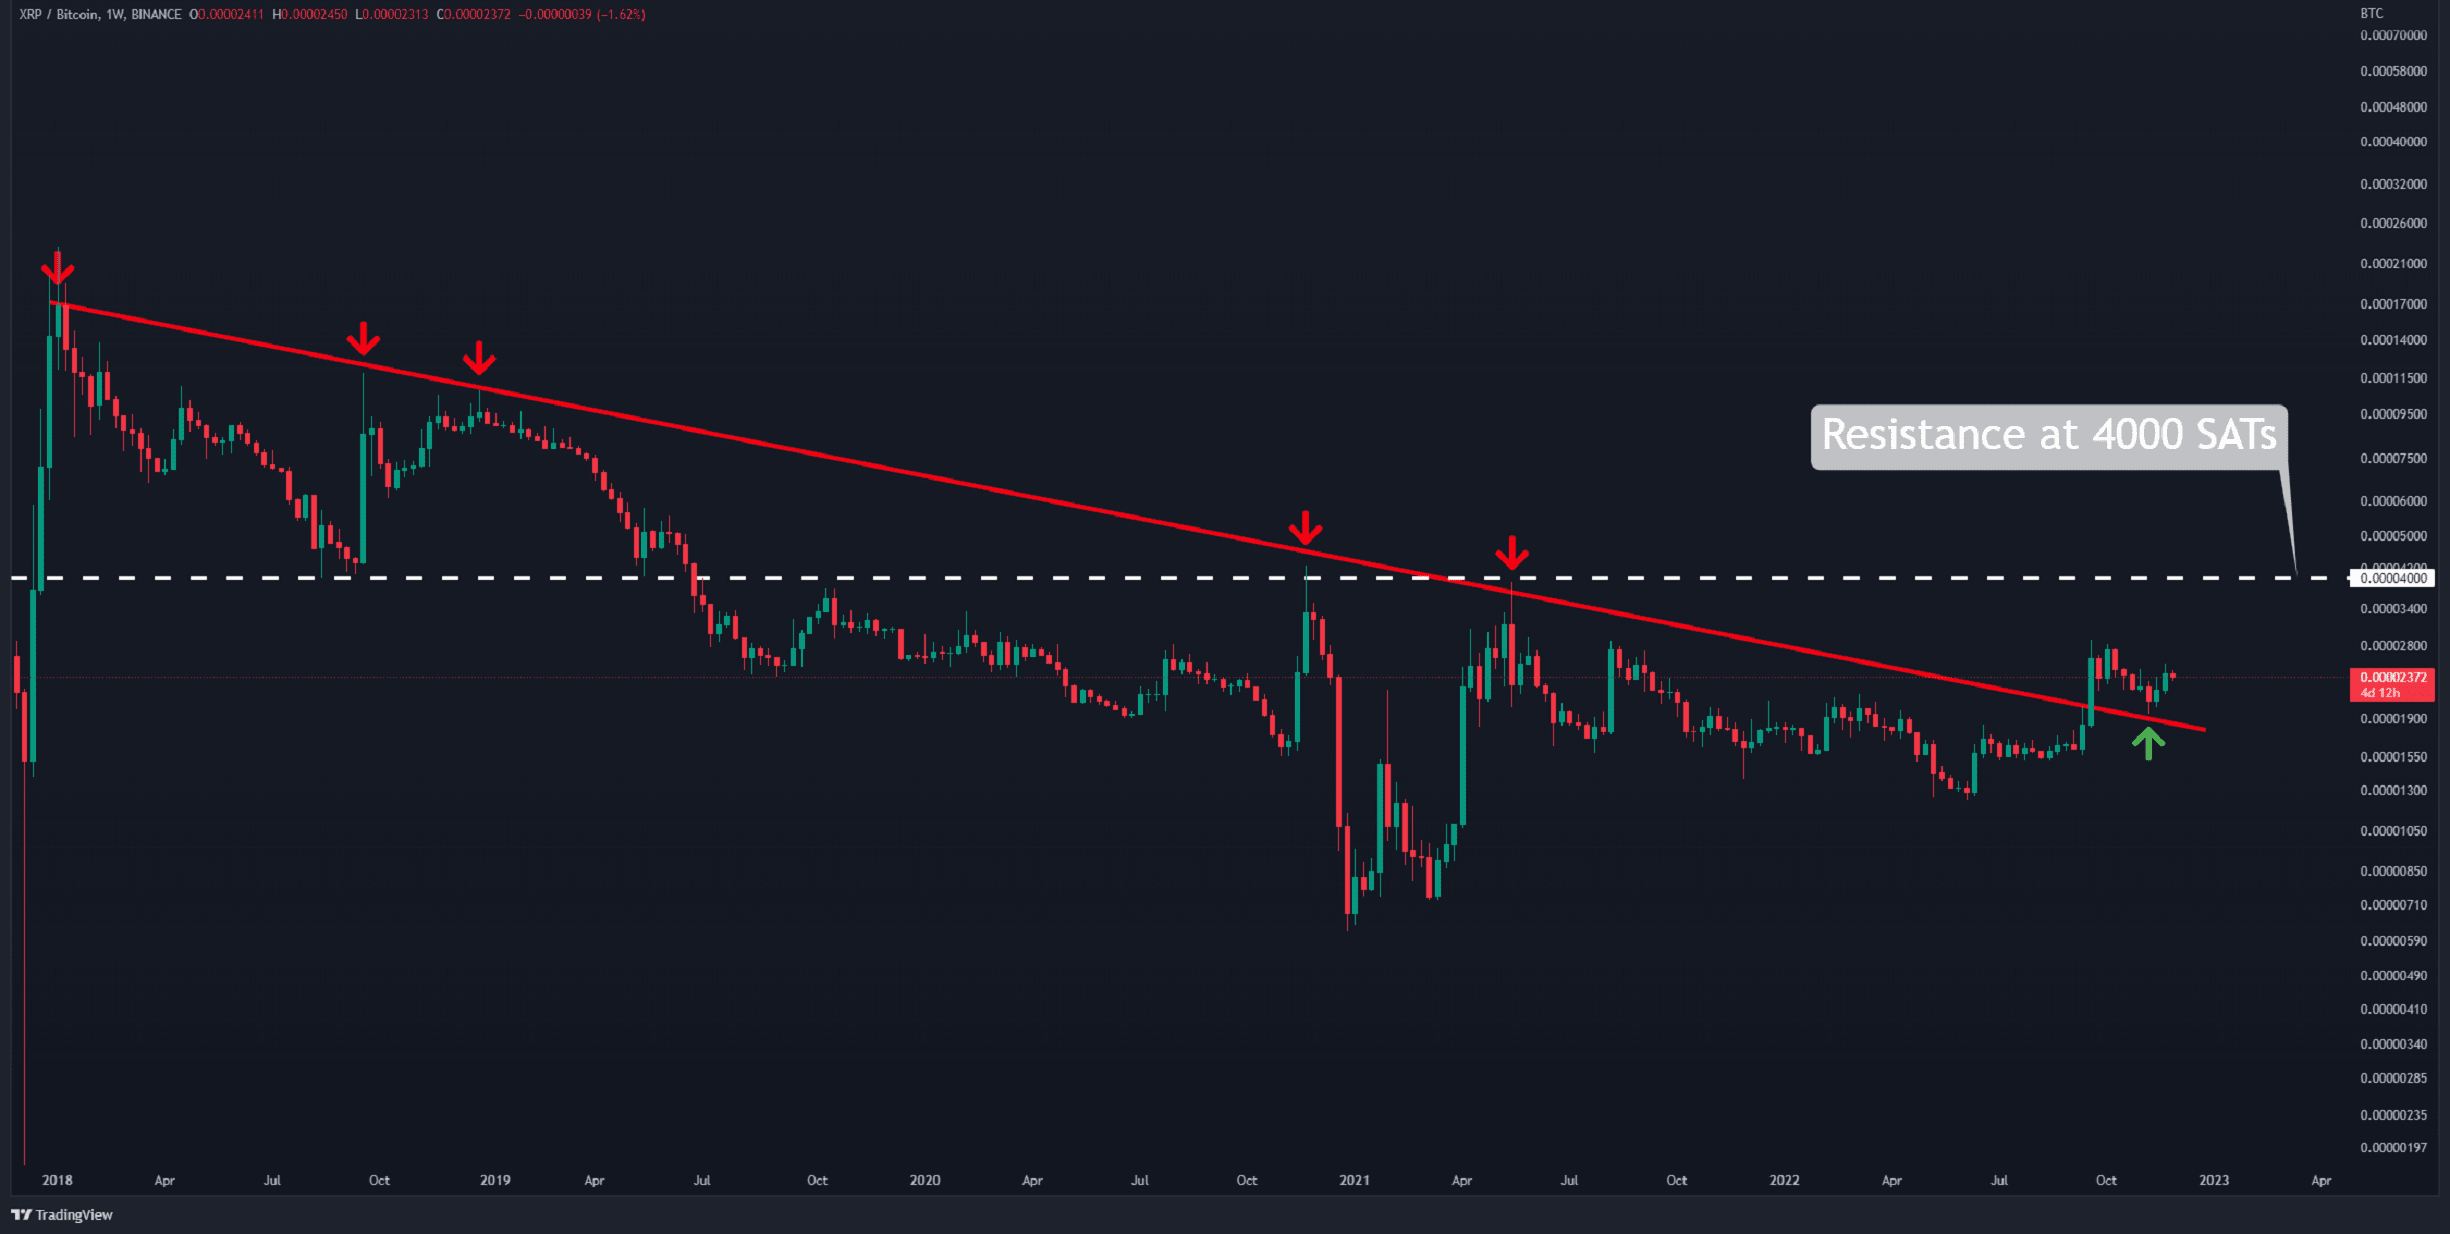
The XRP/BTC Chart
After a lengthy period, XRP has managed to emerge from below the descending line (in red) against Bitcoin. Ripple is now prepared to retest the overhead barrier at 2900 SATs, which it failed to break on the first attempt.
If it cracks, the next hurdle will be 4000 SATs (in white), the level that Ripple has been trading below for more than three years.
When the pair drops below 2000 SATs, the bullish scenario will be breached.
Key Support Levels: 2000 SATS, 1800 SATs
Key Resistance Levels: 2900 SATs, 4000 SATs