Over the past few weeks, Bitcoin’s price has been consolidating within a narrow range after breaking below the 50-day moving average. The market is currently situated between two notable levels, leaving room for several potential scenarios to unfold. Technical Analysis By: Edris The Daily Chart: The price on the daily timeframe has yet to display a notable upward or downward movement. If a rally takes place in the upcoming weeks, the first resistance level to watch is the 50-day moving average positioned around K, followed by the crucial K level. On the other hand, for holders, the key support areas to rely on are the K level and the 200-day moving average of around K. The RSI indicator remains below the 50% threshold without much movement, indicating the
Topics:
CryptoVizArt considers the following as important: Bitcoin (BTC) Price, BTC Analysis, BTCEUR, BTCGBP, btcusd, btcusdt
This could be interesting, too:
Chayanika Deka writes XRP, SOL, and ADA Inclusion in US Crypto Reserve Pushes Traders on Edge
Chayanika Deka writes Why Arthur Hayes Is Bullish on Bitcoin Under Trump’s Economic Strategy
Mandy Williams writes Why the Bitcoin Market Is Stuck—and the Key Metric That Could Change It: CryptoQuant CEO
Wayne Jones writes Metaplanet Acquires 156 BTC, Bringing Total Holdings to 2,391
Over the past few weeks, Bitcoin’s price has been consolidating within a narrow range after breaking below the 50-day moving average. The market is currently situated between two notable levels, leaving room for several potential scenarios to unfold.
Technical Analysis
By: Edris
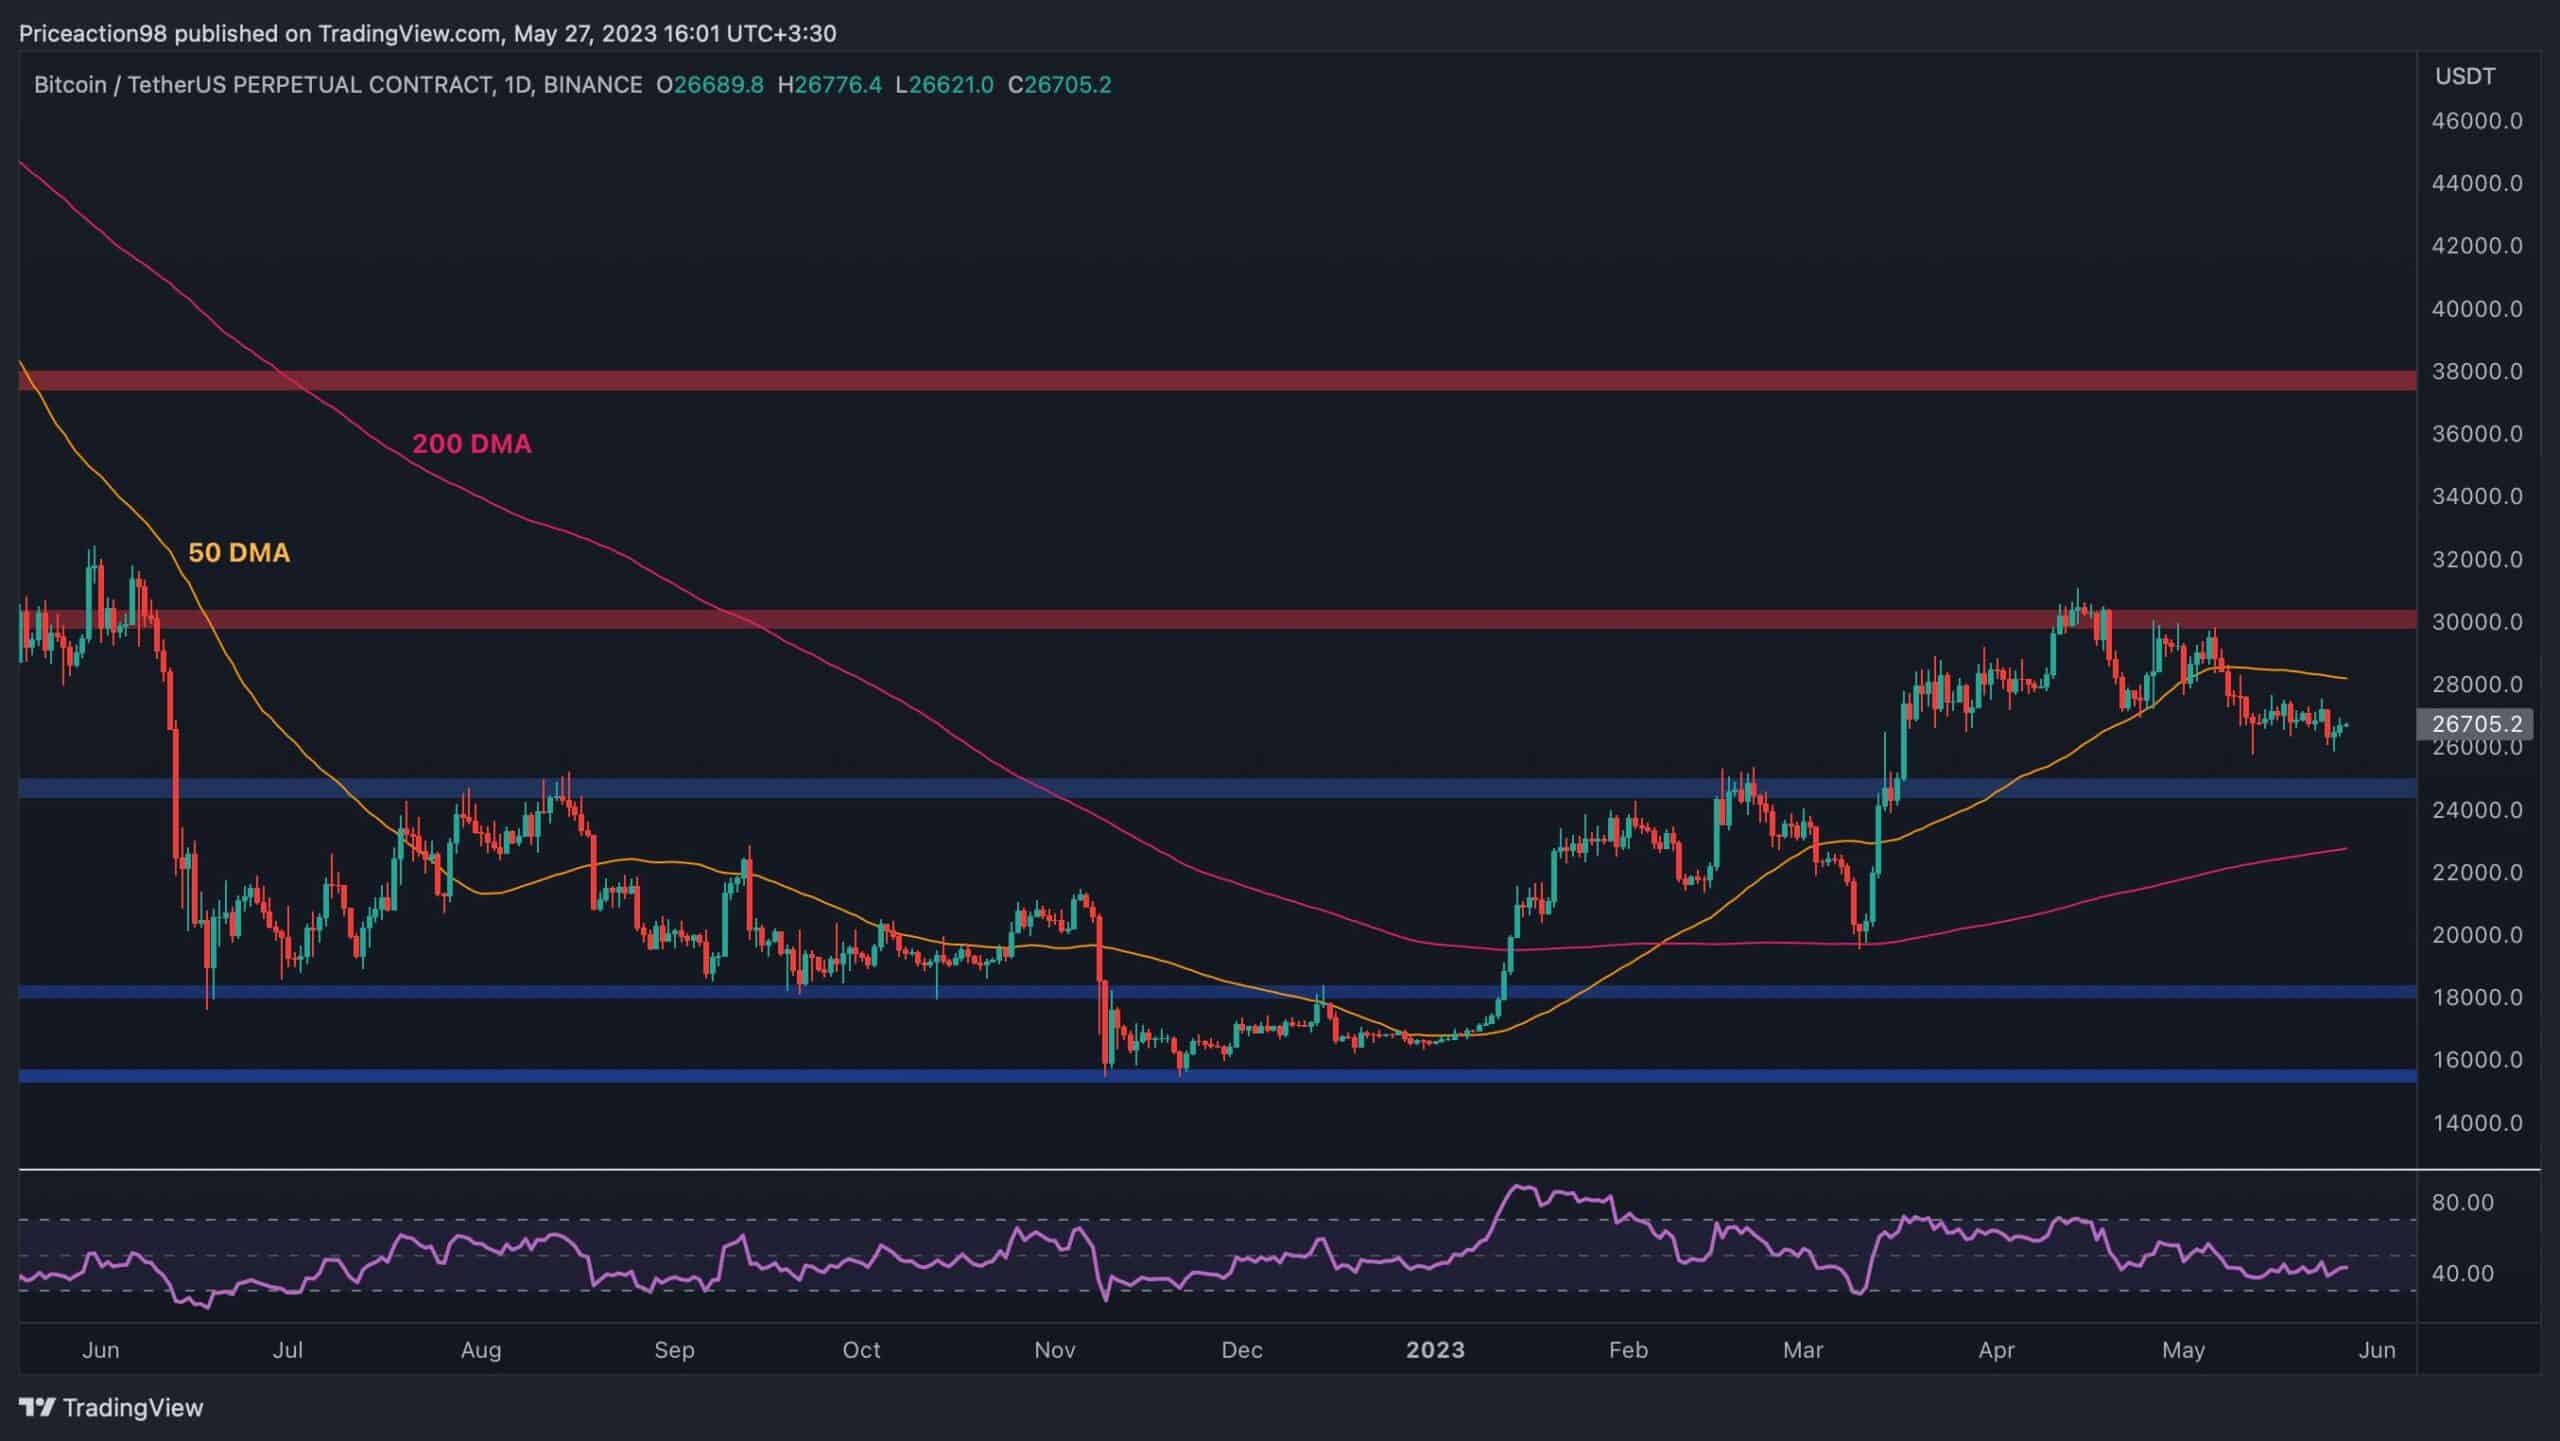
The Daily Chart:
The price on the daily timeframe has yet to display a notable upward or downward movement. If a rally takes place in the upcoming weeks, the first resistance level to watch is the 50-day moving average positioned around $28K, followed by the crucial $30K level.
On the other hand, for holders, the key support areas to rely on are the $25K level and the 200-day moving average of around $23K. The RSI indicator remains below the 50% threshold without much movement, indicating the current bearish momentum and increasing the likelihood of a downward move in the short term.
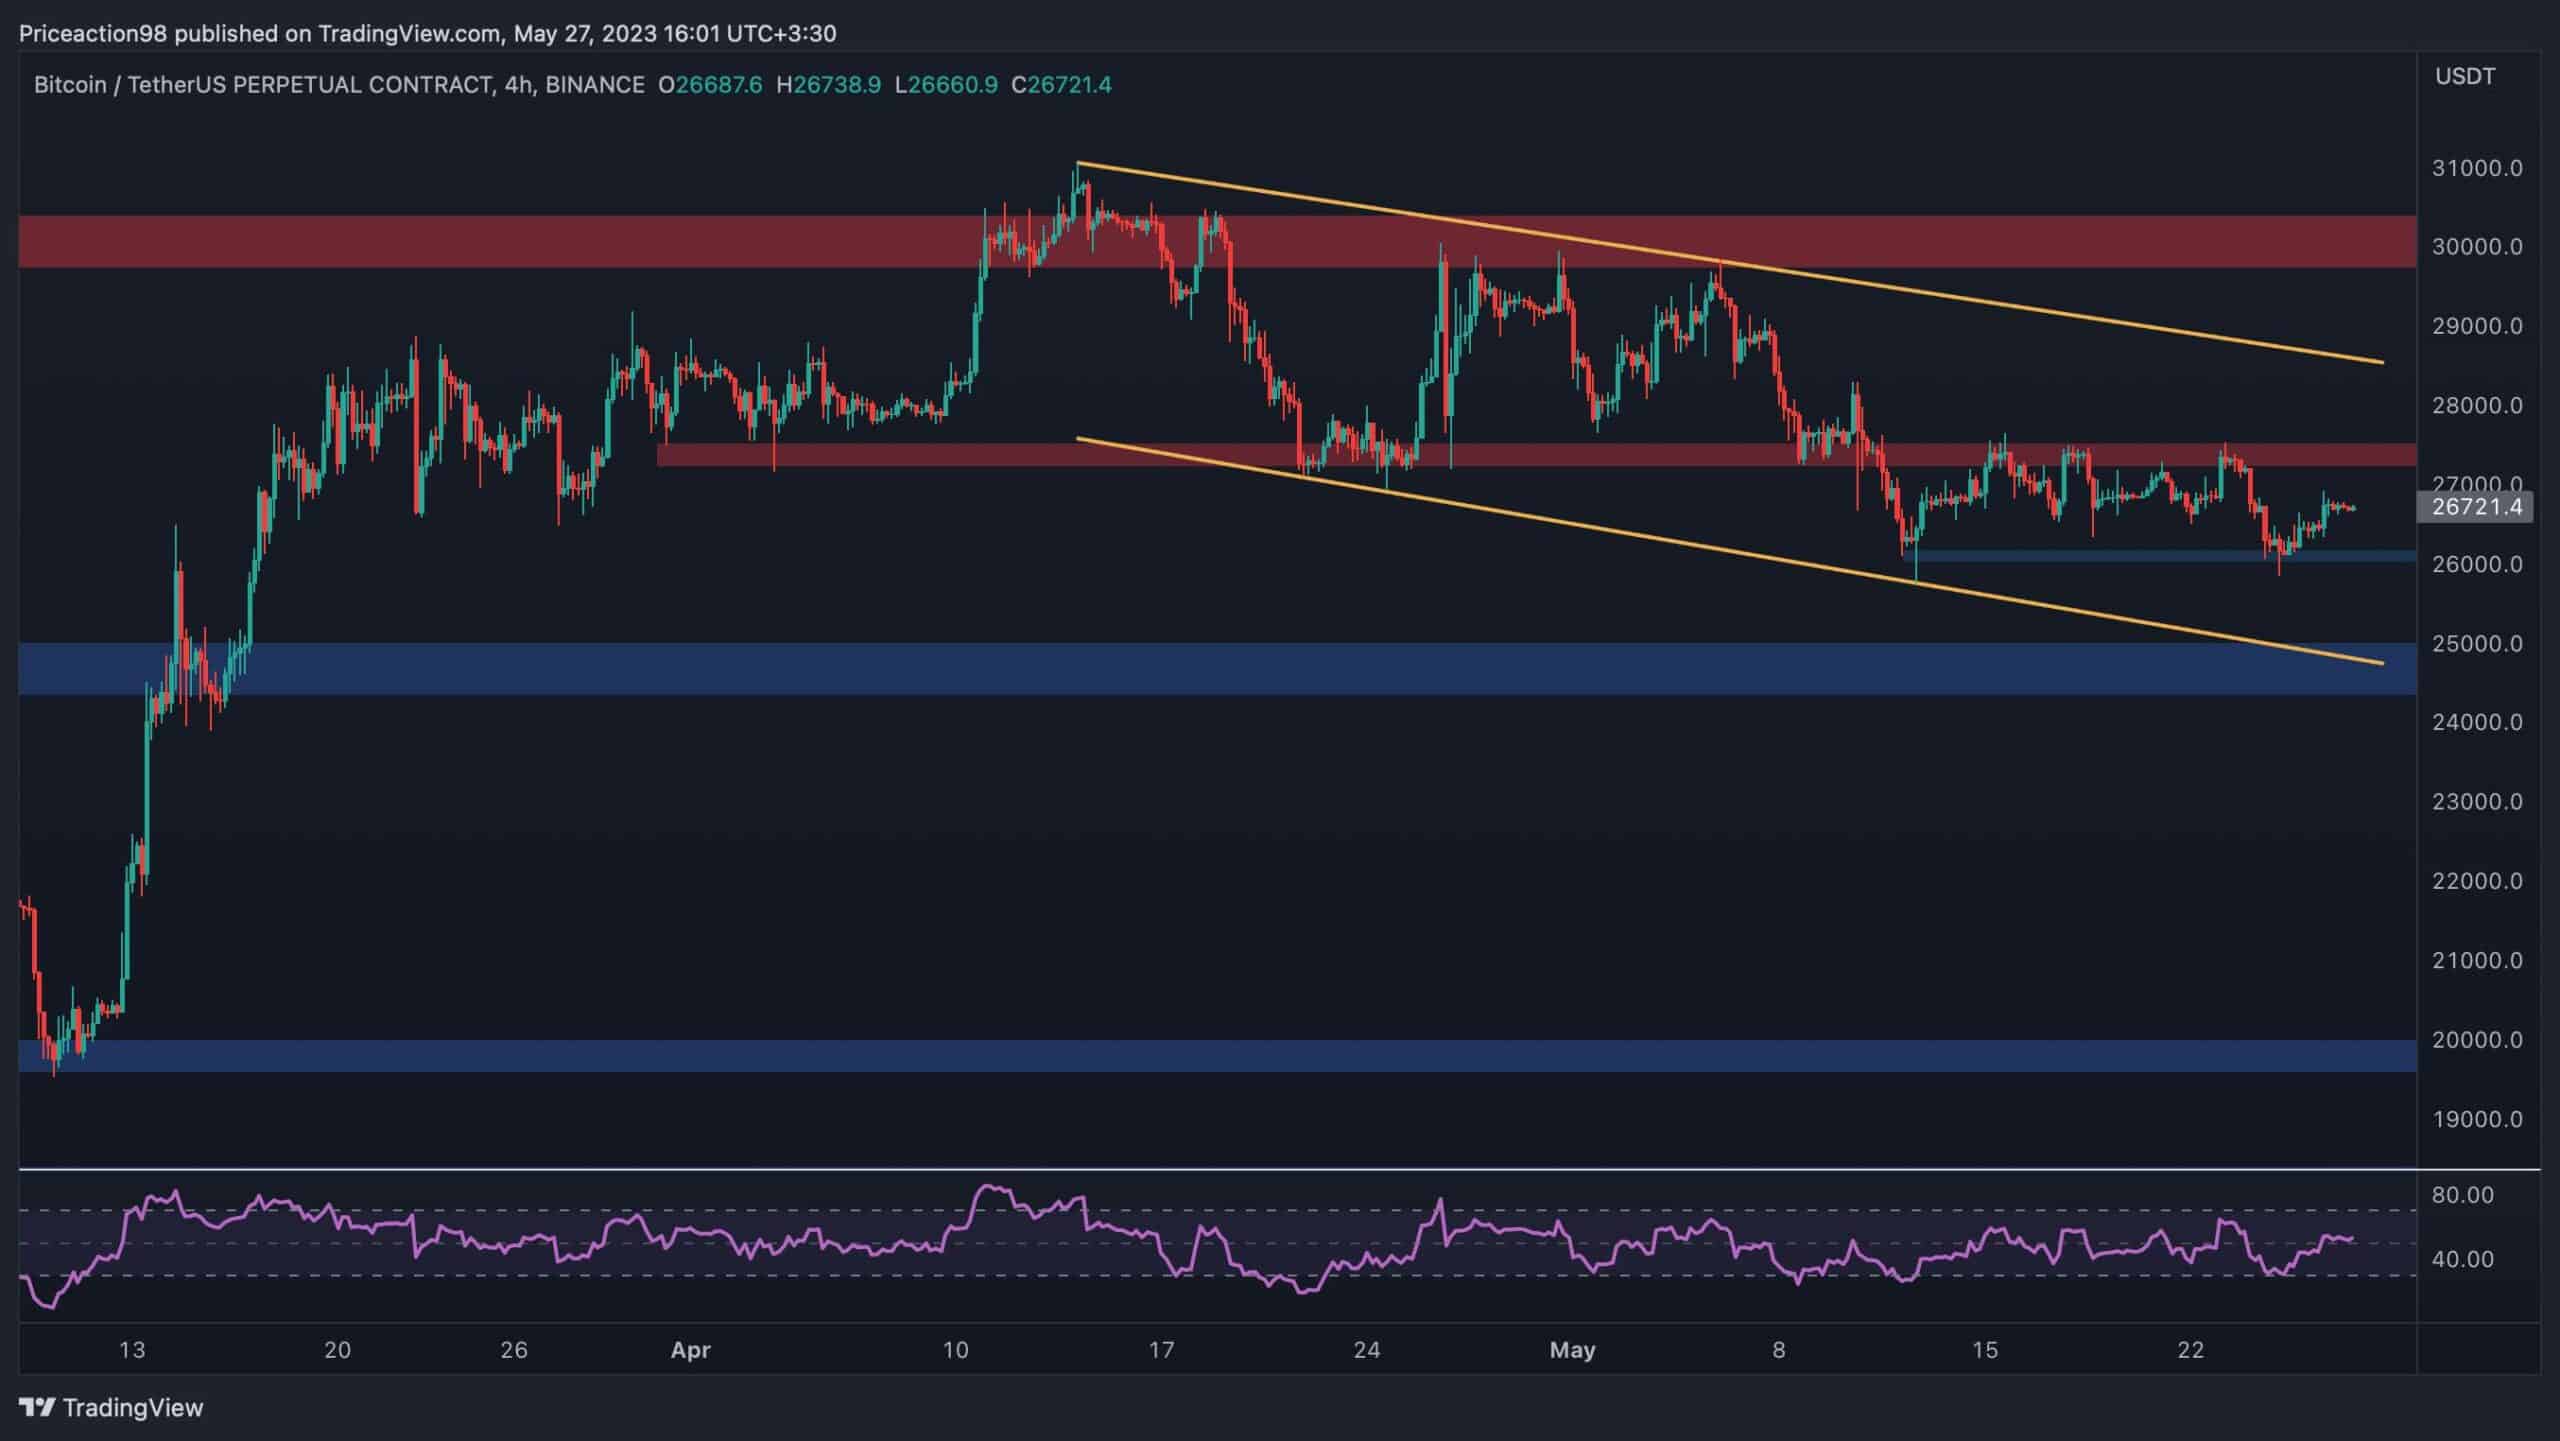
The 4-Hour Chart:
On the 4-hour chart, the price remains within a significant descending channel. Although there was a recent upward push prompted by the minor support level at $26K, there is still a strong possibility of a decline towards the lower boundary of the channel and the support area at $25K.
Conversely, for a rally to occur, the market must first break through the resistance level at $27,500. If this happens, the chances of a breakout above the channel and a subsequent retest of the resistance area at $30K would increase.
On-chain Analysis
By: Edris
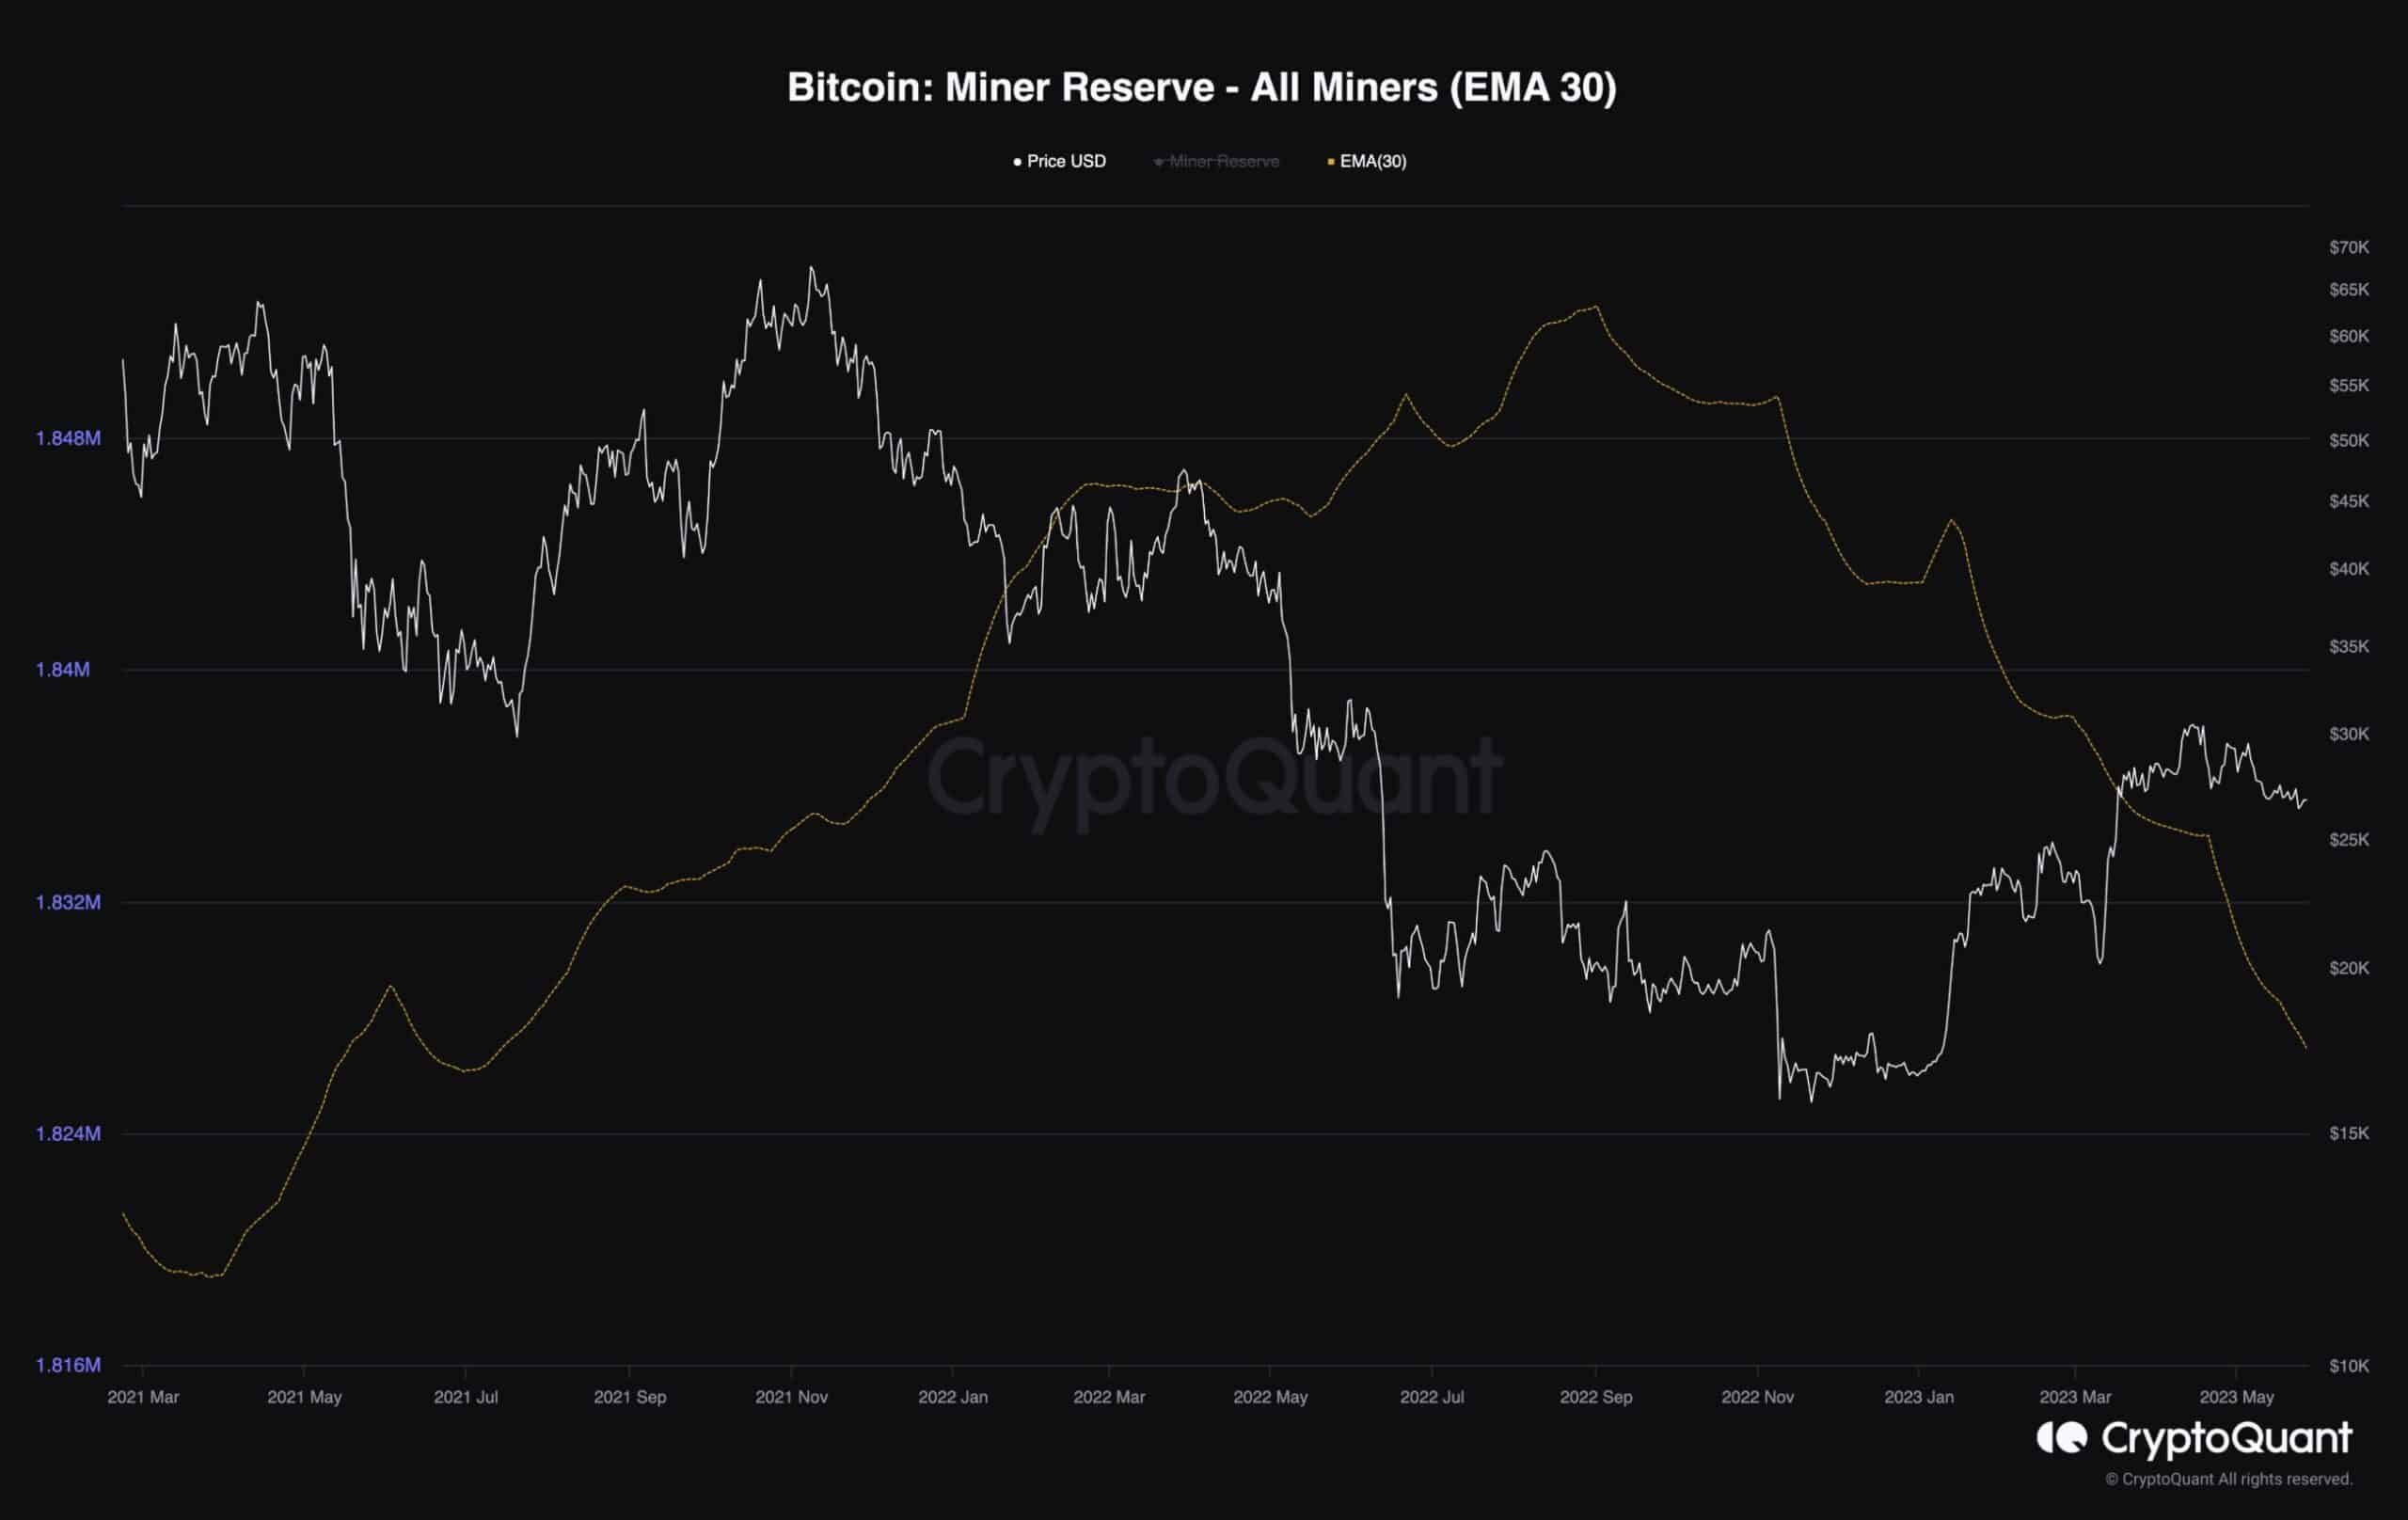
Bitcoin Miners Reserve
While Bitcoin’s price has been relatively stagnant, examining on-chain metrics can help us understand the underlying dynamics.
The following chart focuses on the Bitcoin miner reserve metric, which quantifies the amount of BTC held by miners, a significant group within the ecosystem.
The data clearly illustrates a consistent decline in this metric over the past 9 months, indicating that miners have been selling their coins to cover operational expenses or mitigate risks in an uncertain macroeconomic climate.
This decline has intensified, signifying that miners are capitalizing on the recent price increase to sell their coins at a higher level. If this trend persists, a bearish reversal will likely occur in the near future. The continuous selling pressure from miners could result in an oversupply of bitcoins in the market, leading to a potential downtrend in price.