Bitcoin has been following a bearish price action over the last few weeks following the rejection from the critical K resistance level. Yet, there is still hope to recover. Technical Analysis By Edris The Daily Chart The price has dropped significantly from the K resistance zone on the daily timeframe, breaking below both the 50-day and 200-day moving averages. The K support level is currently holding it. Yet, the 200-day moving average, located around the K mark, has rejected the price, pushing it towards the K level once more. Moreover, the 50-day moving average is trending towards the 200-day one, and a bearish crossover seems highly probable. Considering all the facts stated, the price is likely to drop much further if the K level fails to hold.
Topics:
CryptoVizArt considers the following as important: Bitcoin (BTC) Price, BTC Analysis, BTCEUR, BTCGBP, btcusd, btcusdt
This could be interesting, too:
Chayanika Deka writes XRP, SOL, and ADA Inclusion in US Crypto Reserve Pushes Traders on Edge
Chayanika Deka writes Why Arthur Hayes Is Bullish on Bitcoin Under Trump’s Economic Strategy
Mandy Williams writes Why the Bitcoin Market Is Stuck—and the Key Metric That Could Change It: CryptoQuant CEO
Wayne Jones writes Metaplanet Acquires 156 BTC, Bringing Total Holdings to 2,391
Bitcoin has been following a bearish price action over the last few weeks following the rejection from the critical $30K resistance level. Yet, there is still hope to recover.
Technical Analysis
By Edris
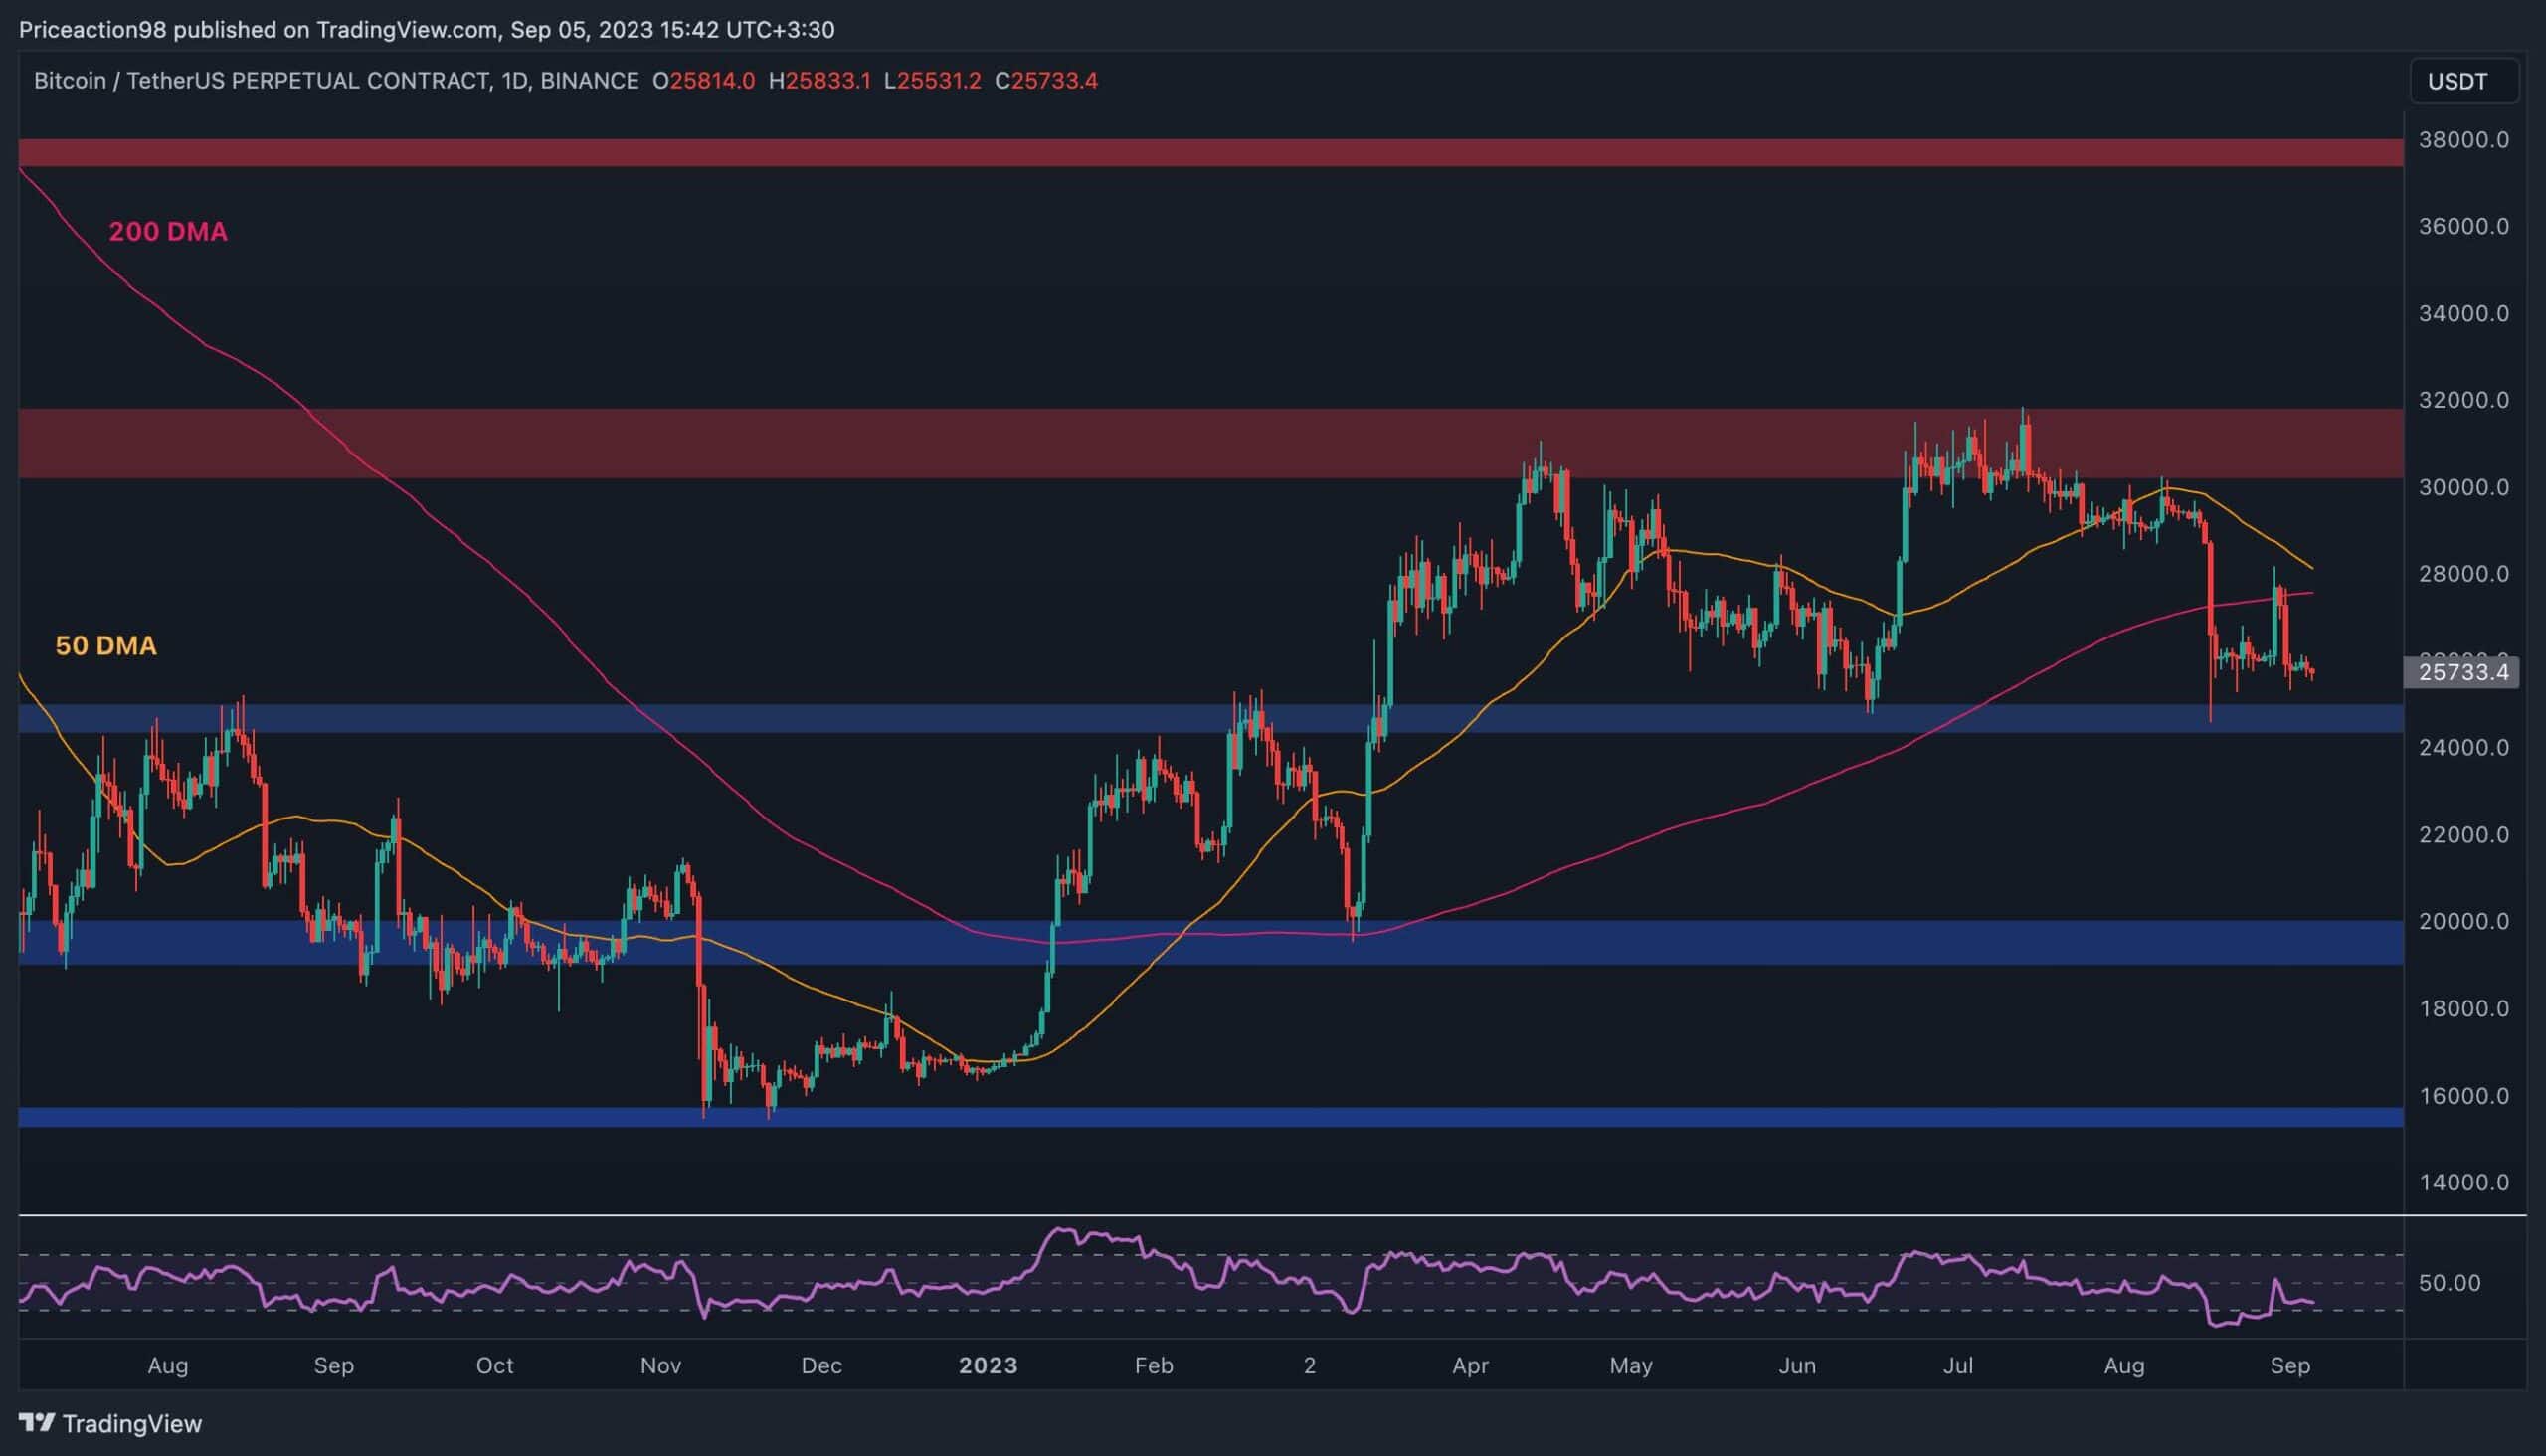
The Daily Chart
The price has dropped significantly from the $30K resistance zone on the daily timeframe, breaking below both the 50-day and 200-day moving averages. The $25K support level is currently holding it.
Yet, the 200-day moving average, located around the $28K mark, has rejected the price, pushing it towards the $25K level once more. Moreover, the 50-day moving average is trending towards the 200-day one, and a bearish crossover seems highly probable.
Considering all the facts stated, the price is likely to drop much further if the $25K level fails to hold.
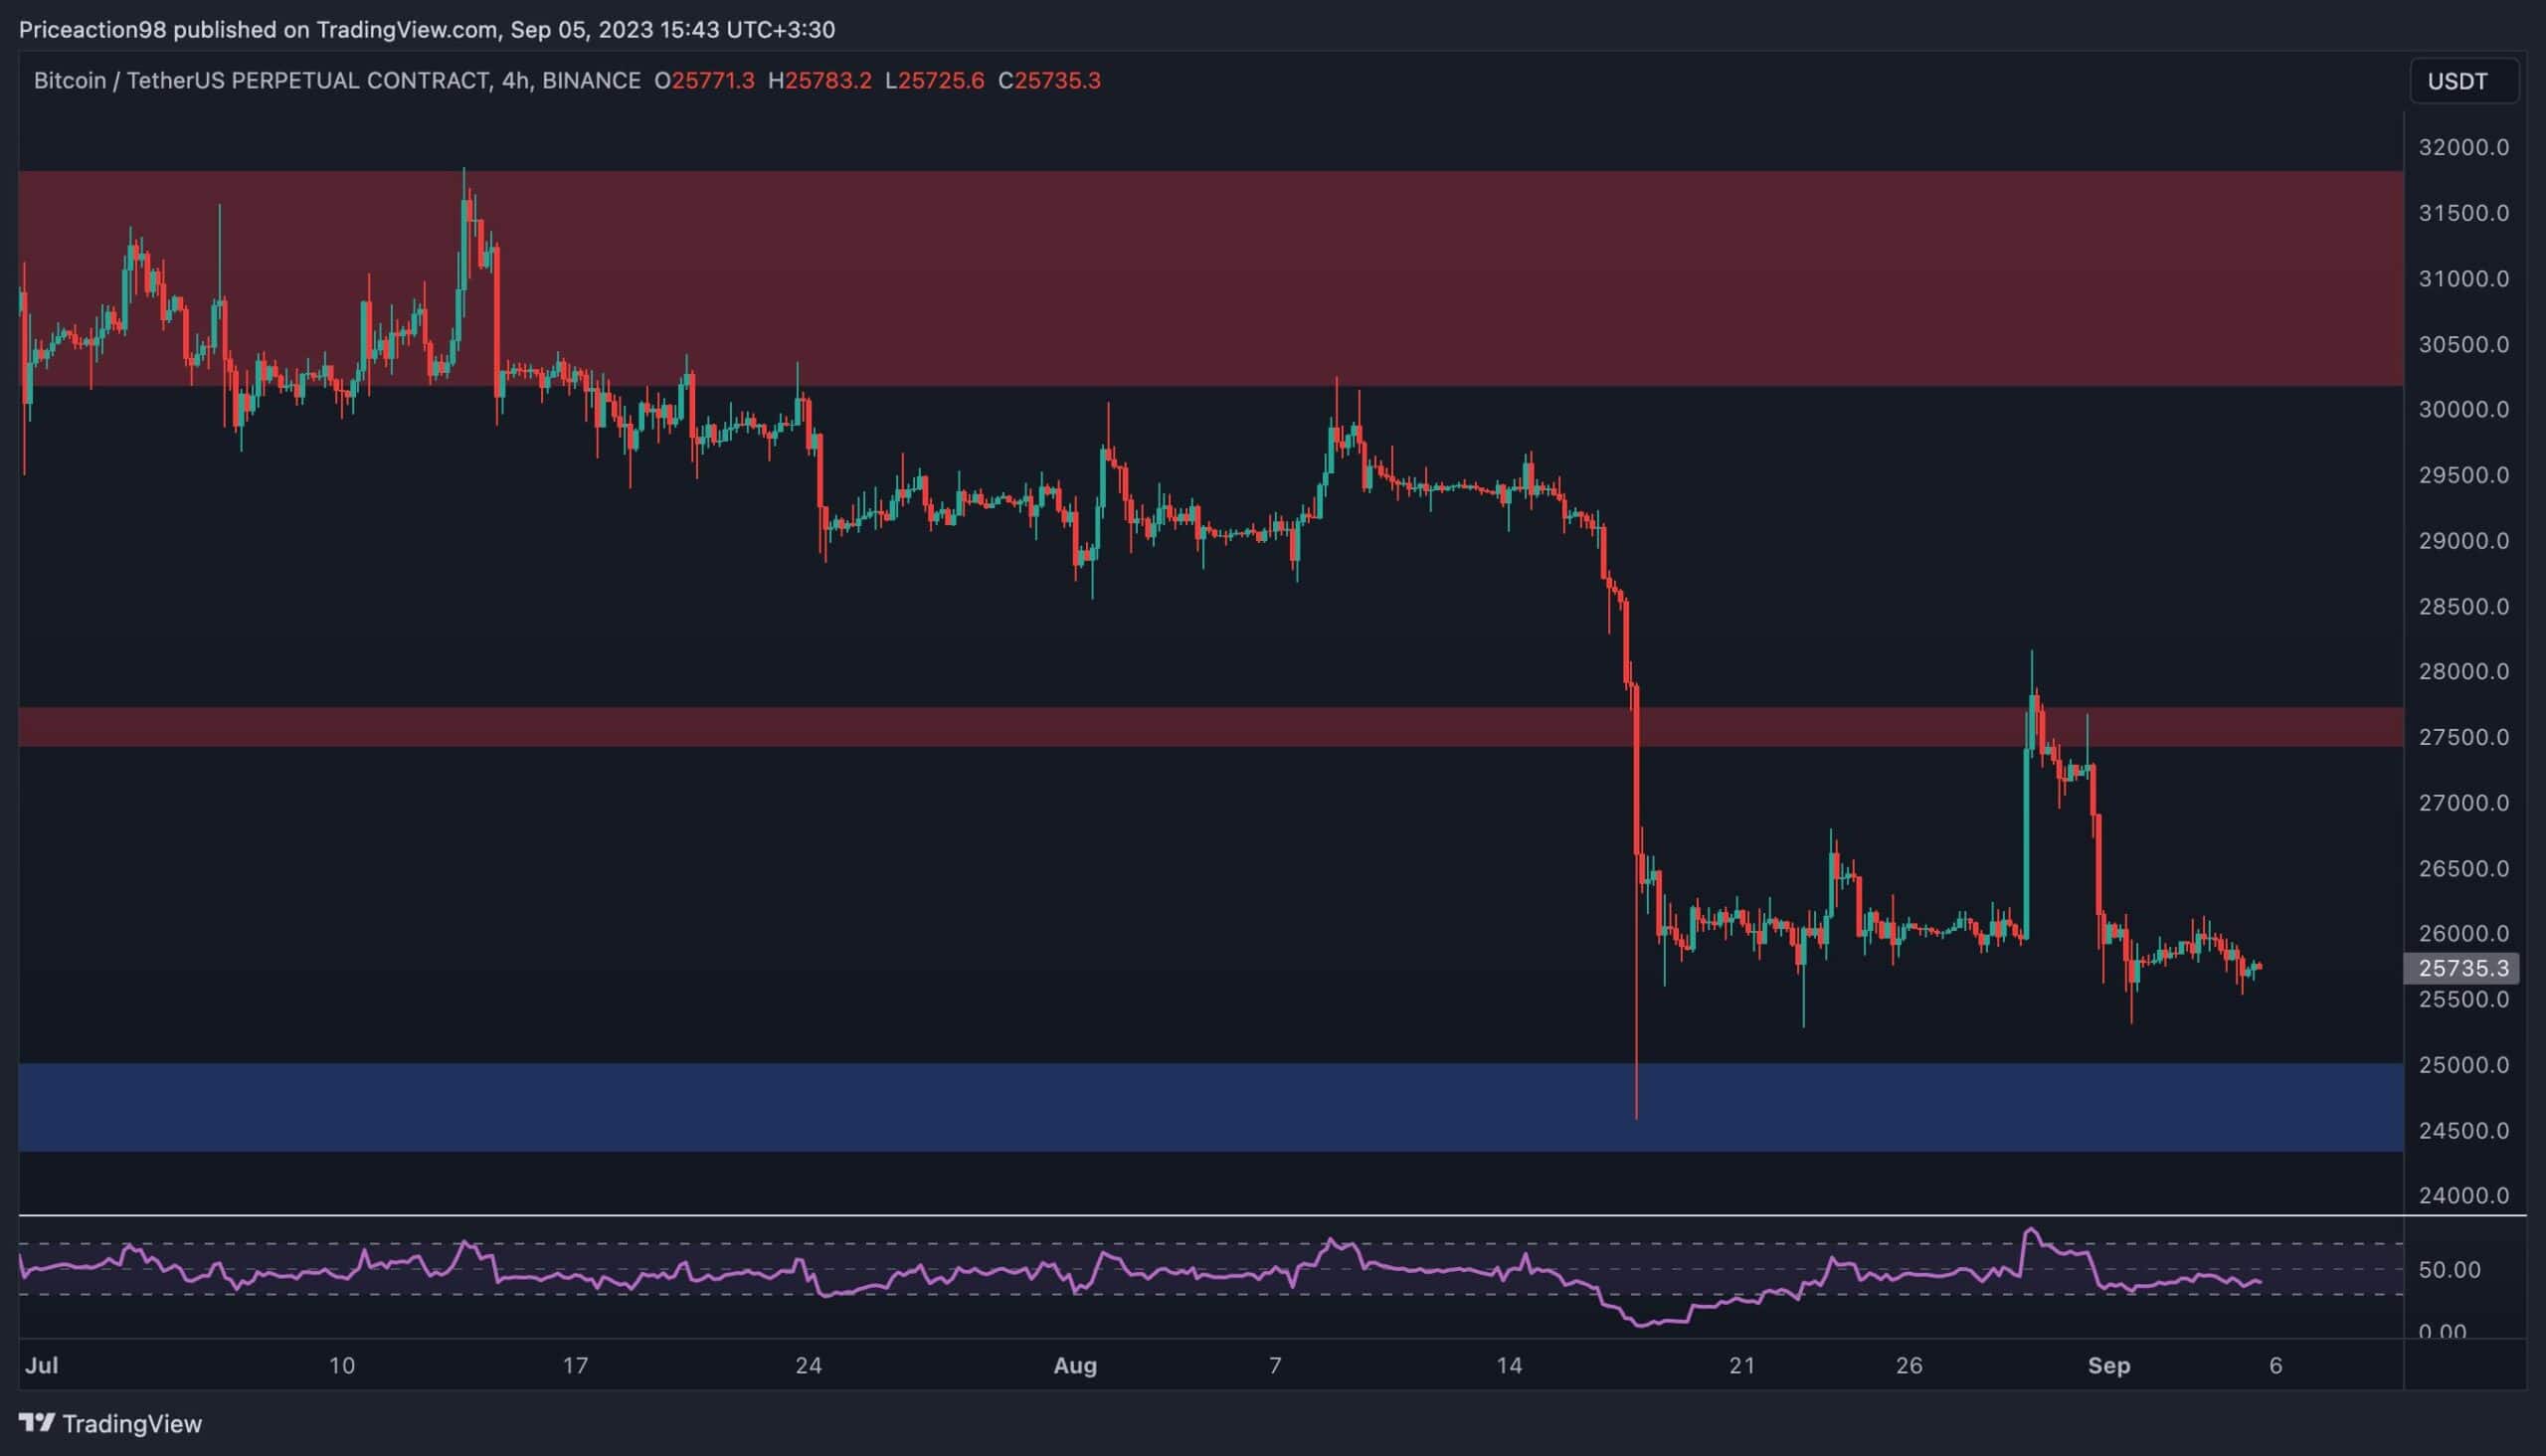
The 4-Hour Chart
Looking at the 4-hour chart, the recent price action becomes a lot clearer. The market has recently been rejected from the $27,500 short-term resistance level and has been declining towards the $25K support area.
The RSI indicator is also showing values below 50%, emphasizing the current bearish momentum in price. Therefore, if the $25K level breaks down, things can get ugly quickly.
On-Chain Analysis
By: Edris
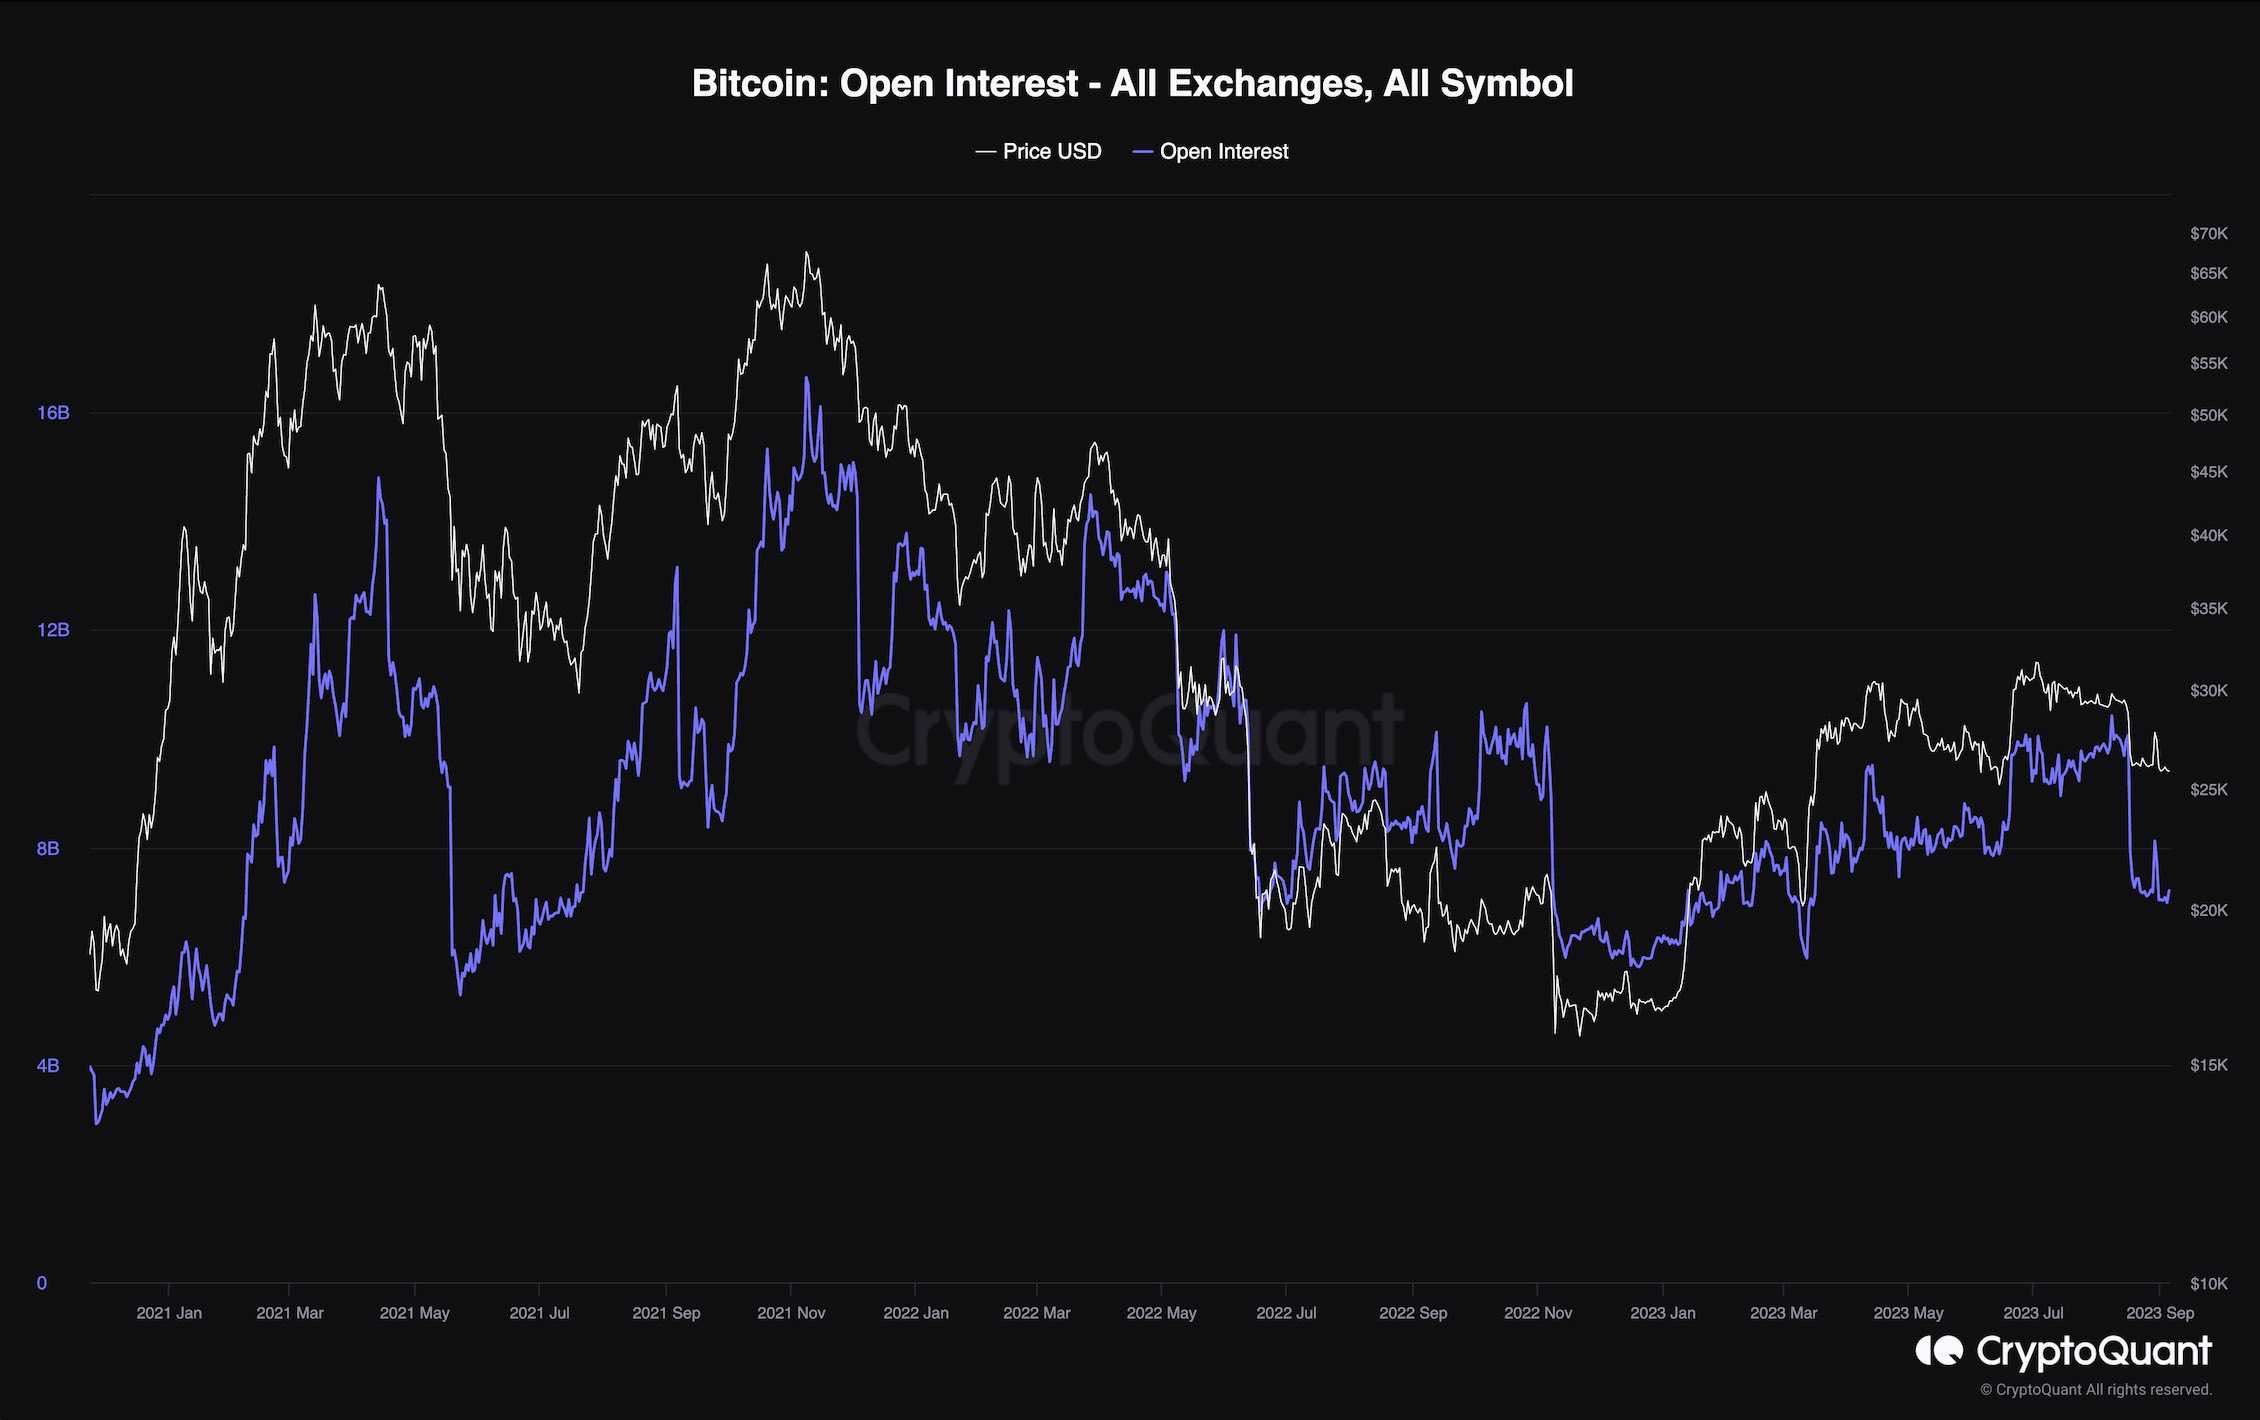
Bitcoin Open Interest
The recent drop in Bitcoin’s price has left many investors worried that more crashes will happen in the short term. It would be beneficial to analyze the futures market sentiment to determine whether that might be the case or not.
This chart presents Bitcoin’s open interest, which measures the number of open perpetual futures contracts on all centralized exchanges. Higher values are usually accompanied by increased volatility, while lower values usually lead to a more stable price action.
It is evident that following the recent price decline, the open interest metric has decreased significantly. Therefore, while there is still the possibility for more bearish price action, the volatility should be considerably lower, and a more gradual uptrend or downtrend is probable.