Presently, XRP’s price action is not looking overly promising against either USDT or BTC. Things could worsen in the coming days if all remains as it is right now. Technical Analysis By: Edris XRP/USDT Daily Chart On the daily chart, the price continues its struggle to break above the %excerpt%.43 resistance level, following a push above both the 50-day and 200-day moving average lines. In case the cryptocurrency finally moves beyond the aforementioned level, a rally toward the %excerpt%.55 resistance area could be expected. This scenario would likely lead to a new bullish phase in the short term. On the contrary, a rejection from the %excerpt%.43 level would likely initiate a decline toward the 50-day moving average located around the %excerpt%.35 mark, and the %excerpt%.3 support level would even be
Topics:
CryptoVizArt considers the following as important: Ripple (XRP) Price, XRP Analysis, xrpbtc, xrpusd
This could be interesting, too:
Jordan Lyanchev writes Ripple’s (XRP) Surge to Triggers Over Million in Short Liquidations
Jordan Lyanchev writes Trump Confirms Work on Strategic Crypto Reserve: XRP, ADA, SOL Included
Dimitar Dzhondzhorov writes Is a Major Ripple v. SEC Lawsuit Development Expected This Week? Here’s Why
Mandy Williams writes Ripple Releases Institutional DeFi Roadmap for XRP Ledger in 2025
Presently, XRP’s price action is not looking overly promising against either USDT or BTC. Things could worsen in the coming days if all remains as it is right now.
Technical Analysis
By: Edris
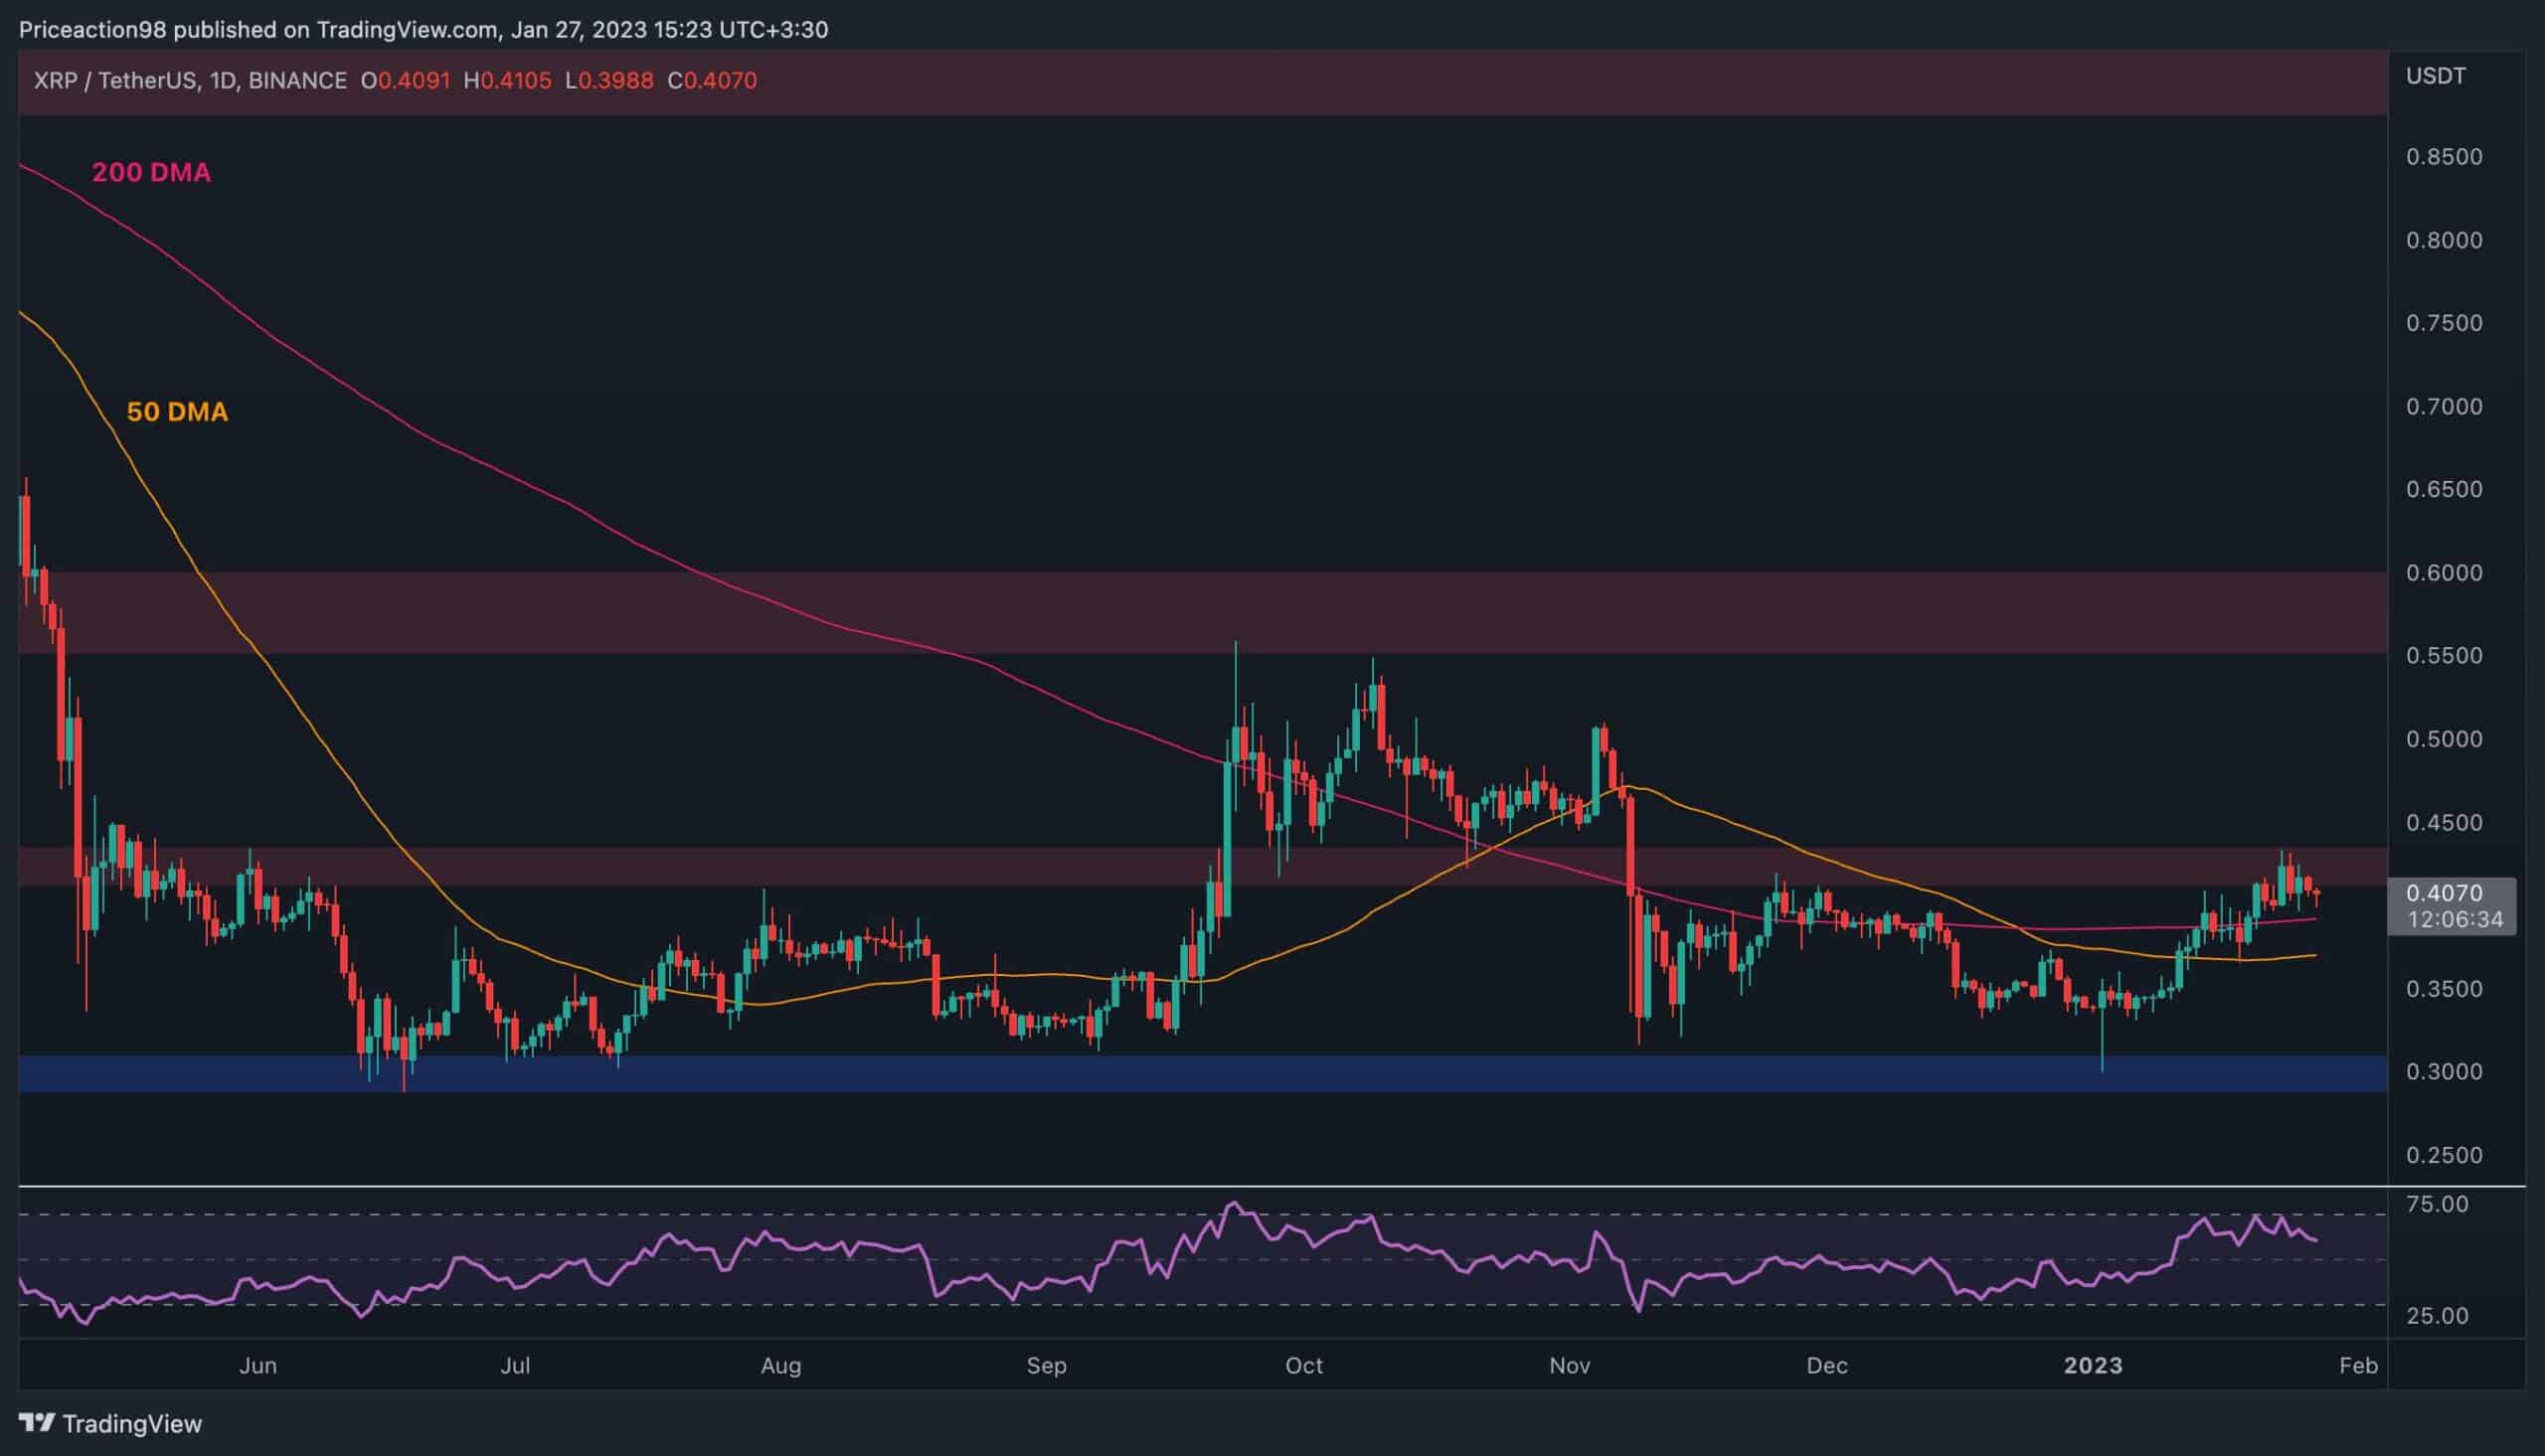
XRP/USDT Daily Chart
On the daily chart, the price continues its struggle to break above the $0.43 resistance level, following a push above both the 50-day and 200-day moving average lines.
In case the cryptocurrency finally moves beyond the aforementioned level, a rally toward the $0.55 resistance area could be expected. This scenario would likely lead to a new bullish phase in the short term.
On the contrary, a rejection from the $0.43 level would likely initiate a decline toward the 50-day moving average located around the $0.35 mark, and the $0.3 support level would even be highly probable.
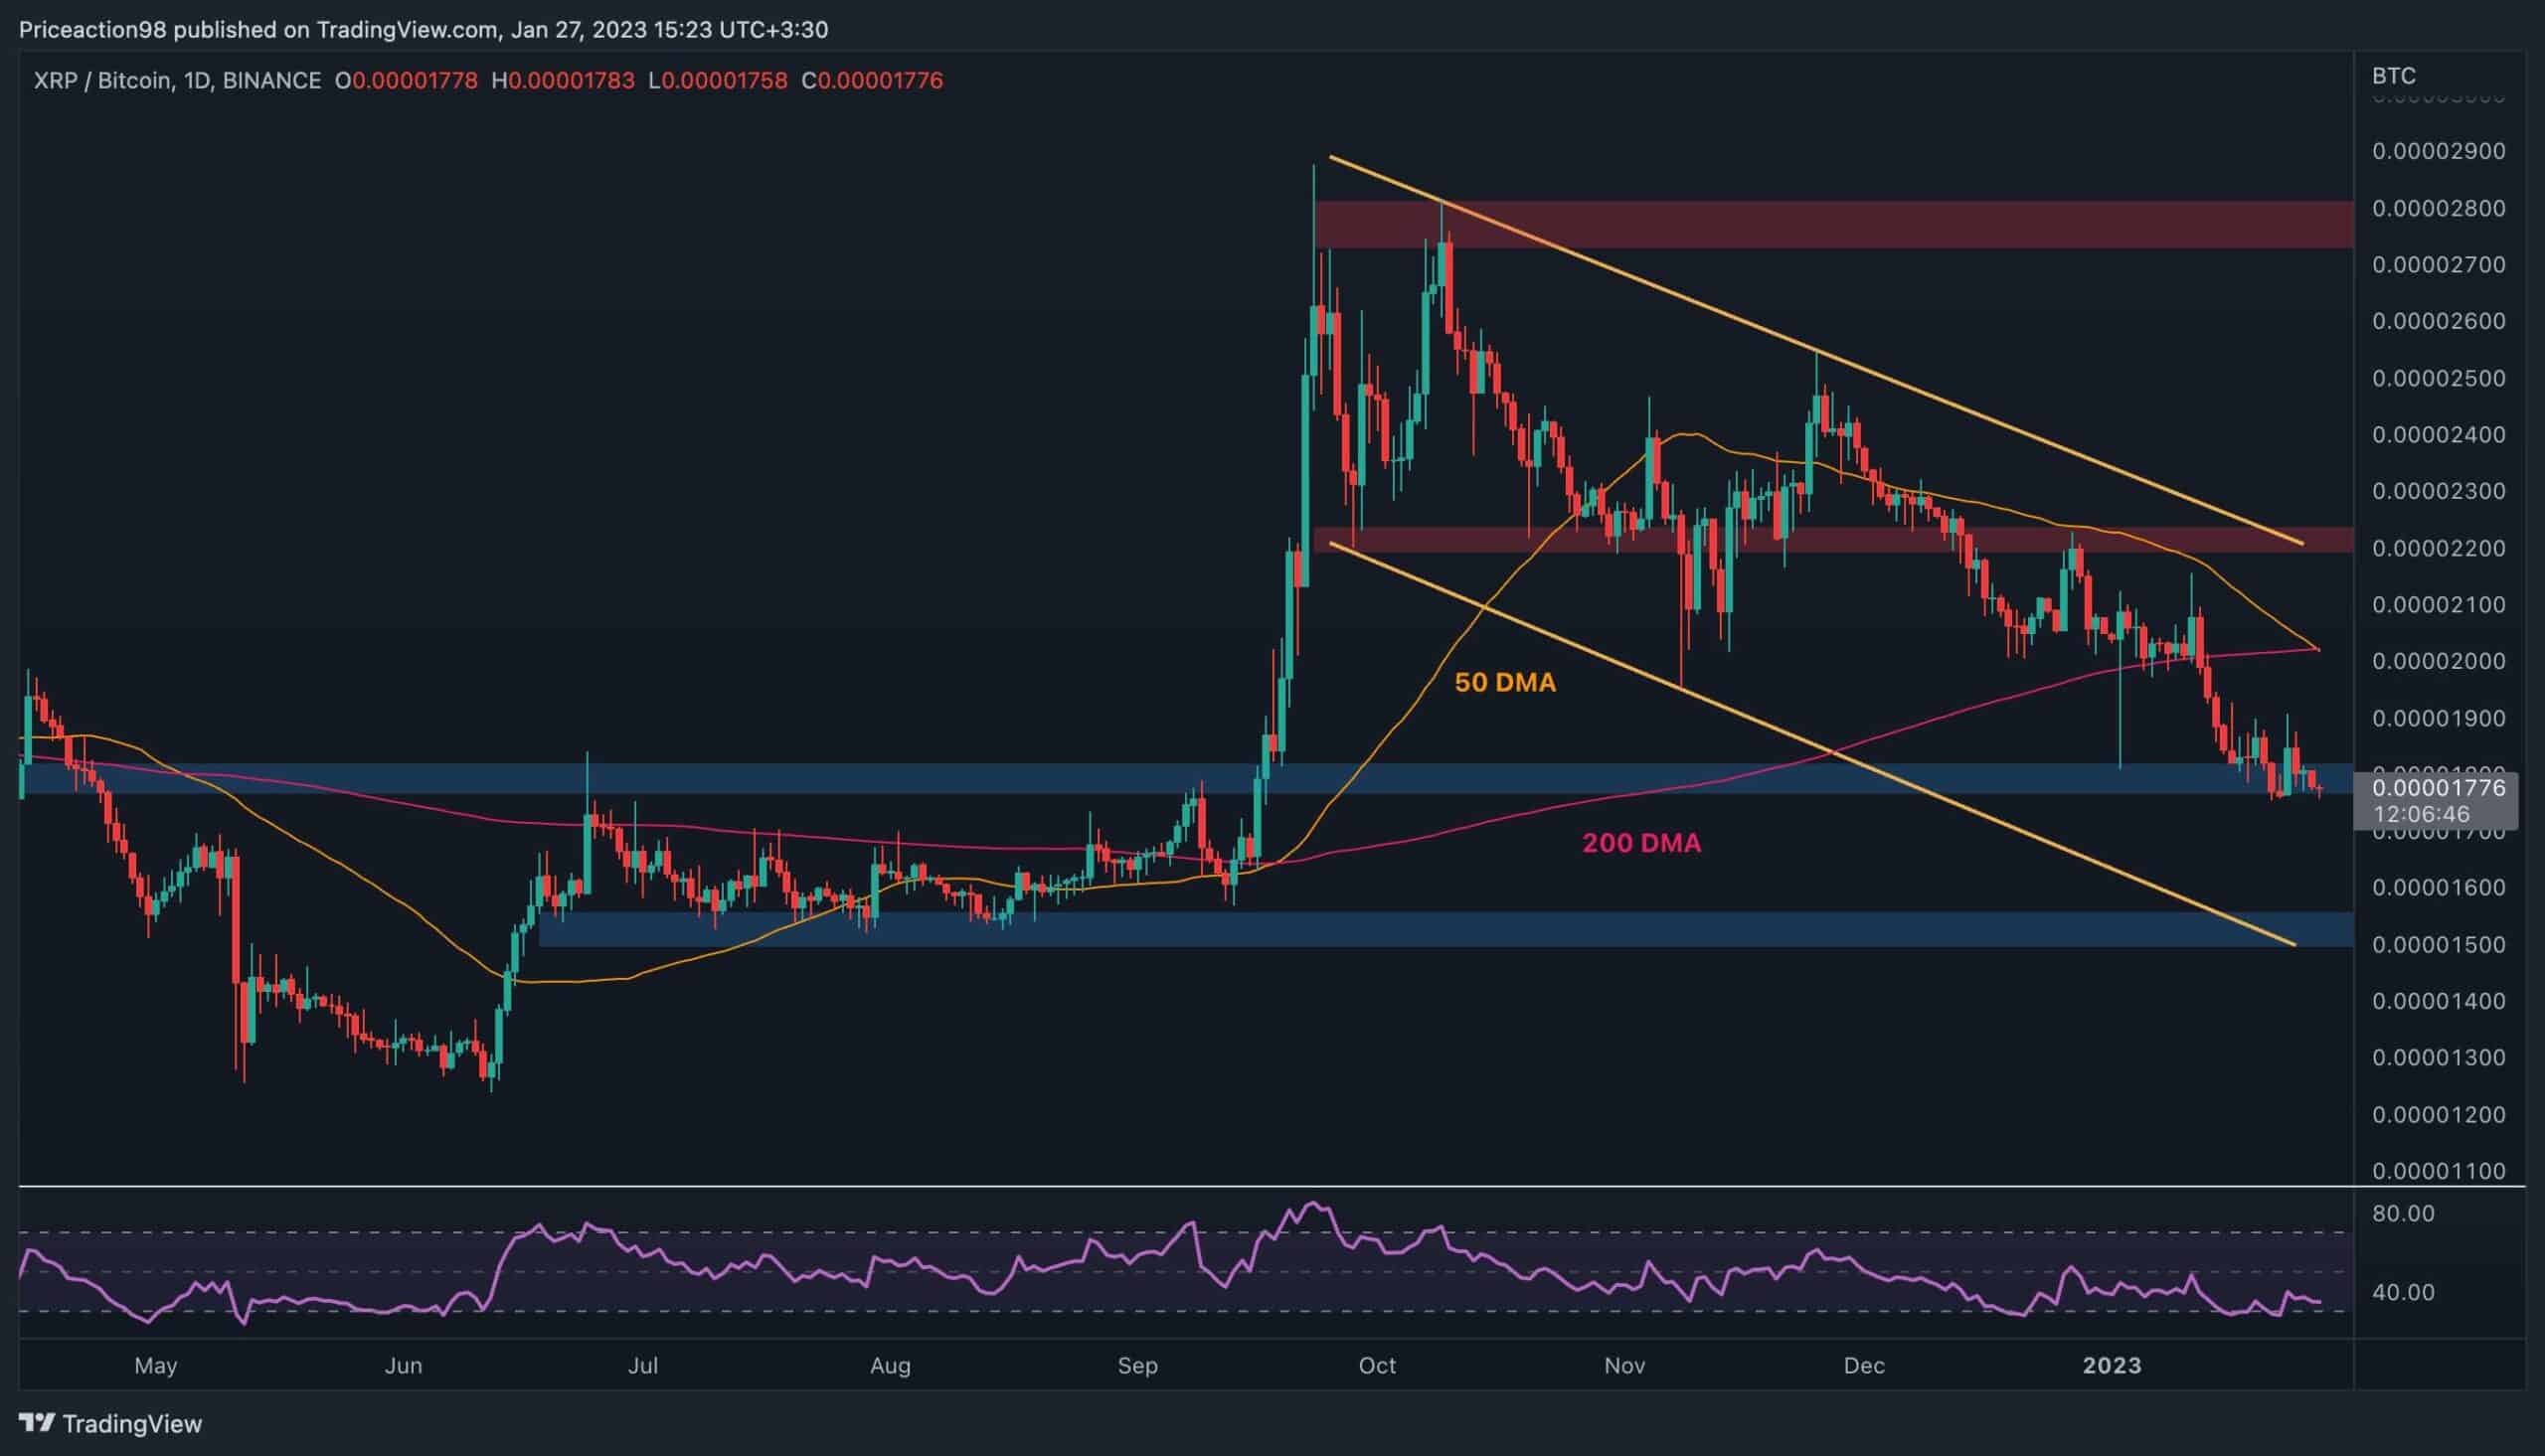
XRP/BTC Daily Chart
Against Bitcoin, the price is seemingly on the verge of breaking the 0.000018 level to the downside after days of consolidation above it. This would lead to a drop towards the lower boundary of the descending channel and the 0.000015 area.
Furthermore, the 50-day MA is also crossing the 200-day MA to the downside, around the 0.00002 mark. This is considered a bearish signal and would further increase the probability of a drop toward the 0.000015 level in the short term.