After forming a bearish three-drives reversal pattern, the price has recently dropped below the neckline, delivering a significantly bearish signal for the short-term outlook. As of now, BTC faces an important support region at K. Technical Analysis By Shayan The Daily Chart As expected, the three-drives pattern resulted in a trend reversal and a decline in the price. Bitcoin was recently rejected below the neckline and is consolidating with very little momentum. However, a pullback to this broken neckline is necessary to confirm the change in Bitcoin’s recent bullish trend. If a pullback occurs, the price will potentially enter a mid-term downward stage, returning the fear to the market. BTC’s following support levels are K and the 200-day moving average, standing
Topics:
CryptoVizArt considers the following as important: Bitcoin (BTC) Price, BTC Analysis, BTCEUR, BTCGBP, btcusd, btcusdt
This could be interesting, too:
Chayanika Deka writes XRP, SOL, and ADA Inclusion in US Crypto Reserve Pushes Traders on Edge
Chayanika Deka writes Why Arthur Hayes Is Bullish on Bitcoin Under Trump’s Economic Strategy
Mandy Williams writes Why the Bitcoin Market Is Stuck—and the Key Metric That Could Change It: CryptoQuant CEO
Wayne Jones writes Metaplanet Acquires 156 BTC, Bringing Total Holdings to 2,391
After forming a bearish three-drives reversal pattern, the price has recently dropped below the neckline, delivering a significantly bearish signal for the short-term outlook. As of now, BTC faces an important support region at $21K.
Technical Analysis
By Shayan
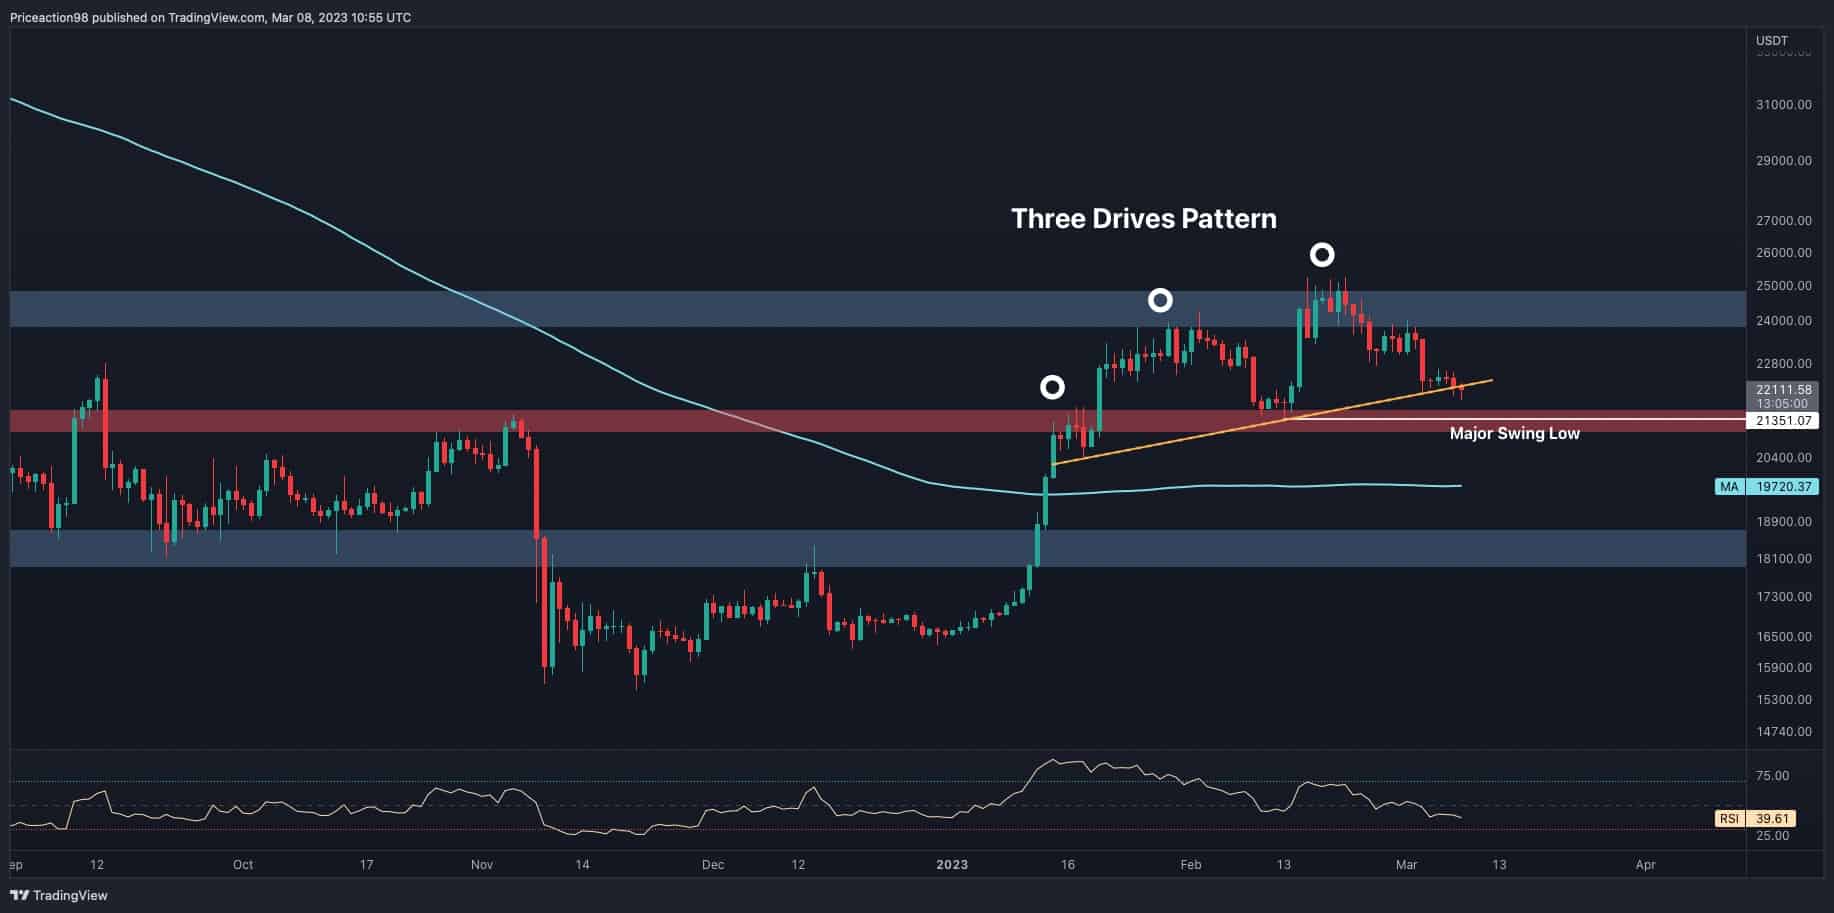
The Daily Chart
As expected, the three-drives pattern resulted in a trend reversal and a decline in the price. Bitcoin was recently rejected below the neckline and is consolidating with very little momentum.
However, a pullback to this broken neckline is necessary to confirm the change in Bitcoin’s recent bullish trend. If a pullback occurs, the price will potentially enter a mid-term downward stage, returning the fear to the market.
BTC’s following support levels are $21K and the 200-day moving average, standing at $19.7K.
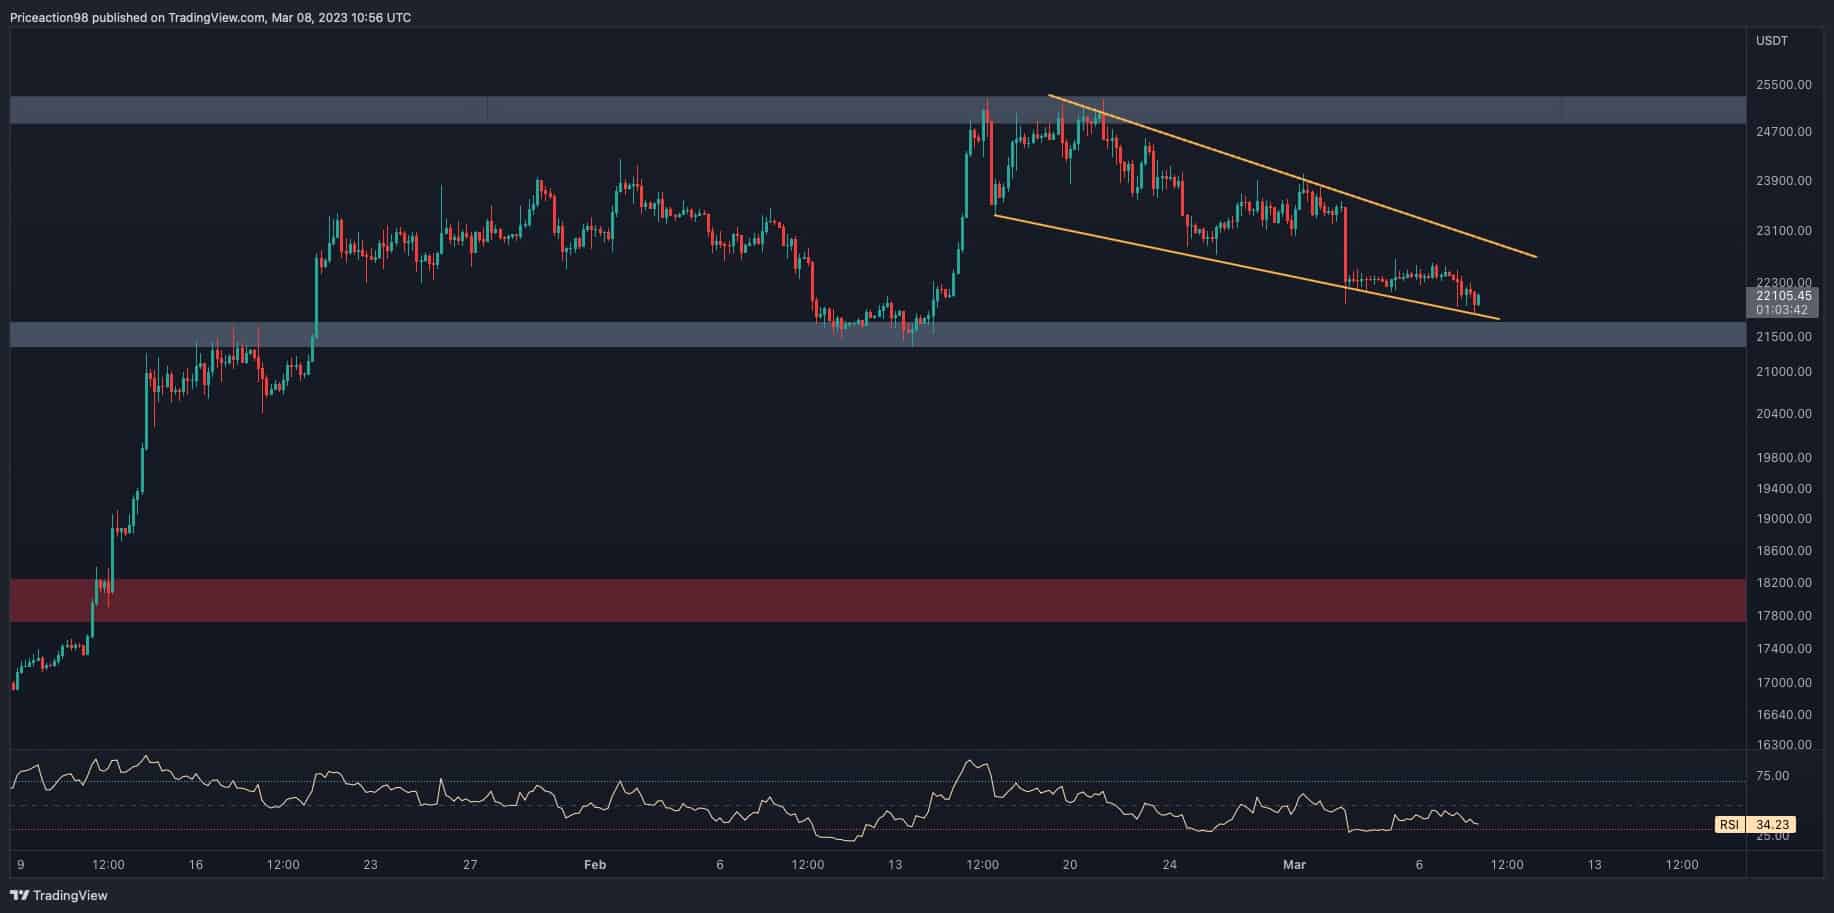
The 4-Hour Chart
After forming a major swing at $25K, Bitcoin’s price initiated a downtrend, forming an ascending wedge pattern. Following an impulsive bearish move, the price reached the wedge’s lower boundary at $22K and began consolidating.
Bitcoin currently faces a significant support area consisting of the wedge’s lower boundary and the $21K major support level. Presently, the bearish momentum has decreased.
As a result, the price will possibly enter a short-term range stage, demonstrating the battle between buyers and sellers at this vital price area.
To conclude, a breakout from the wedge in either direction will determine the mid-term direction of the price.
On-chain Analysis
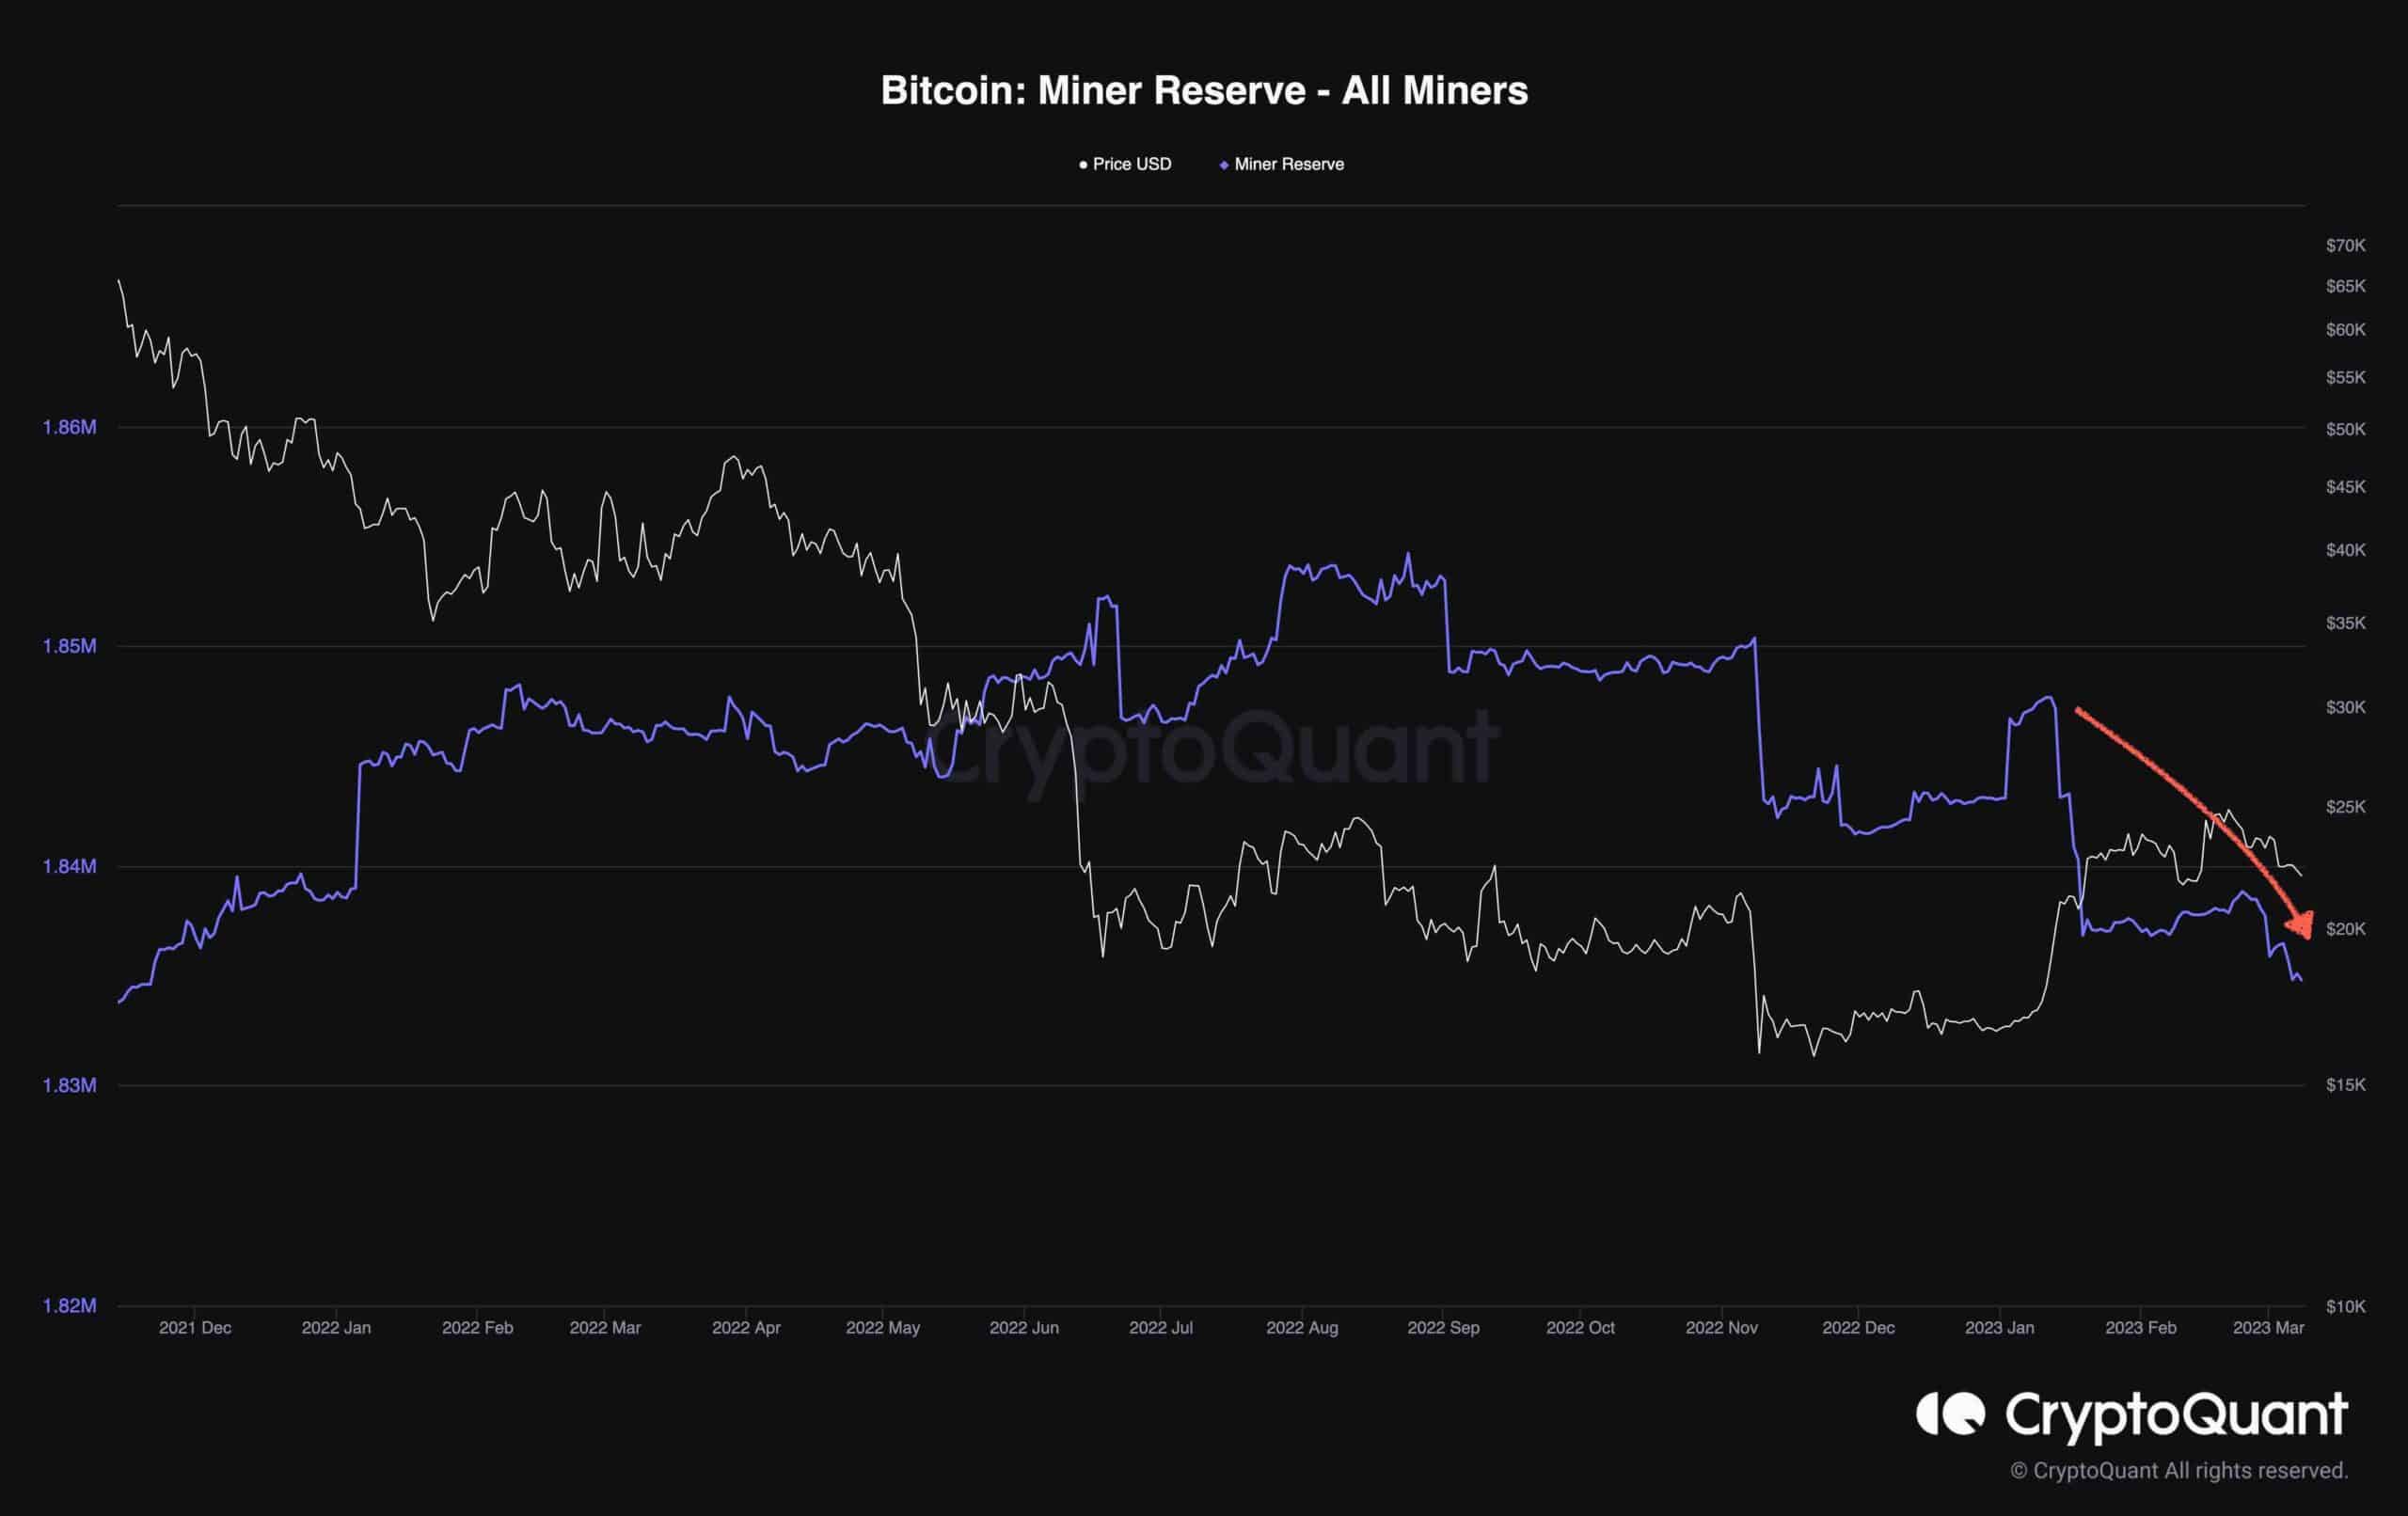
Miners are a vital cohort among market participants, and their selling behavior deeply affects the market as they have a large number of coins. They also impact the market in terms of traders’ sentiment.
This chart demonstrates the miner reserve metric, measuring the number of coins held by the miners’ wallets. Despite many on-chain metrics indicating bullish signs during the recent stage of the market, the miner reserve metric has entered a bearish trend and reached new yearly lows.
This shows that the recent bullish spike in BItcoin’s price has provided a great chance for the miners to offload their assets, controlling their expenses. This selling behavior could end up as a mid-term bearish sentiment in the market.