Bitcoin’s price has recently found a stable range around the critical resistance level of K, indicating a bullish sentiment among market participants. However, there is a possibility of a short-term decline, potentially pulling back towards the K support level. Technical Analysis By Shayan The Daily Chart A close look at the daily chart shows that Bitcoin’s upward trajectory has faded upon reaching the critical K resistance zone. This level coincides with the upper boundary of an ascending channel, leading to a phase of price stabilization and sideways movement. Currently, Bitcoin is trading within a crucial range, bordered by the K resistance and the strong support at K. The market is likely to maintain this consolidation pattern for the short term.
Topics:
CryptoVizArt considers the following as important: Bitcoin (BTC) Price, BTC Analysis, BTCEUR, BTCGBP, btcusd, btcusdt
This could be interesting, too:
Chayanika Deka writes XRP, SOL, and ADA Inclusion in US Crypto Reserve Pushes Traders on Edge
Chayanika Deka writes Why Arthur Hayes Is Bullish on Bitcoin Under Trump’s Economic Strategy
Mandy Williams writes Why the Bitcoin Market Is Stuck—and the Key Metric That Could Change It: CryptoQuant CEO
Wayne Jones writes Metaplanet Acquires 156 BTC, Bringing Total Holdings to 2,391
Bitcoin’s price has recently found a stable range around the critical resistance level of $45K, indicating a bullish sentiment among market participants.
However, there is a possibility of a short-term decline, potentially pulling back towards the $40K support level.
Technical Analysis
By Shayan
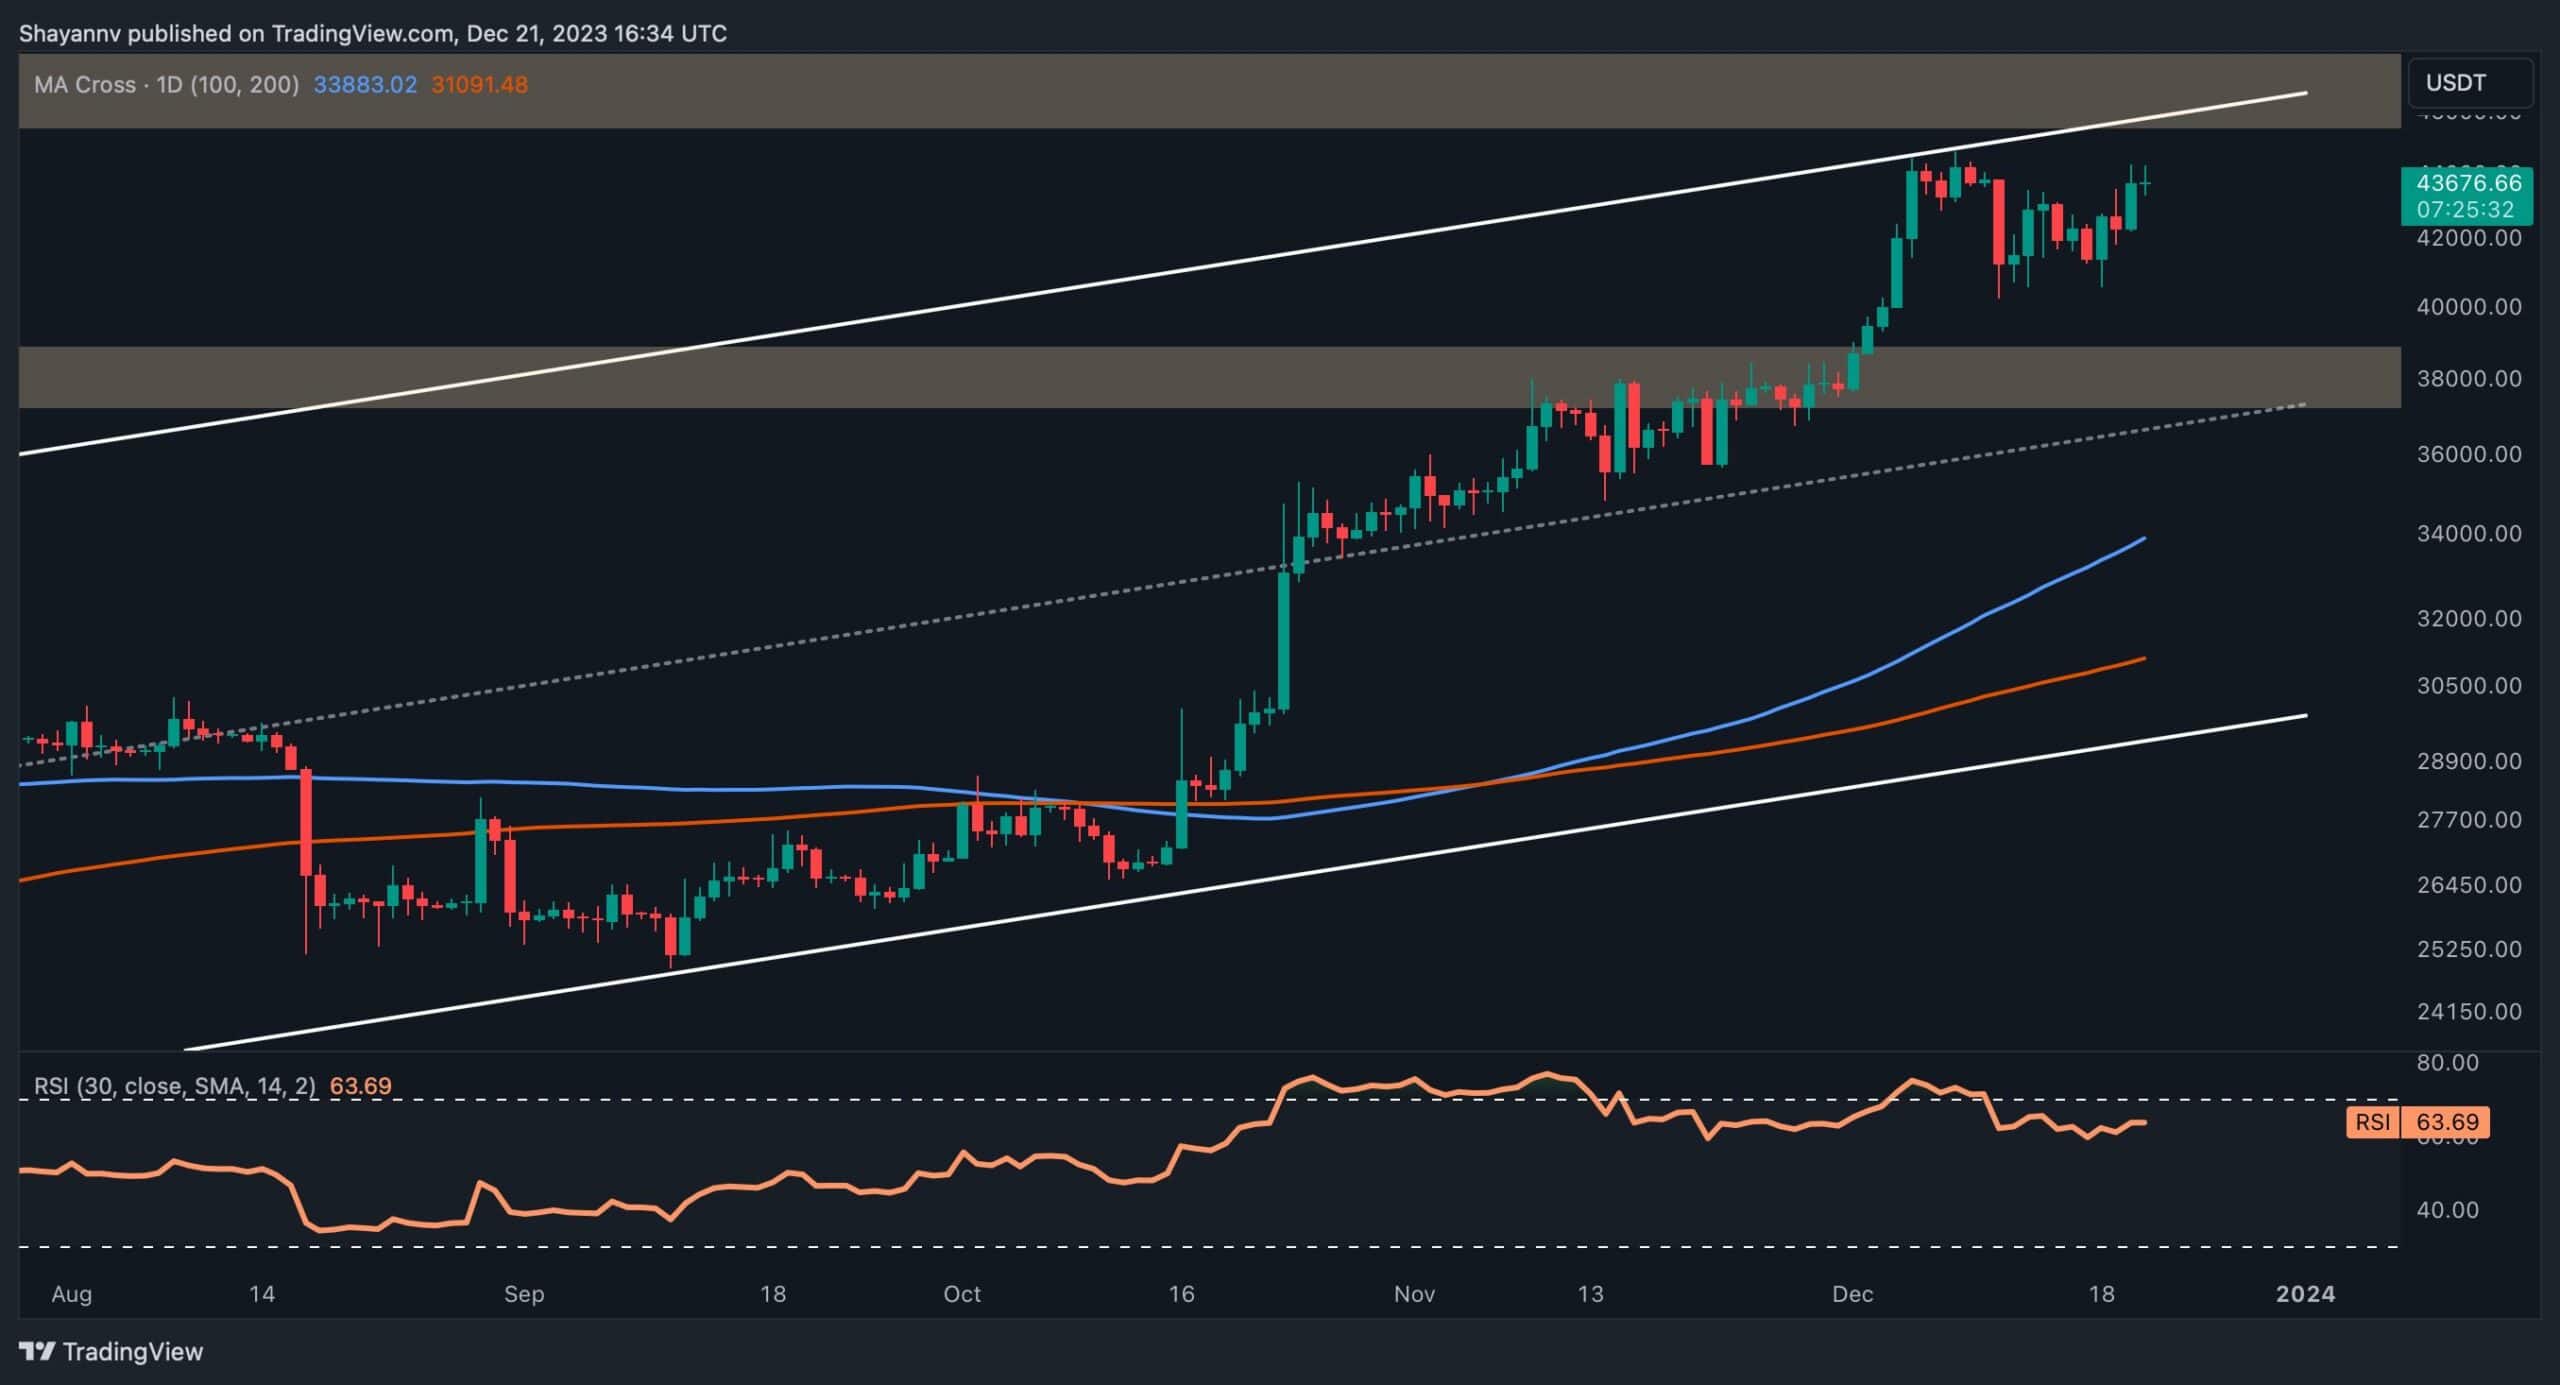
The Daily Chart
A close look at the daily chart shows that Bitcoin’s upward trajectory has faded upon reaching the critical $45K resistance zone. This level coincides with the upper boundary of an ascending channel, leading to a phase of price stabilization and sideways movement. Currently, Bitcoin is trading within a crucial range, bordered by the $45K resistance and the strong support at $40K.
The market is likely to maintain this consolidation pattern for the short term. However, due to the noticeable bearish divergence between the price and the Relative Strength Index (RSI), a retracement towards the lower end of this range is expected, pending a definitive breakout in either direction.
The 4-Hour Chart
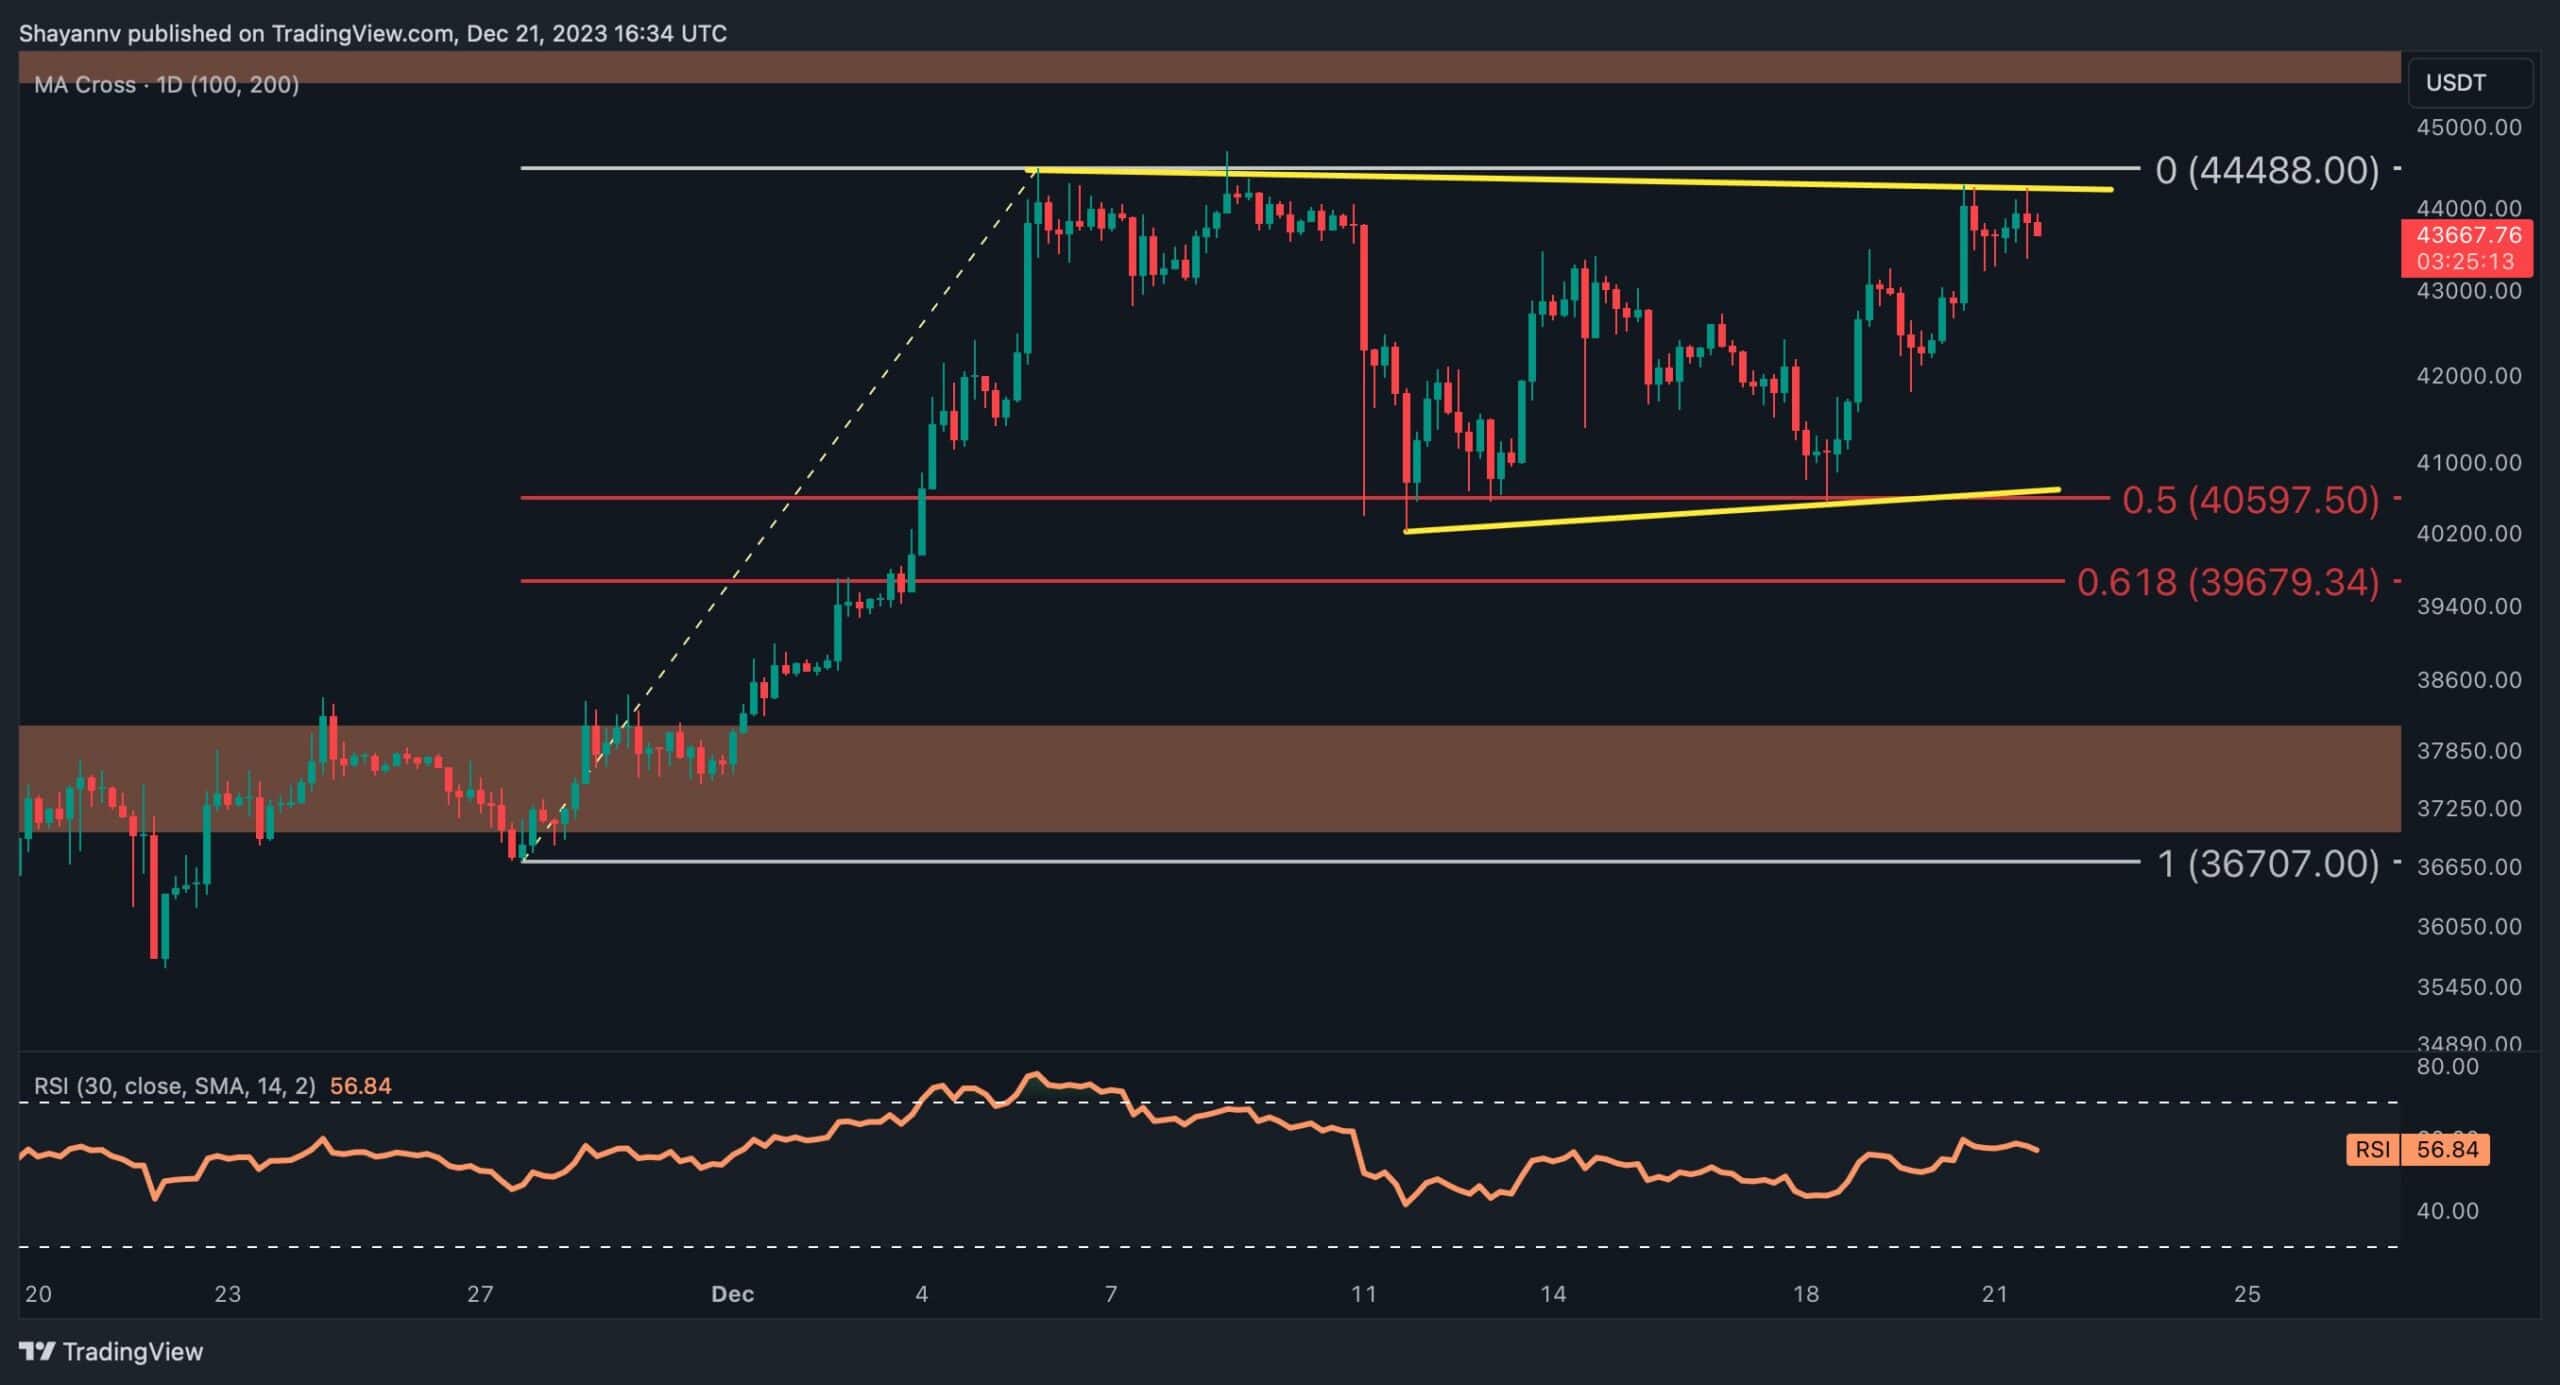
Delving into the 4-hour chart, it is observed that after a sharp rise to the $45K mark, Bitcoin has entered a phase of sideways movement, reflecting an equilibrium between buyers and sellers. During this consolidation phase, the price has been tracing a sideways wedge pattern, oscillating within its upper and lower thresholds. Notably, the lower trendline of this wedge aligns with a key support level, marked by the 0.5 Fibonacci retracement level, providing significant support to the price.
In the event that the price surpasses the upper boundary of the wedge, a renewed push toward the $45K resistance seems likely. Conversely, if the price falls below the wedge’s lower limit and the support zone between the 0.5 and 0.618 Fibonacci retracement levels, the market might experience a downturn toward lower price points.
On-chain Analysis
By Shayan
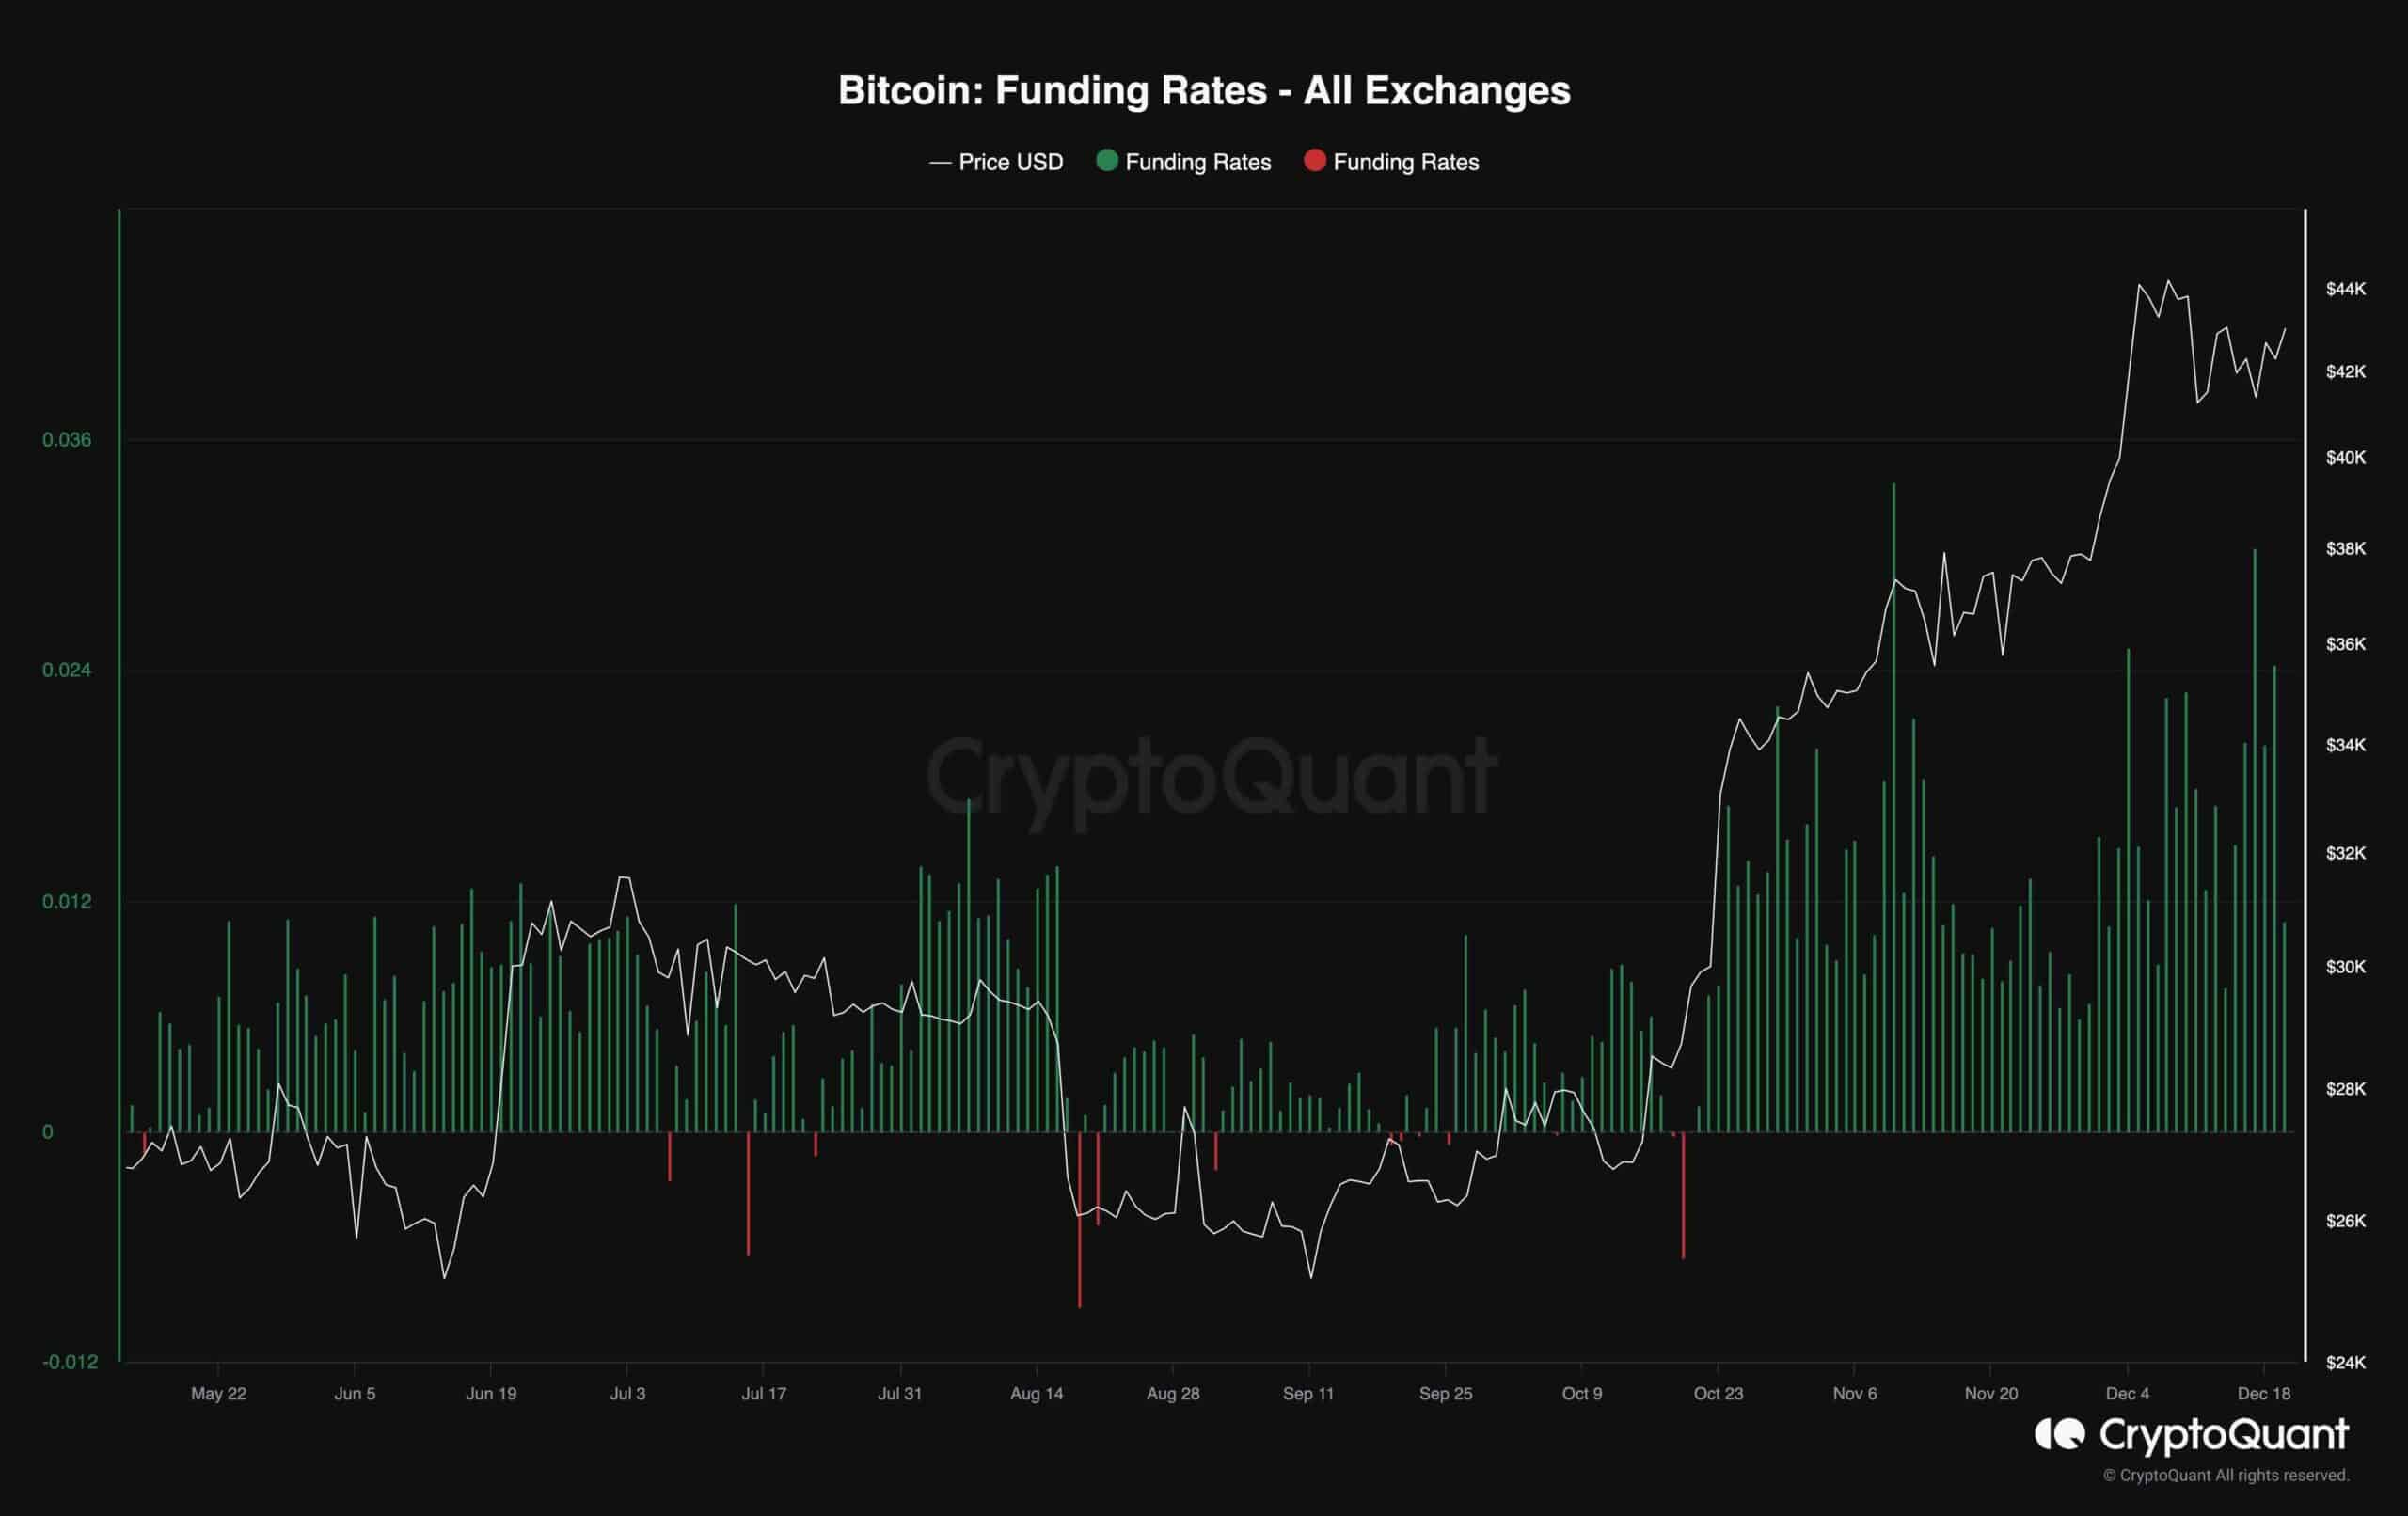
Recently, Bitcoin has been experiencing a period of stability, hovering around the $45K mark. However, this steady price range doesn’t provide much insight into market trends. A more telling analysis can be derived from the sentiment in the futures market.
The key to understanding this sentiment lies in examining the funding rates. These are recurrent payments exchanged between traders holding long or short positions, determined by the difference between perpetual contract and spot market prices. Funding rates are a barometer of market sentiment in the perpetual futures market. When these rates are favourable, it signals a predominance of traders with long positions who are prepared to compensate short-position traders.
Lately, these funding rates have been consistently positive, suggesting a bullish outlook in the futures market. While this optimism isn’t inherently alarming, it’s crucial to be cautious. If this trend persists, the market could see a significant shift in the short term. Specifically, there’s a potential risk of a ‘long liquidation cascade’, where a rapid sell-off could occur, dramatically affecting the market. This possibility underscores the need for vigilance in monitoring these market indicators.