Bitcoin’s price has been consolidating recently, following months of bullish movement. The market is testing a key support level at the moment as things are getting tricky for a potential continuation to the upside. Technical Analysis By TradingRage The Daily Chart On the daily timeframe, the price has been aggressively rallying since a break above the 200-day moving average back in October. Multiple resistance levels have been broken through, and the market participants are quite optimistic. However, the bullish momentum has faded recently, as the price failed to get past the K mark and dropped back towards the K support level. This level is currently holding the market, preventing a deeper decline. In this case, a continuation toward the K level would be likely.
Topics:
CryptoVizArt considers the following as important: Bitcoin (BTC) Price, BTC Analysis, BTCEUR, BTCGBP, btcusd, btcusdt
This could be interesting, too:
Chayanika Deka writes XRP, SOL, and ADA Inclusion in US Crypto Reserve Pushes Traders on Edge
Chayanika Deka writes Why Arthur Hayes Is Bullish on Bitcoin Under Trump’s Economic Strategy
Mandy Williams writes Why the Bitcoin Market Is Stuck—and the Key Metric That Could Change It: CryptoQuant CEO
Wayne Jones writes Metaplanet Acquires 156 BTC, Bringing Total Holdings to 2,391
Bitcoin’s price has been consolidating recently, following months of bullish movement. The market is testing a key support level at the moment as things are getting tricky for a potential continuation to the upside.
Technical Analysis
By TradingRage
The Daily Chart
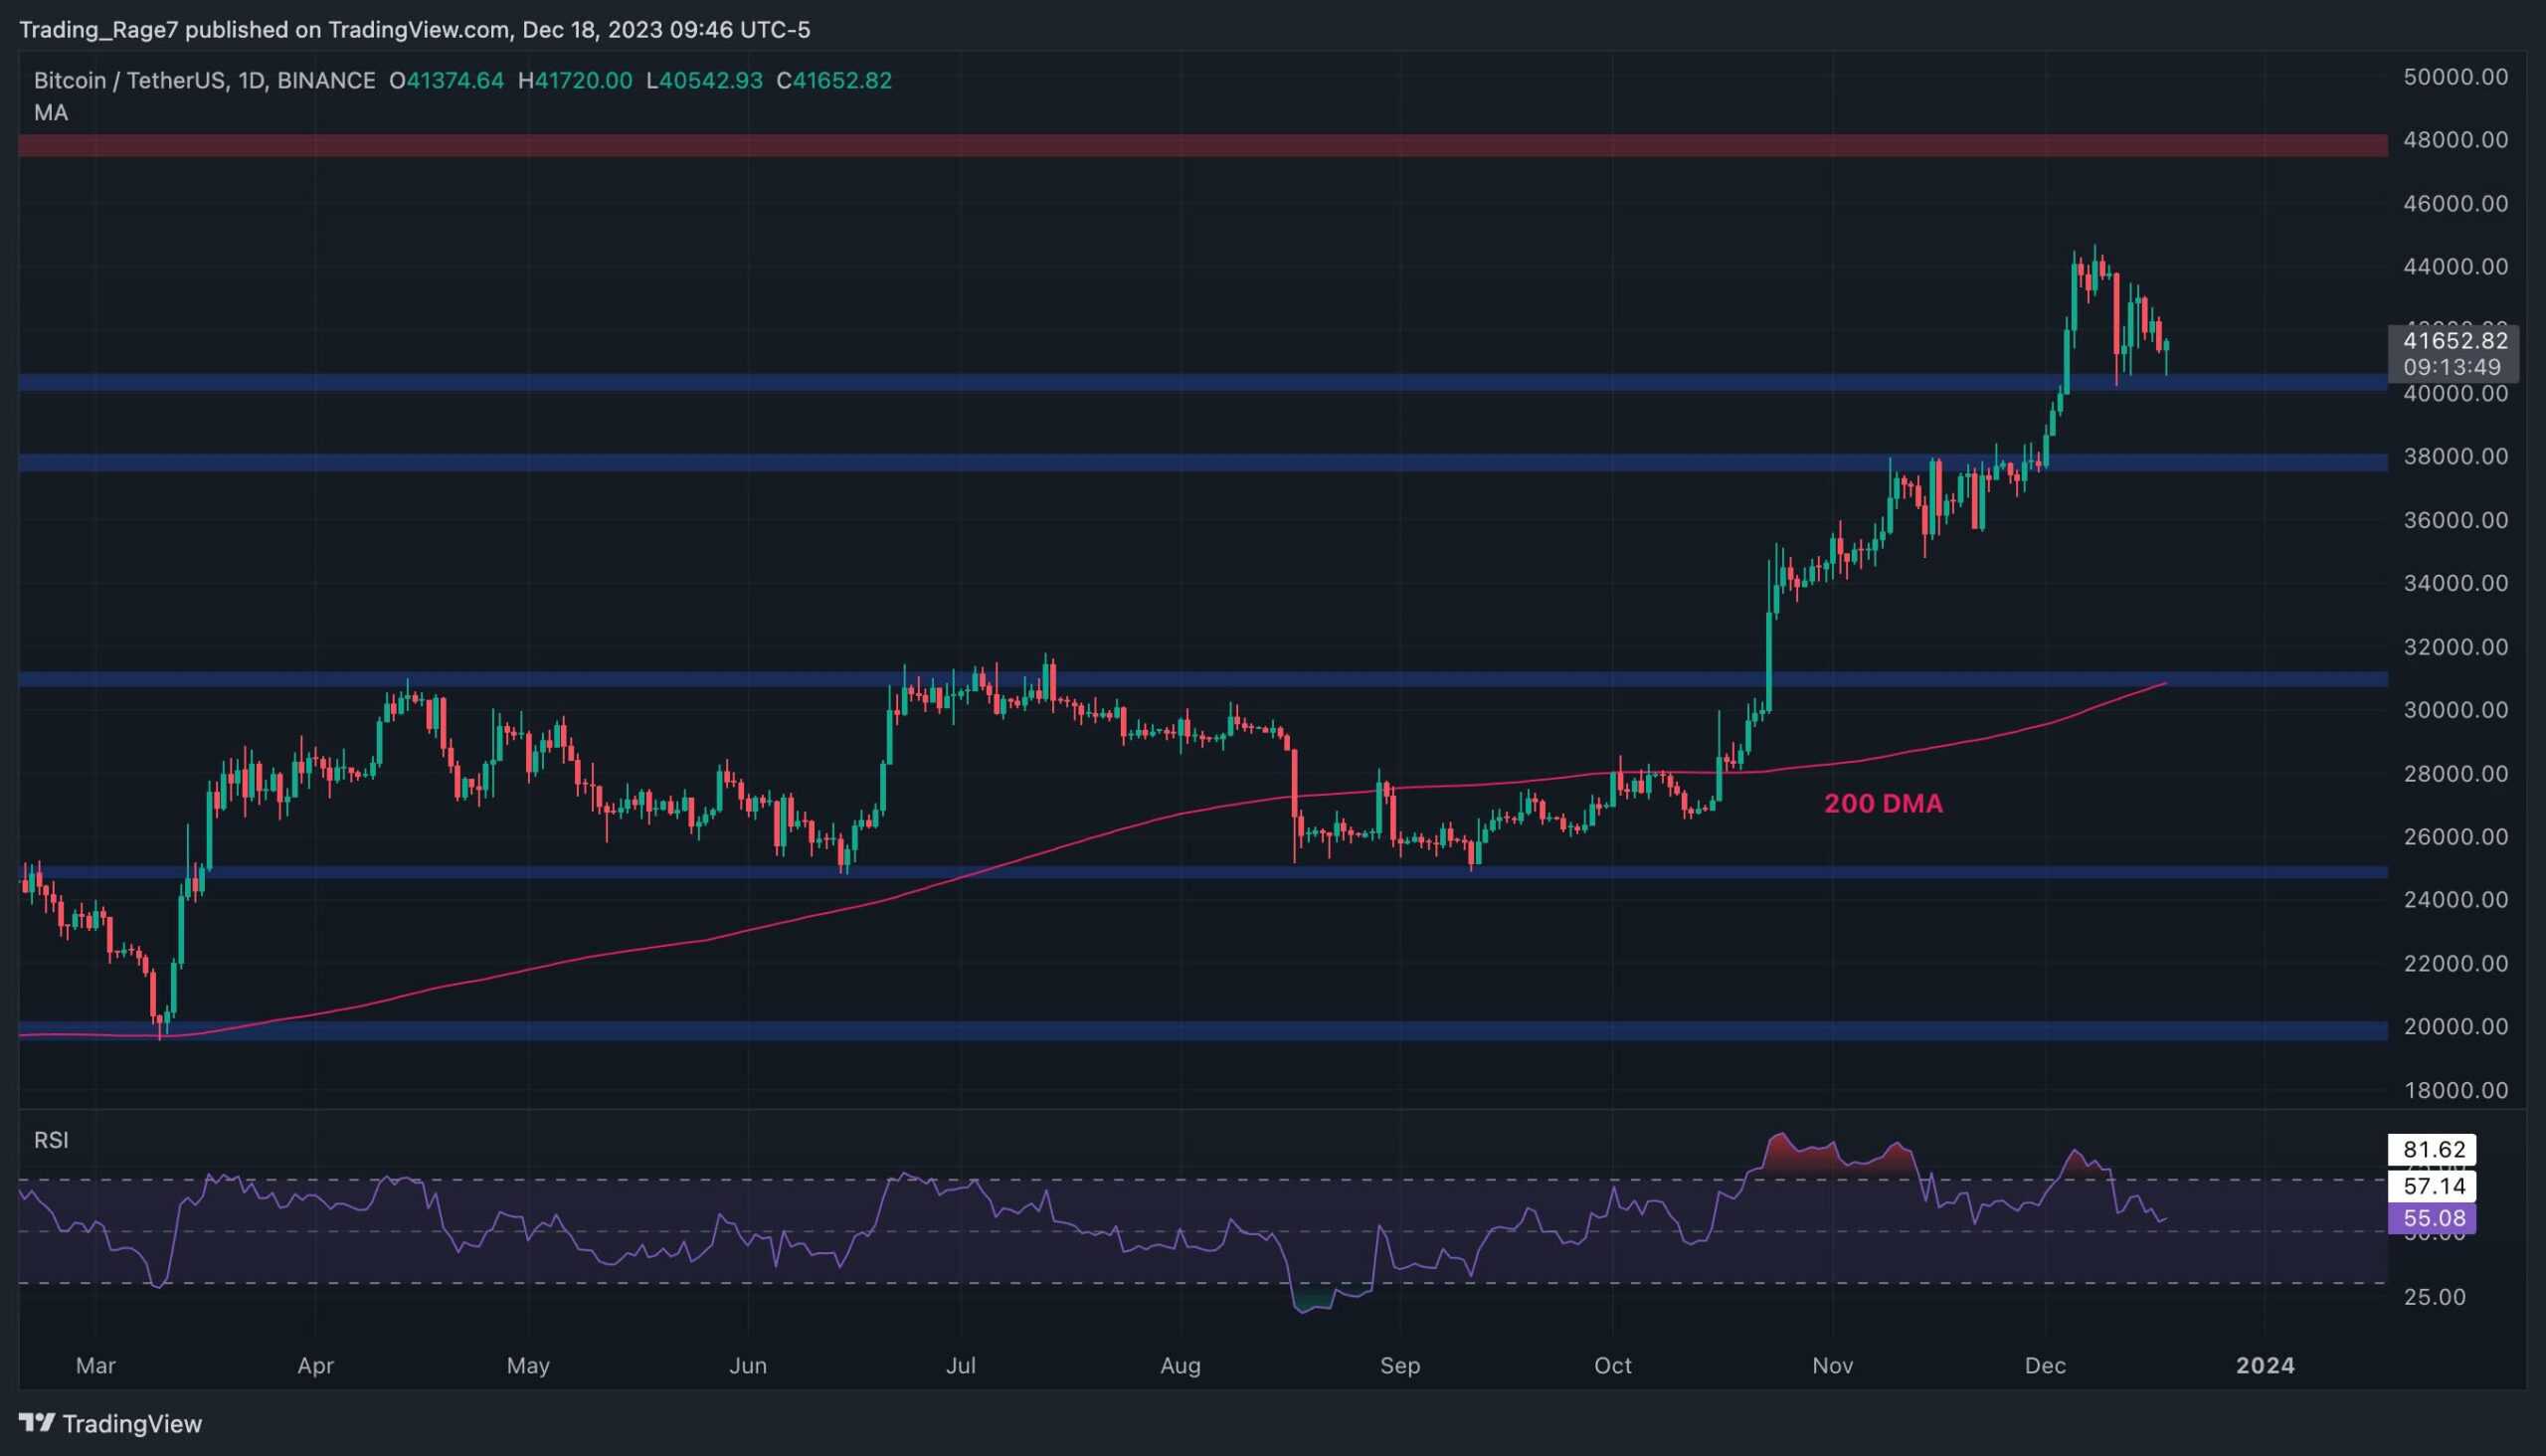
On the daily timeframe, the price has been aggressively rallying since a break above the 200-day moving average back in October. Multiple resistance levels have been broken through, and the market participants are quite optimistic.
However, the bullish momentum has faded recently, as the price failed to get past the $45K mark and dropped back towards the $40K support level.
This level is currently holding the market, preventing a deeper decline. In this case, a continuation toward the $48K level would be likely. With the Relative Strength Index showing values above 50%, the momentum is still in favor of the buyers, and the bullish scenario is still probable.
The 4-Hour Chart
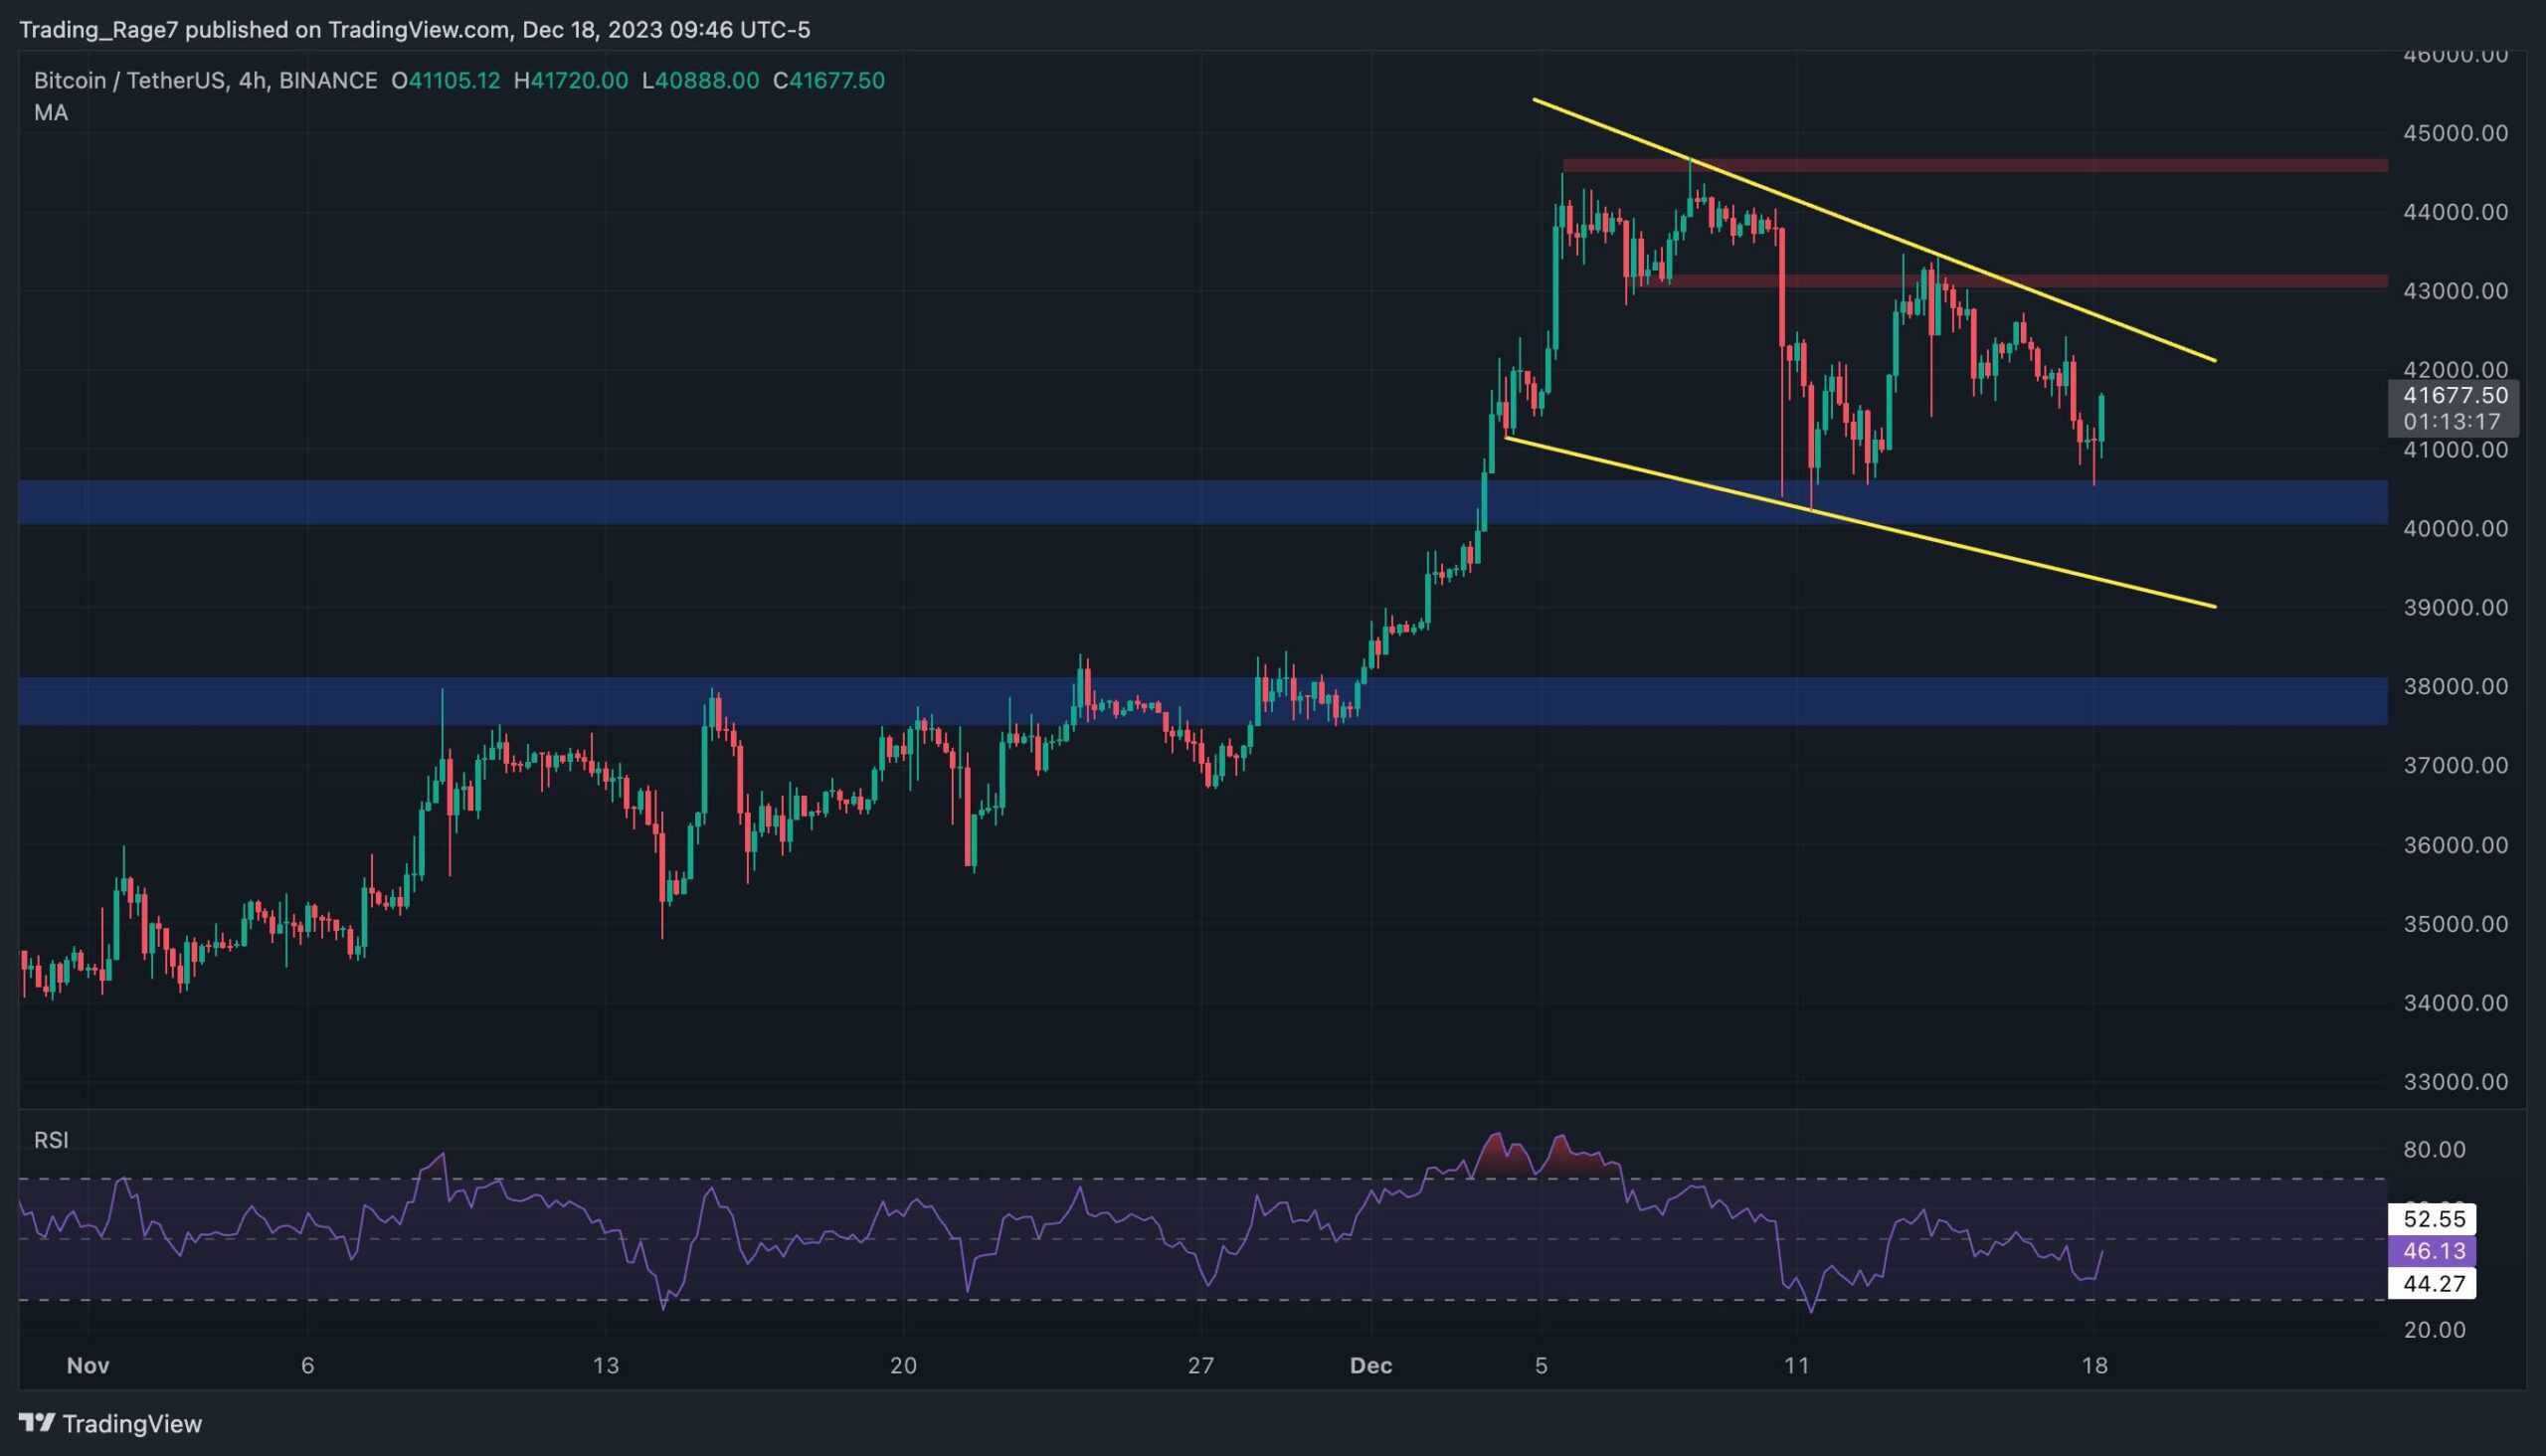
The 4-hour chart paints a more clear picture of the recent price action. The price has formed a falling wedge pattern and is yet to break it to either side.
Meanwhile, the $40K support level is pushing the price toward the higher trendline of the pattern. A break above the falling wedge would be considered a classic continuation signal, and the market could rise above the recent high at $45K and potentially reach the $48K resistance level in the coming weeks. On the contrary, a breakdown of the pattern would be disastrous, as it could lead to a plunge toward the $38K support zone.
On-Chain Analysis
By Shayan
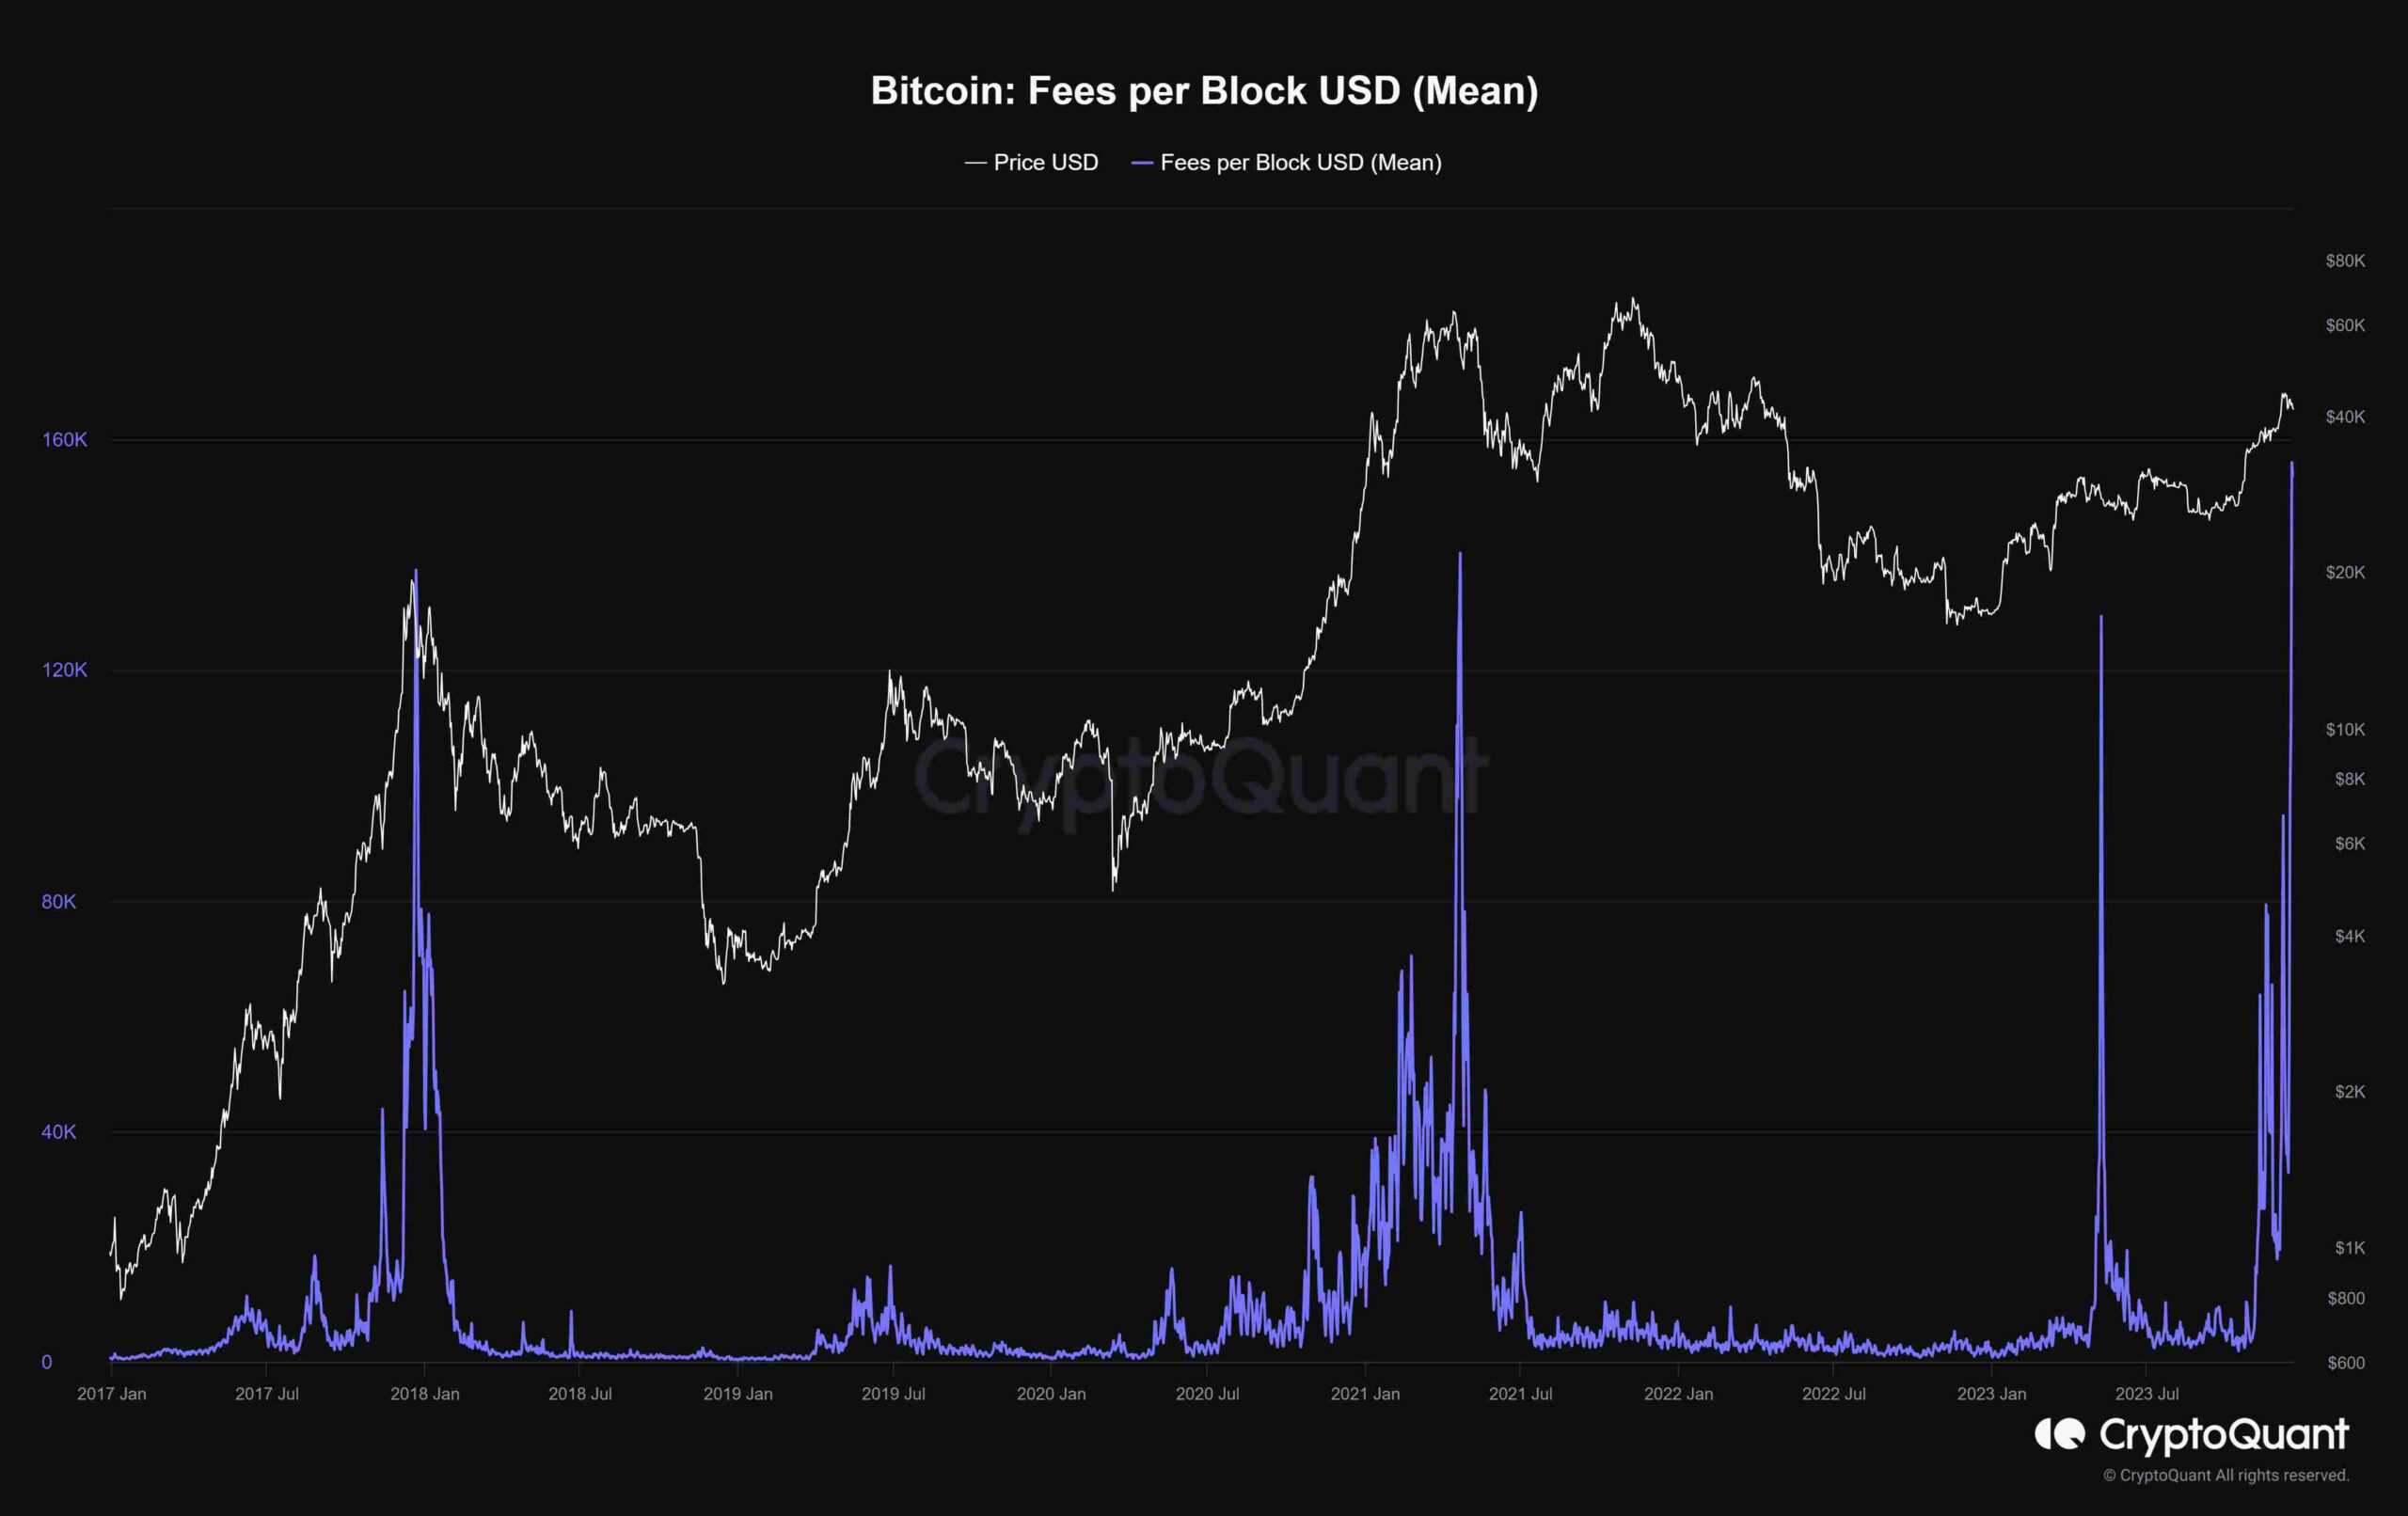
Bitcoin Fees per Block
The transaction fees associated with each Bitcoin block serve as a critical metric for gauging market dynamics, offering insights into network traffic and user demand. Elevated fees are often indicative of heightened network usage and can, at times, align with peaks in Bitcoin prices. This correlation implies that users are willing to pay higher fees to expedite transactions, pointing to a dynamic and active market.
Examining historical data reveals a pattern where peaks in both transaction fees and prices are succeeded by pullbacks. These retractions can be attributed to various factors such as network congestion, speculative trading activities, investor tendencies to sell, and the influx of Bitcoin miners into the market.
As the next Bitcoin halving approaches, with just 127 days remaining, speculation arises regarding potential retractions within this cycle due to speculative behavior and miner actions. This impending period presents a critical test for the overall health of the market and investor sentiment, providing insights into how these factors influence Bitcoin’s trajectory. With the market heading towards this significant event, meticulous observation and analysis of transaction fees, price movements, and related factors will be paramount for investors and analysts.