Bitcoin’s price has finally broken above a significant resistance level following yesterday’s CPI announcement. However, there is still one major obstacle that should be taken out for the price action to be considered bullish. Technical Analysis By: Edris The Daily Chart: On the daily timeframe, the price has finally broken above both the K resistance level and the higher boundary of the large falling wedge pattern. From a classical price action point of view, BTC could increase to the K level soon. However, the 200-day moving average (~K), a significant psychological barrier, remains intact. Breaking above this zone can lead to a rally toward K. Moreover, the RSI indicator currently shows significantly high values, indicating that the price is massively
Topics:
CryptoVizArt considers the following as important: BTC Analysis, BTCEUR, BTCGBP, btcusd, btcusdt, Ethereum (ETH) Price
This could be interesting, too:
Chayanika Deka writes Why Arthur Hayes Is Bullish on Bitcoin Under Trump’s Economic Strategy
Mandy Williams writes Why the Bitcoin Market Is Stuck—and the Key Metric That Could Change It: CryptoQuant CEO
Wayne Jones writes Metaplanet Acquires 156 BTC, Bringing Total Holdings to 2,391
Jordan Lyanchev writes Liquidations Top 0M as Bitcoin Falls K, Reversing Trump-Driven Rally
Bitcoin’s price has finally broken above a significant resistance level following yesterday’s CPI announcement. However, there is still one major obstacle that should be taken out for the price action to be considered bullish.
Technical Analysis
By: Edris
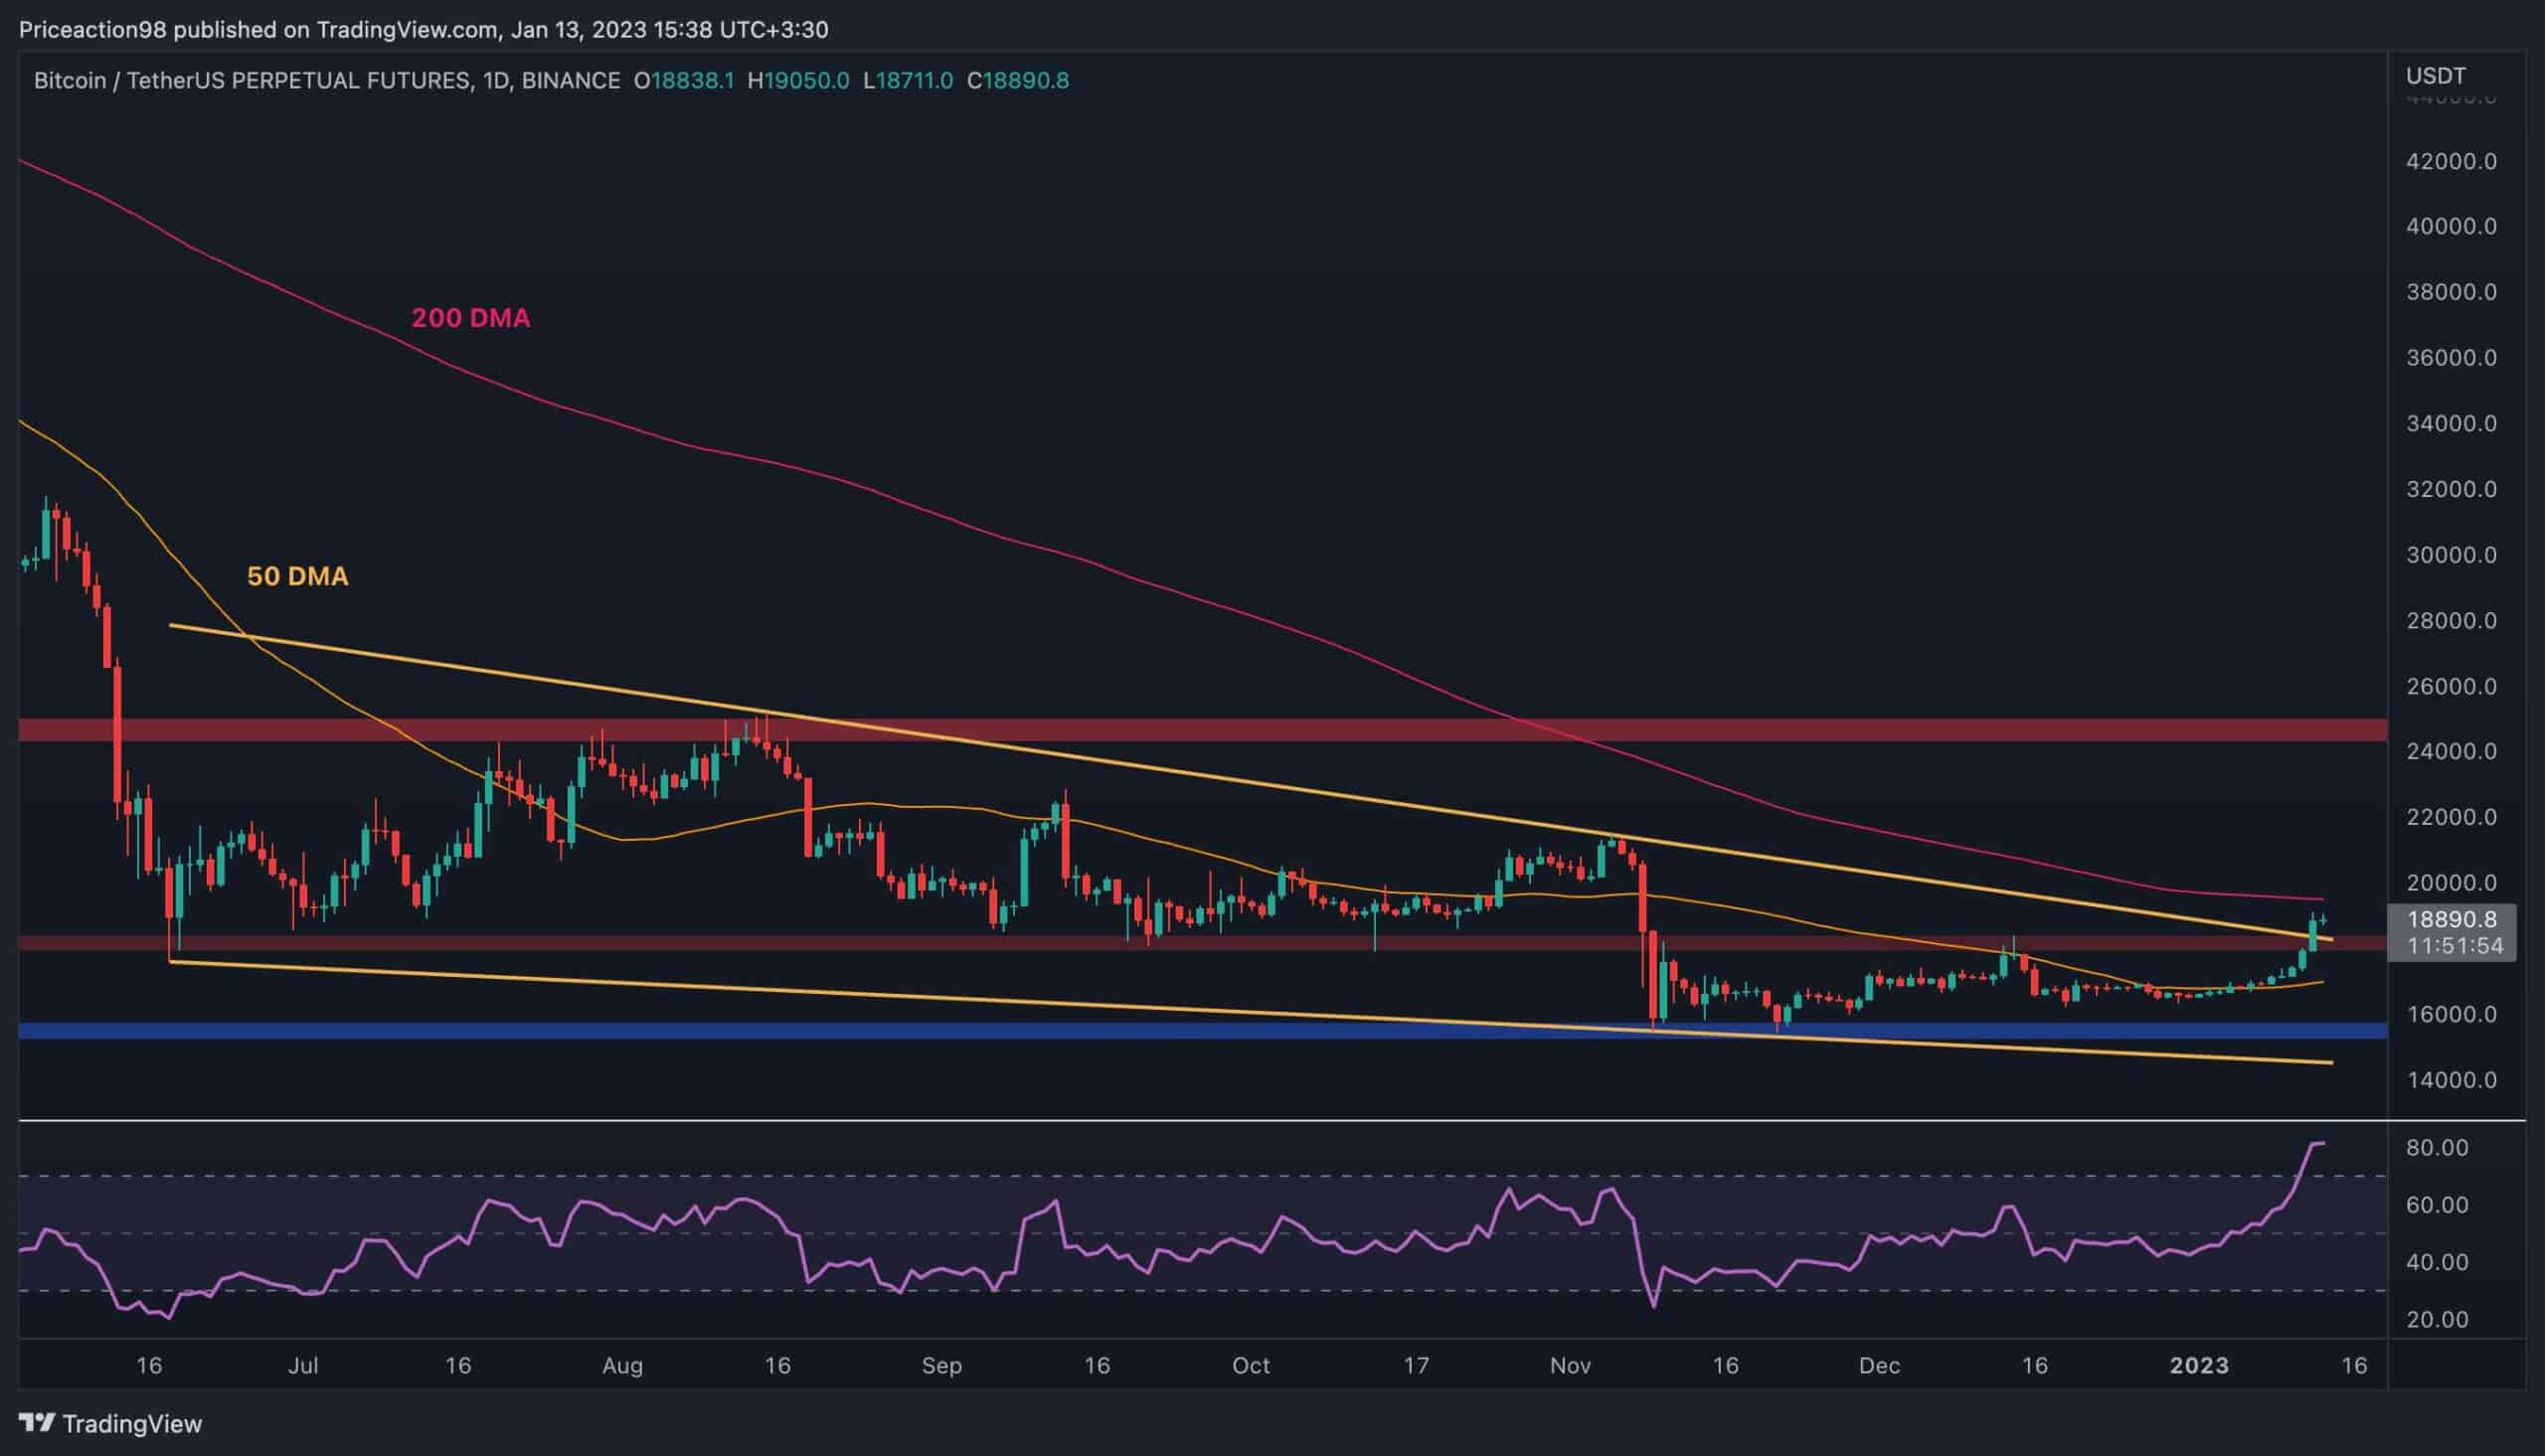
The Daily Chart:
On the daily timeframe, the price has finally broken above both the $18K resistance level and the higher boundary of the large falling wedge pattern. From a classical price action point of view, BTC could increase to the $25K level soon.
However, the 200-day moving average (~$20K), a significant psychological barrier, remains intact. Breaking above this zone can lead to a rally toward $25K.
Moreover, the RSI indicator currently shows significantly high values, indicating that the price is massively overbought. A short-term pullback or a reversal from the 200-day moving average is probable.
The 4-Hour Chart:
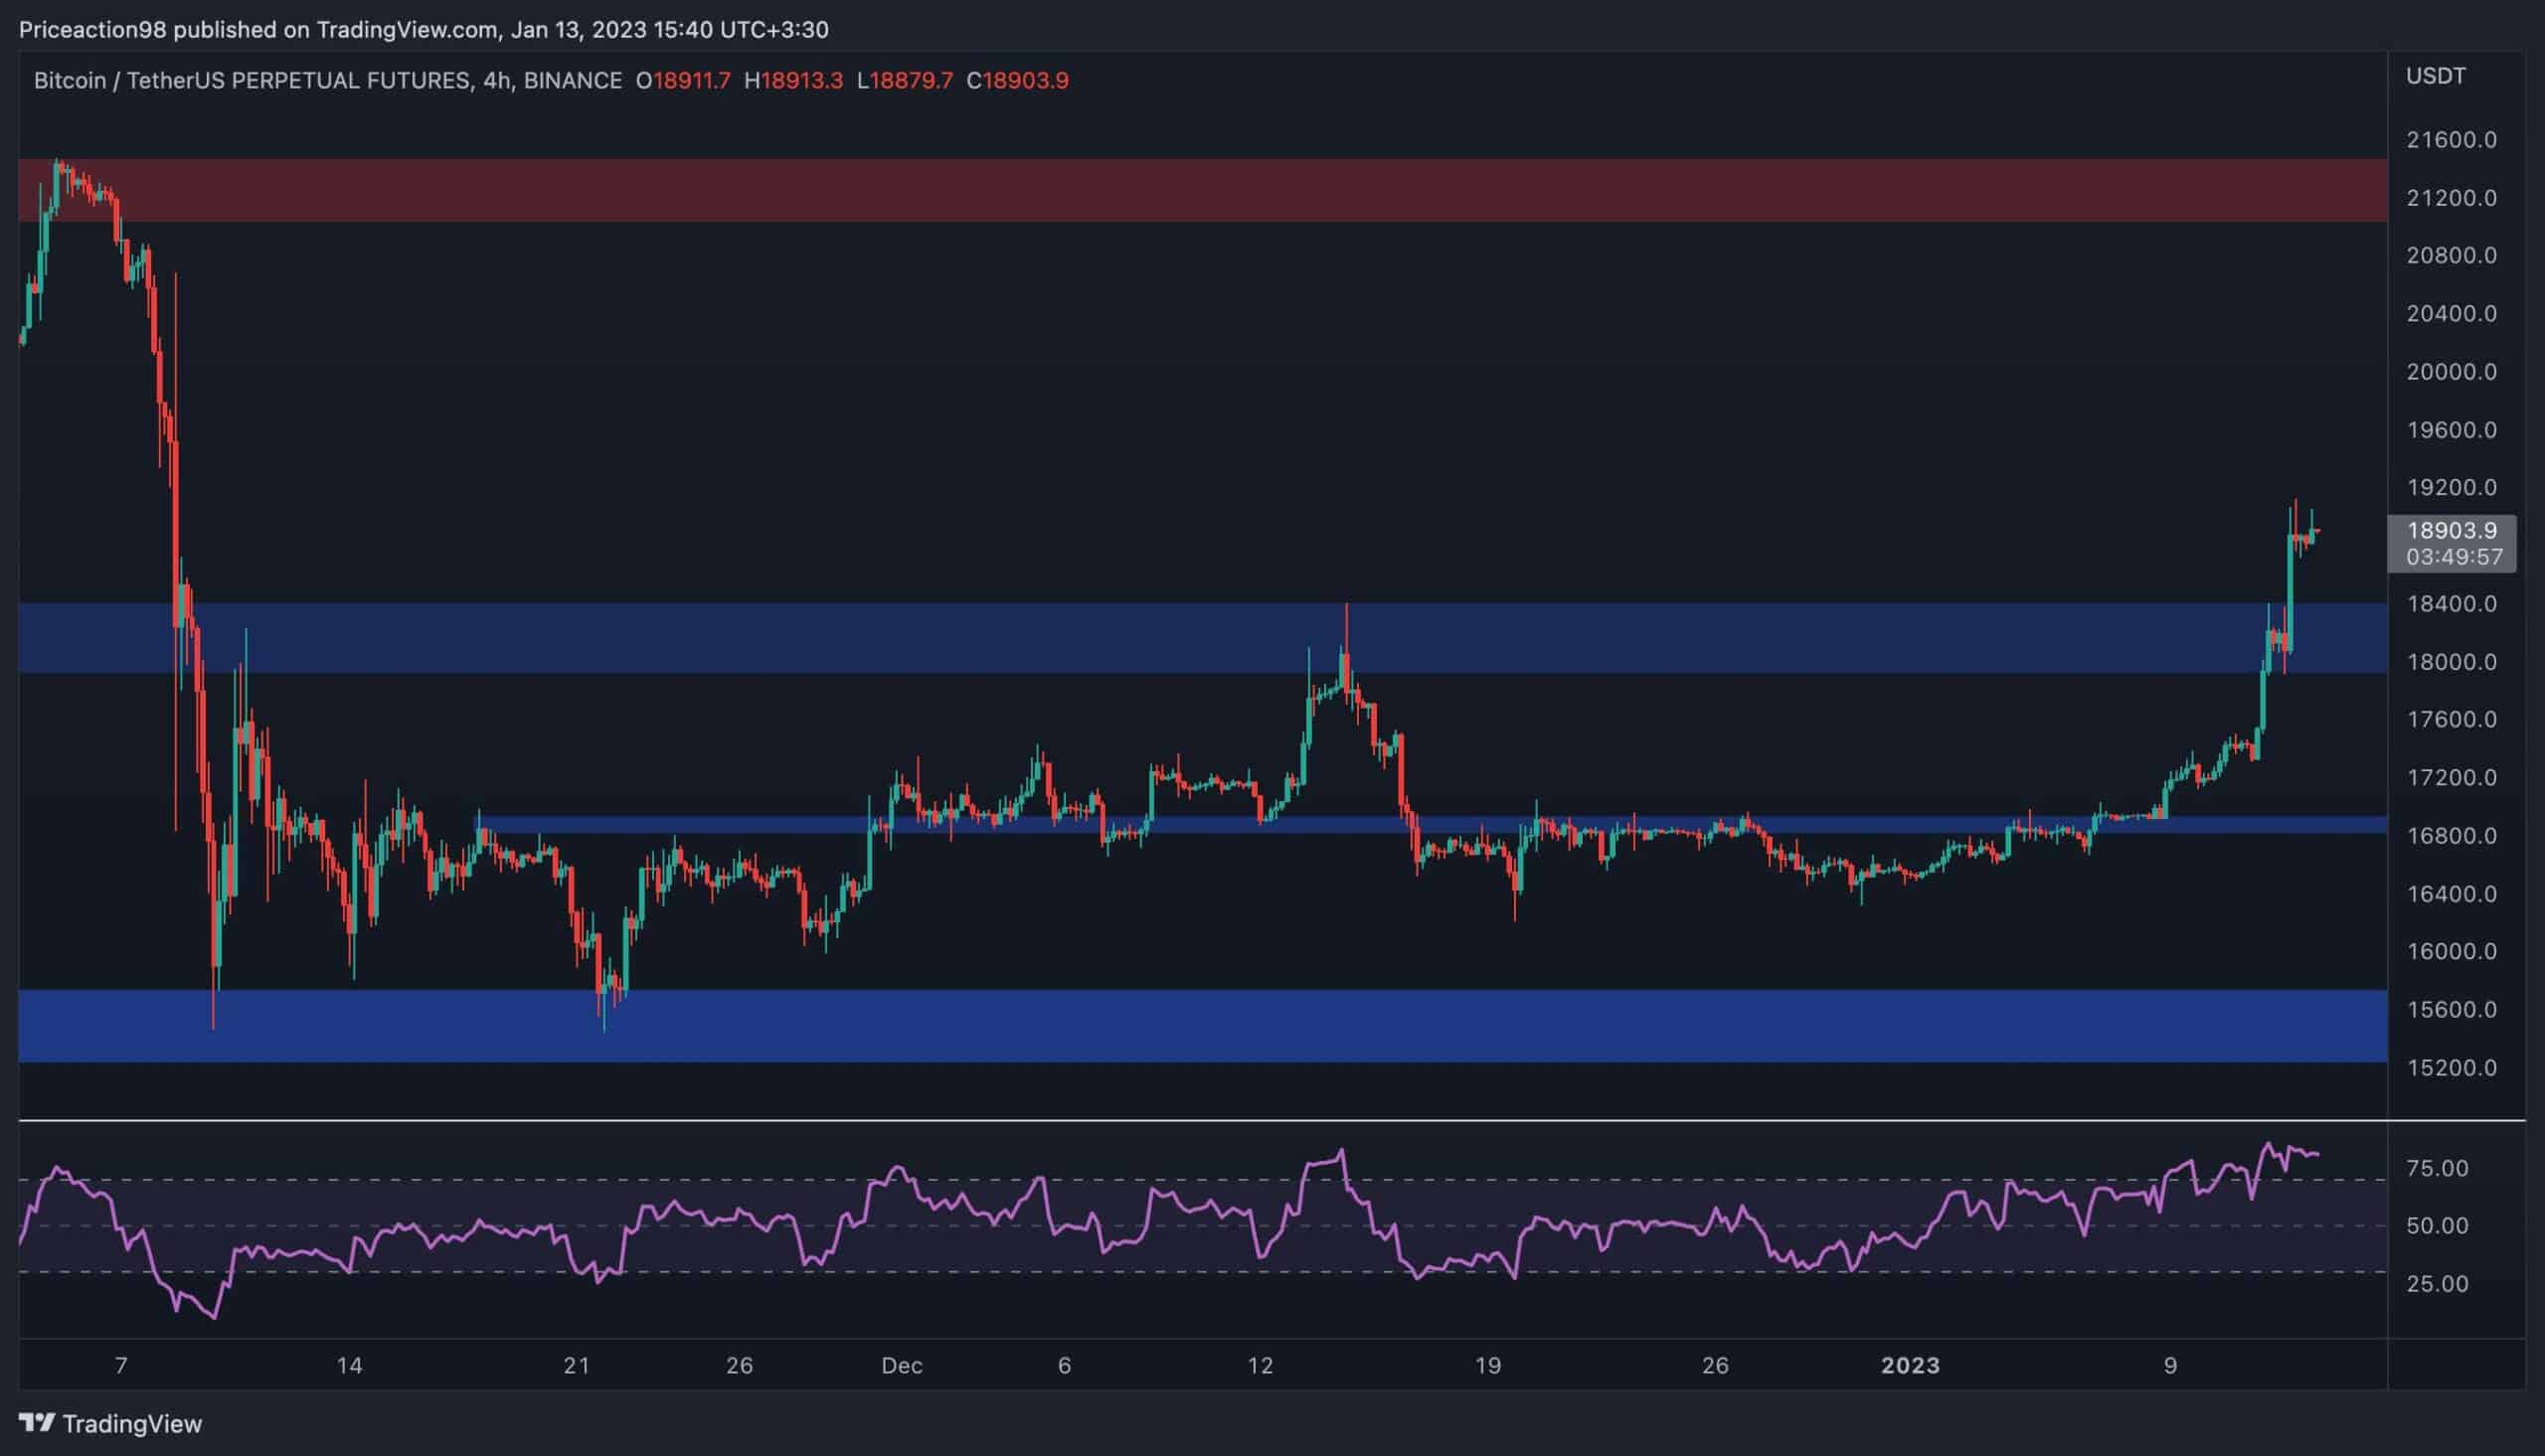
Looking at the 4-hour timeframe, CPI’s announcement has led to an impulsive breakout above the $18K resistance area.
While the next target is seemingly the $21K level, there is a very high probability for at least a pullback to the broken $18K level, considering the RSI overbought signal on both the daily and the 4H timeframe. Though in case the price falls below the $18K level, the breakout would be considered as a failed one, leading to a decline toward the $16,800 support level and, even potentially, the $15K zone.
Onchain Analysis
By Shayan
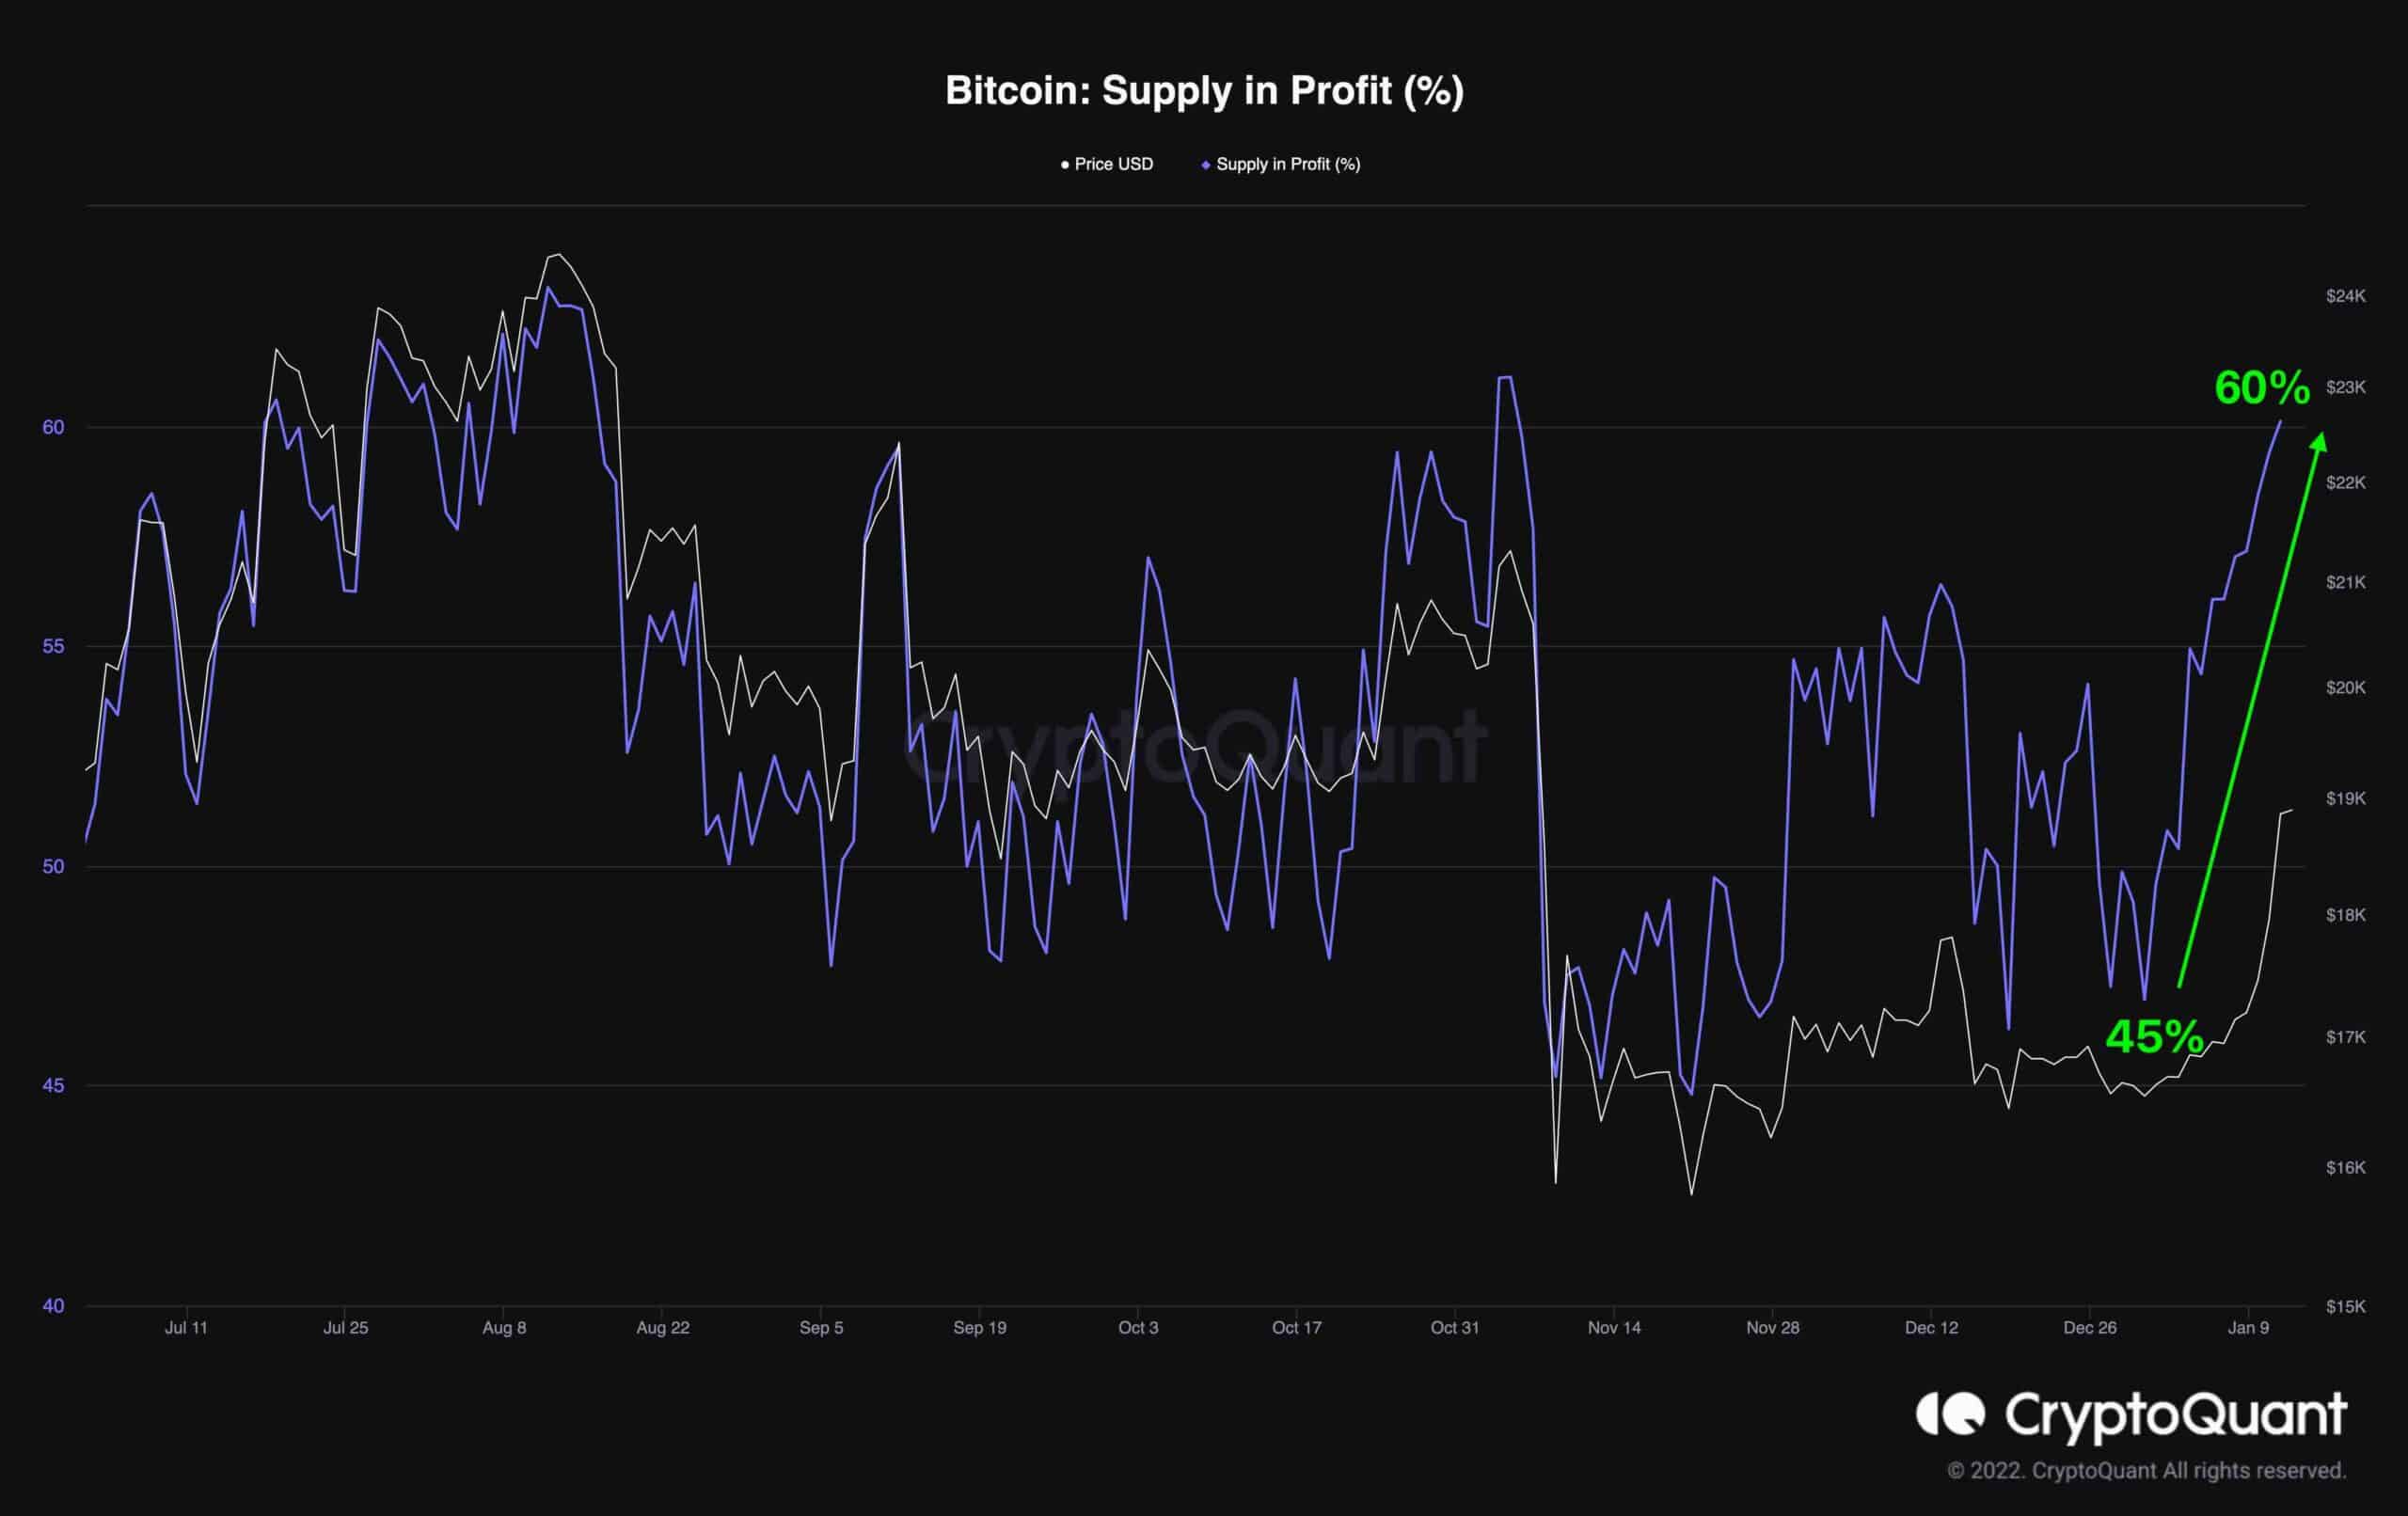
The following graph illustrates the Supply in Profit(%) ratio alongside Bitcoin’s price. The metric measures the ratio of the sum of UTXOs being in profit against the total sum of UTXOs.
An uptrend in the metric demonstrates that more investors are in profit and might consider it an opportunity to realize their profits. This typically results in higher selling pressure and might cause a price reversal.
This week, the market experienced a sudden surge, and Bitcoin spiked by over 10%, which has caused more than 13% of Bitcoin’s circulating supply to be in profit.
Considering the current state of the market, participants might use this opportunity to realize some profits and lower their exposure. Hence, a short-term consolidation followed by a correction is a probable scenario for Bitcoin in the upcoming days.