Bitcoin’s impulsive rally seems to have temporarily halted, and the price will likely enter a correction phase before the next leg up. Overall, Bitcoin is facing significant resistance at the K level, which hasn’t been tested yet. Technical Analysis By Shayan The Daily Chart After forming a pullback to the 61.8% level of the Fibonacci entrancement level at .6K, the price initiated a massive rally with a current high above K. However, the bulls couldn’t reach the significant resistance region of K. This price area also acts as a psychological resistance zone, as many traders believe that once the price surpasses the K level, the bear market will be officially terminated. Nevertheless, a clear divergence between the price and the RSI indicator can be
Topics:
CryptoVizArt considers the following as important: Bitcoin (BTC) Price, BTC Analysis, BTCEUR, BTCGBP, btcusd, btcusdt
This could be interesting, too:
Chayanika Deka writes XRP, SOL, and ADA Inclusion in US Crypto Reserve Pushes Traders on Edge
Chayanika Deka writes Why Arthur Hayes Is Bullish on Bitcoin Under Trump’s Economic Strategy
Mandy Williams writes Why the Bitcoin Market Is Stuck—and the Key Metric That Could Change It: CryptoQuant CEO
Wayne Jones writes Metaplanet Acquires 156 BTC, Bringing Total Holdings to 2,391
Bitcoin’s impulsive rally seems to have temporarily halted, and the price will likely enter a correction phase before the next leg up. Overall, Bitcoin is facing significant resistance at the $30K level, which hasn’t been tested yet.
Technical Analysis
By Shayan
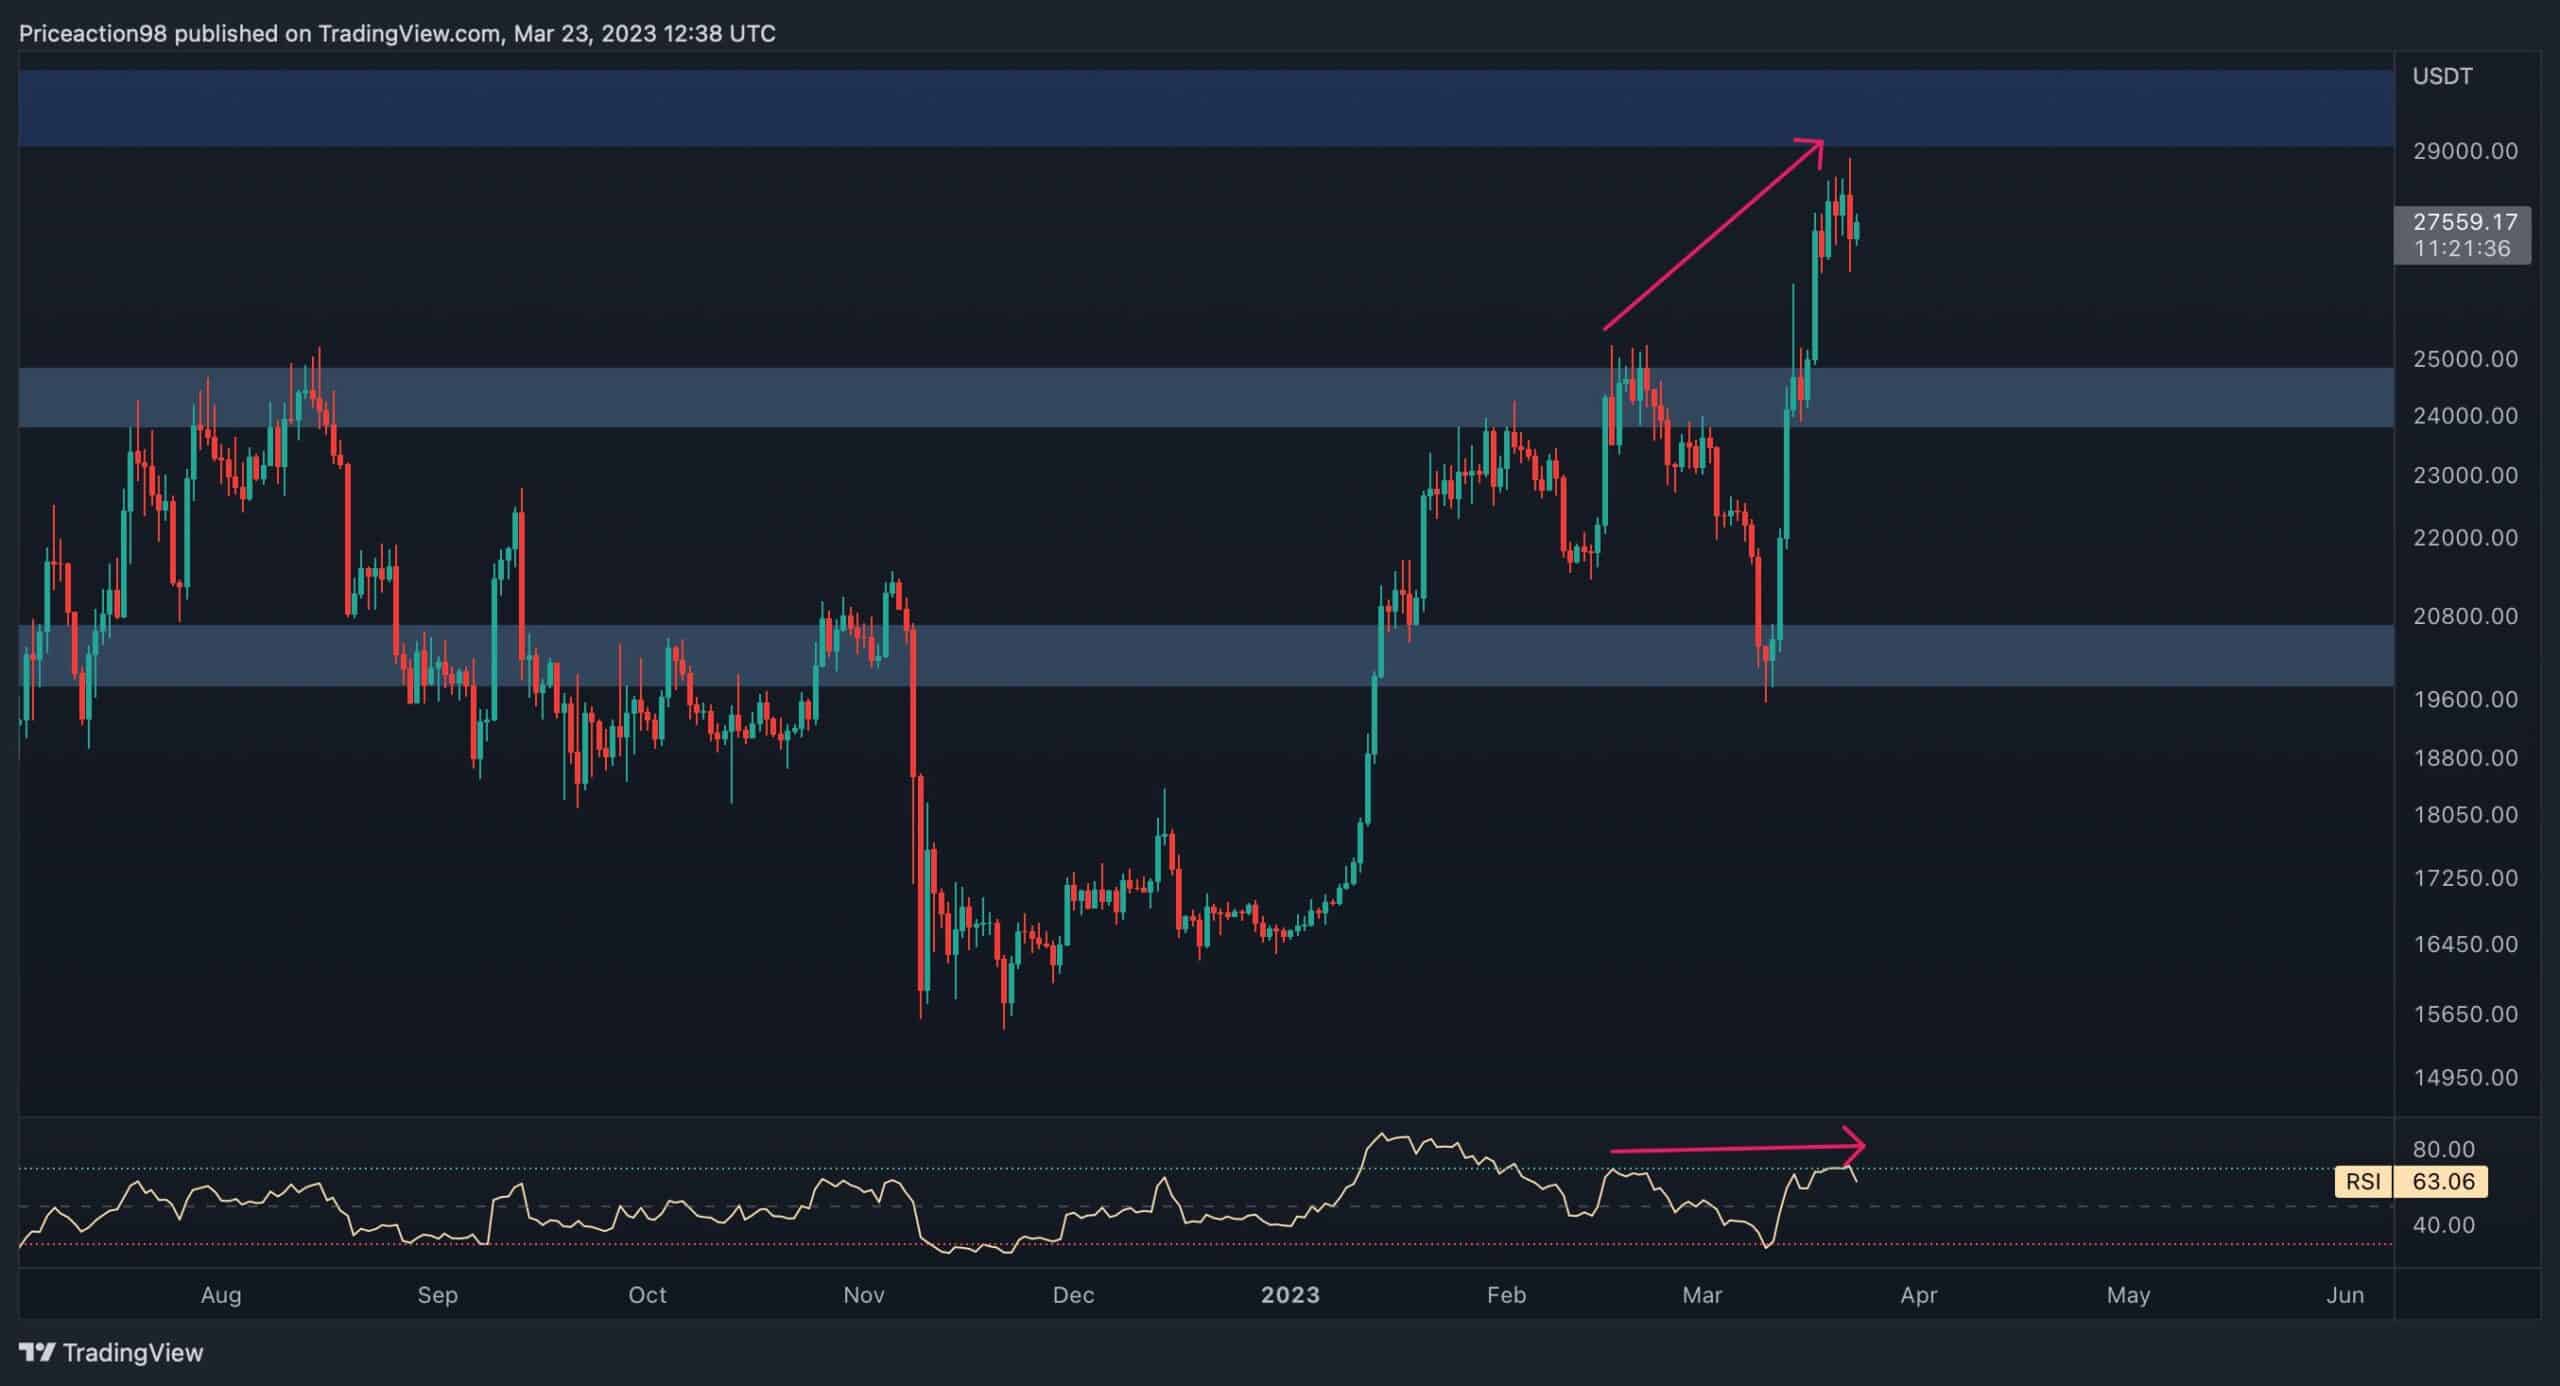
The Daily Chart
After forming a pullback to the 61.8% level of the Fibonacci entrancement level at $19.6K, the price initiated a massive rally with a current high above $28K. However, the bulls couldn’t reach the significant resistance region of $30K.
This price area also acts as a psychological resistance zone, as many traders believe that once the price surpasses the $30K level, the bear market will be officially terminated. Nevertheless, a clear divergence between the price and the RSI indicator can be identified, potentially leading to a short-term correction or consolidation stage.
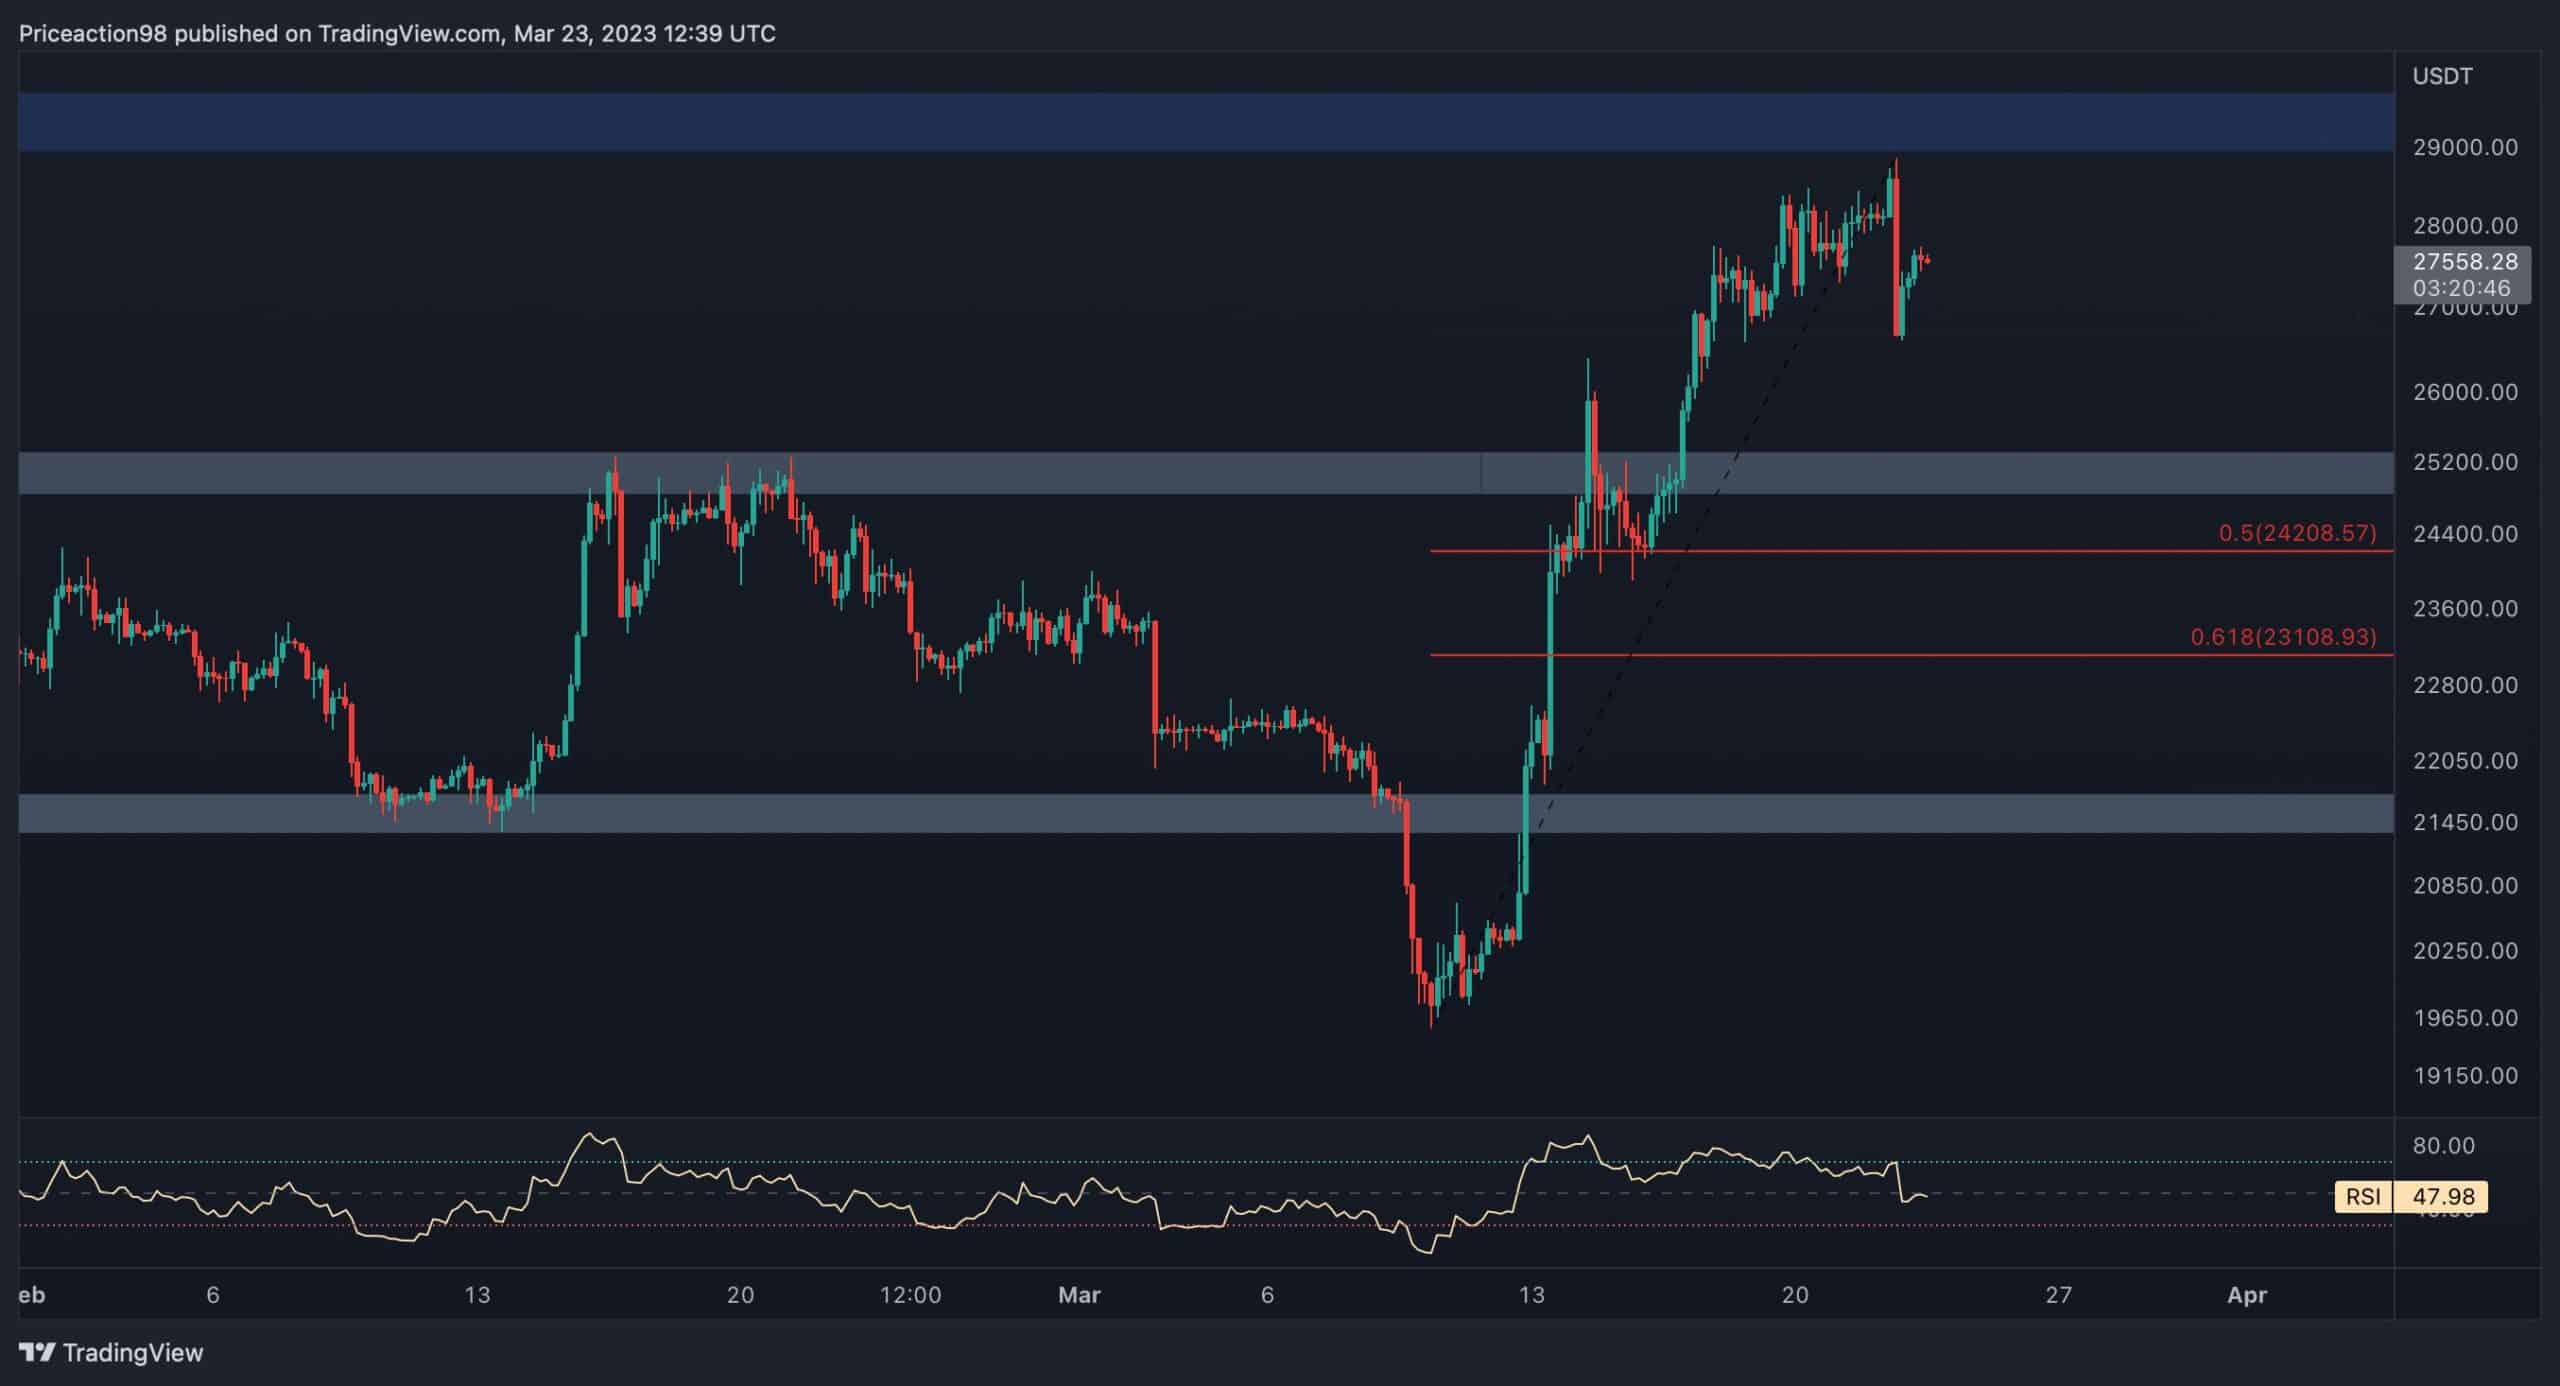
The 4-Hour Chart
The impulsive bullish rally is more evident on the 4-hour timeframe. However, recent price action indicates that the bullish momentum has decreased, and the price is likely to enter a short-term consolidation or correction phase.
Bitcoin could retest two major support levels in this scenario: the $25K significant support level and the price zone between the 0.5 and 61.8 Fib retracement levels, roughly at $24.4K and $23K.
Nevertheless, there is also a divergence between the price and the RSI indicator in the 4-hour timeframe, increasing the likelihood of a short-term correction before the next significant move.
On-chain Analysis
By Shayan
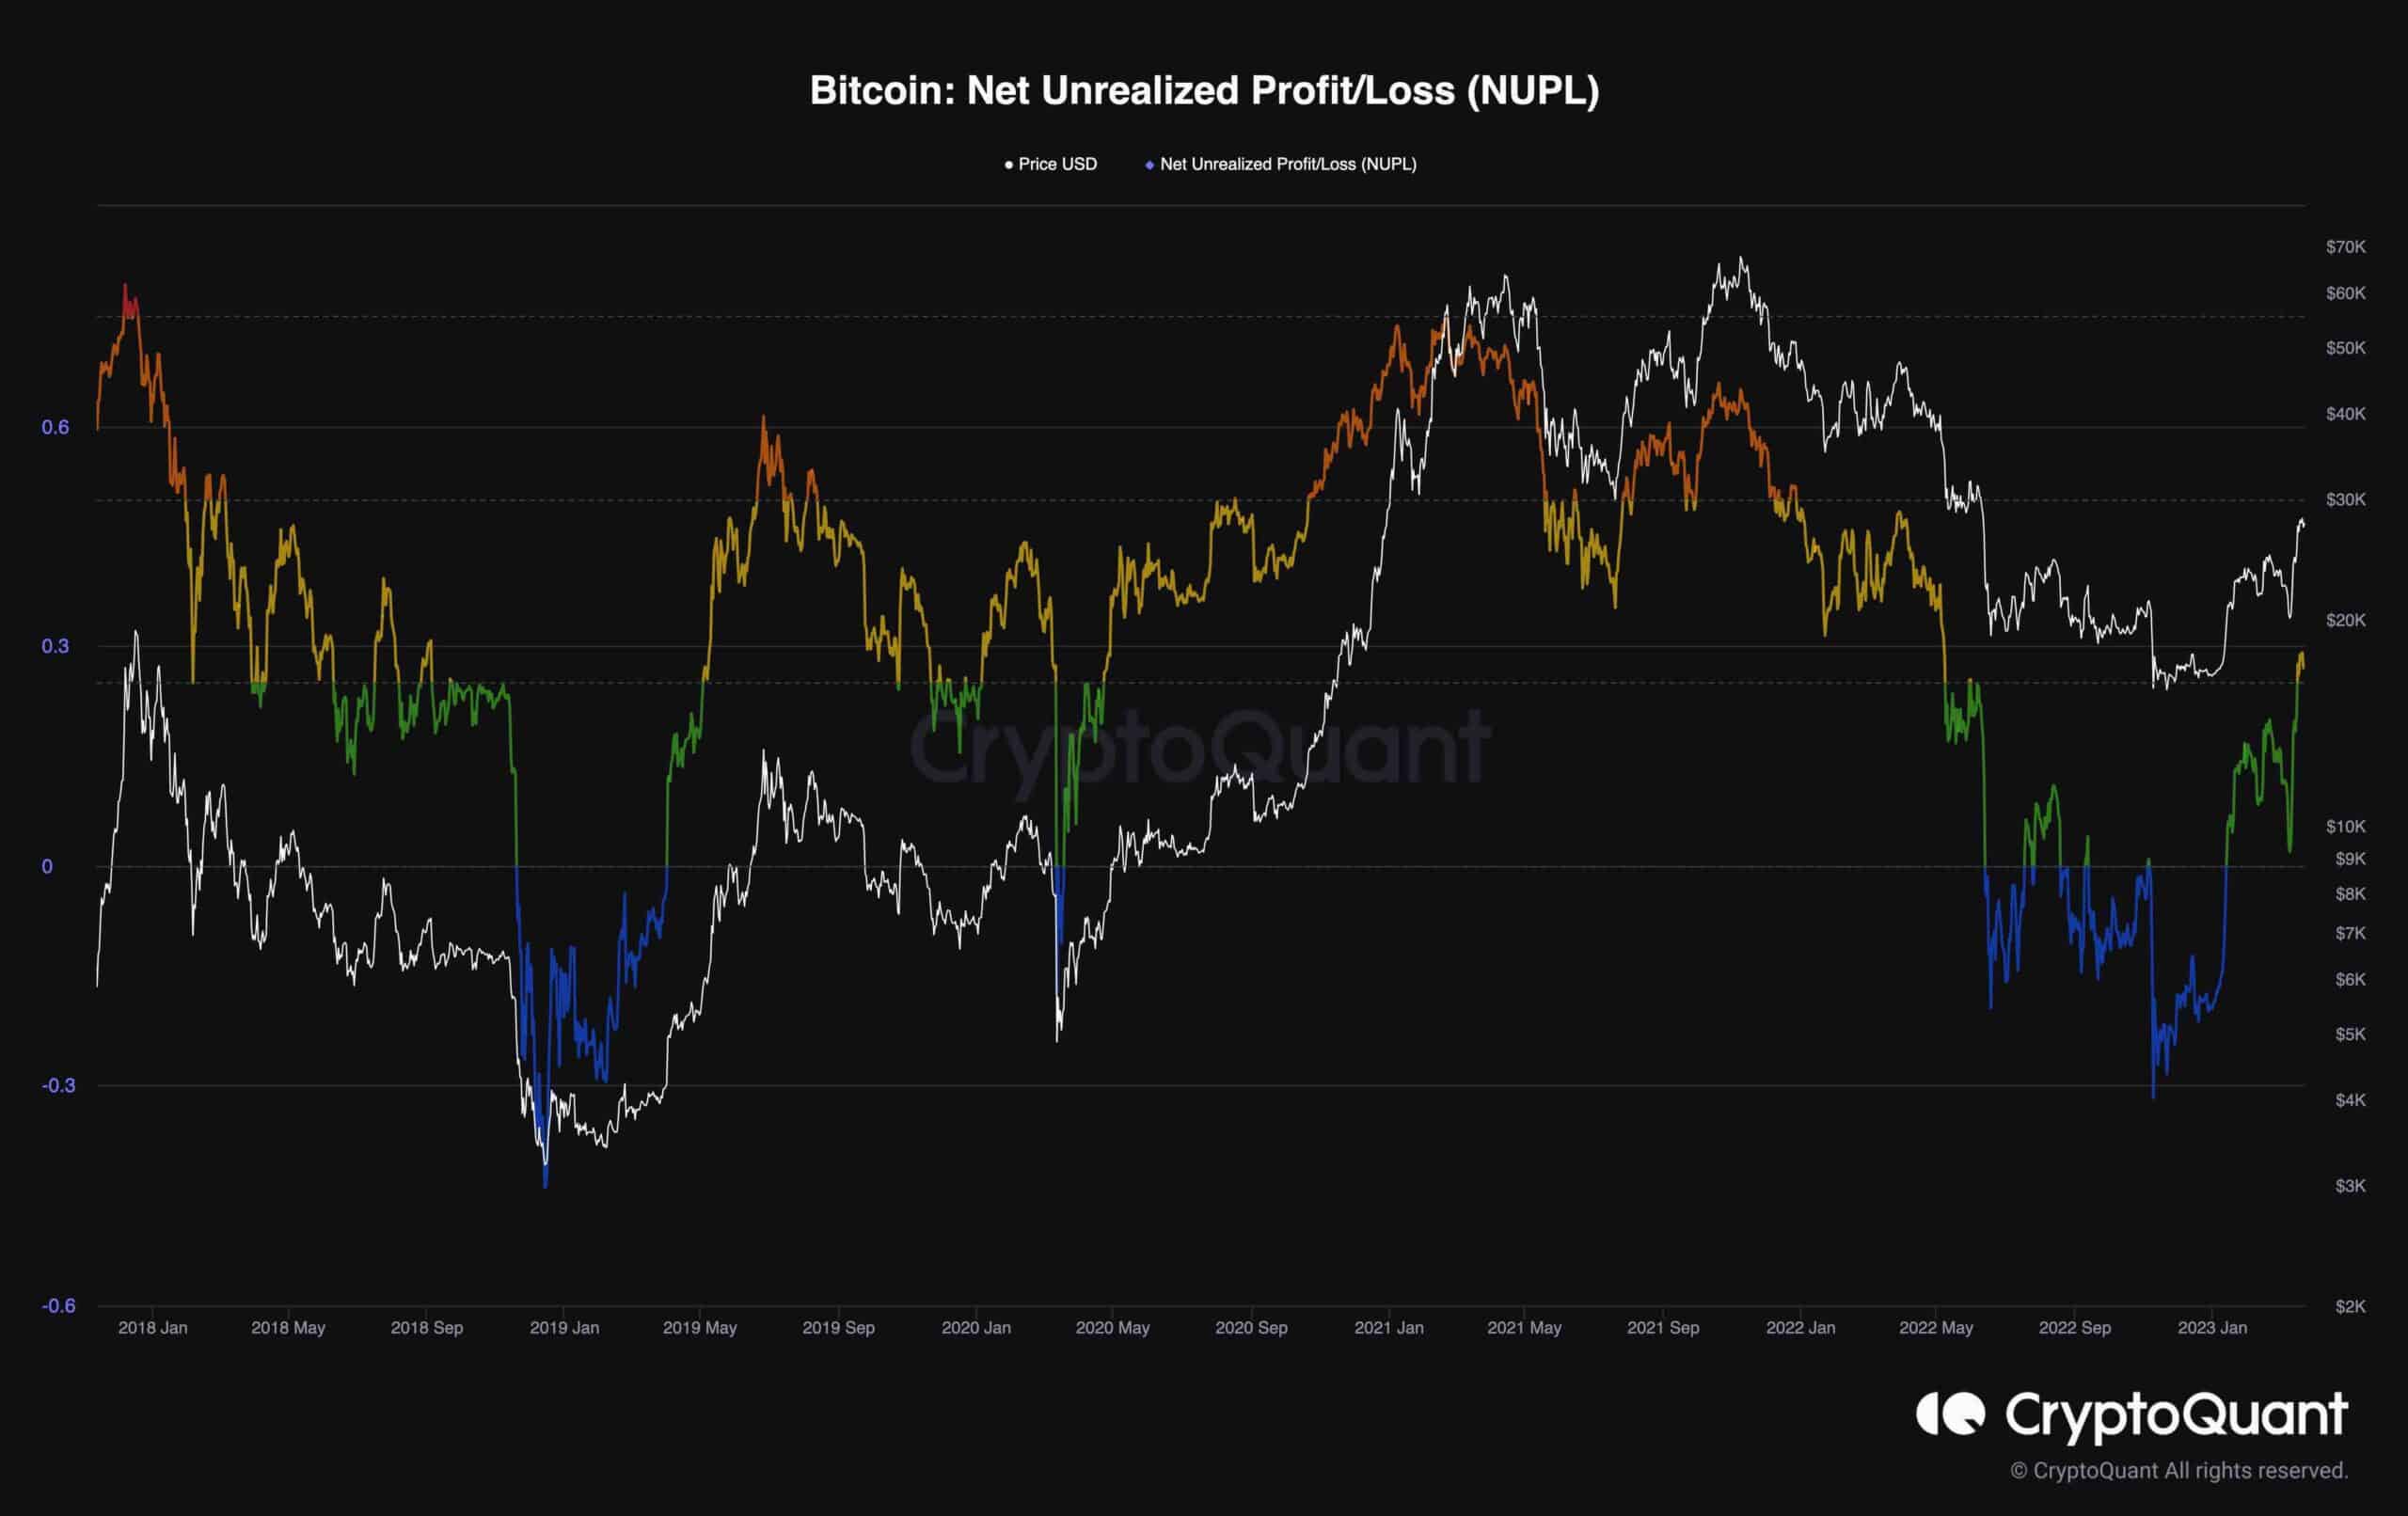
As a result of the recent surge in Bitcoin’s price, traders see their portfolios rise above the break-even point, resulting in a shift towards a positive market sentiment.
The Net Unrealized Profit and Loss (NUPL) measures the profit or loss of all coins as a ratio calculated by dividing the difference between market cap and realized cap by market cap.
Assuming the latest coins transfer is due to a purchase, NUPL indicates the total profit or loss in all the coins. Following months of negative values, the recent rally caused NUPL to enter the yellow zone, meaning more investors are now experiencing profits. This shift may be interpreted as a bullish signal, as fewer market participants are pressured to sell their coins to prevent further losses.