Bitcoin’s price has been consolidating above the K support level following the recent drop from the key K zone. However, for the price to reach a new high and break past K, there is still much work to do. Technical Analysis By Edris The Daily Chart On the daily chart, the price has been rejected from the K support level and is trending higher. Yet, the 50-day and 200-day moving averages around the K mark are two significant resistance levels that the market should break through for a retest and potential breakout from the K zone. The RSI indicator has also increased above the 50% threshold, indicating that momentum is once again in favor of the buyers. Source: TradingViewThe 4-Hour Chart The 4-hour timeframe demonstrates a clearer picture of the recent
Topics:
CryptoVizArt considers the following as important: Bitcoin (BTC) Price, BTC Analysis, BTCEUR, BTCGBP, btcusd, btcusdt
This could be interesting, too:
Chayanika Deka writes XRP, SOL, and ADA Inclusion in US Crypto Reserve Pushes Traders on Edge
Chayanika Deka writes Why Arthur Hayes Is Bullish on Bitcoin Under Trump’s Economic Strategy
Mandy Williams writes Why the Bitcoin Market Is Stuck—and the Key Metric That Could Change It: CryptoQuant CEO
Wayne Jones writes Metaplanet Acquires 156 BTC, Bringing Total Holdings to 2,391
Bitcoin’s price has been consolidating above the $25K support level following the recent drop from the key $30K zone.
However, for the price to reach a new high and break past $30K, there is still much work to do.
Technical Analysis
By Edris
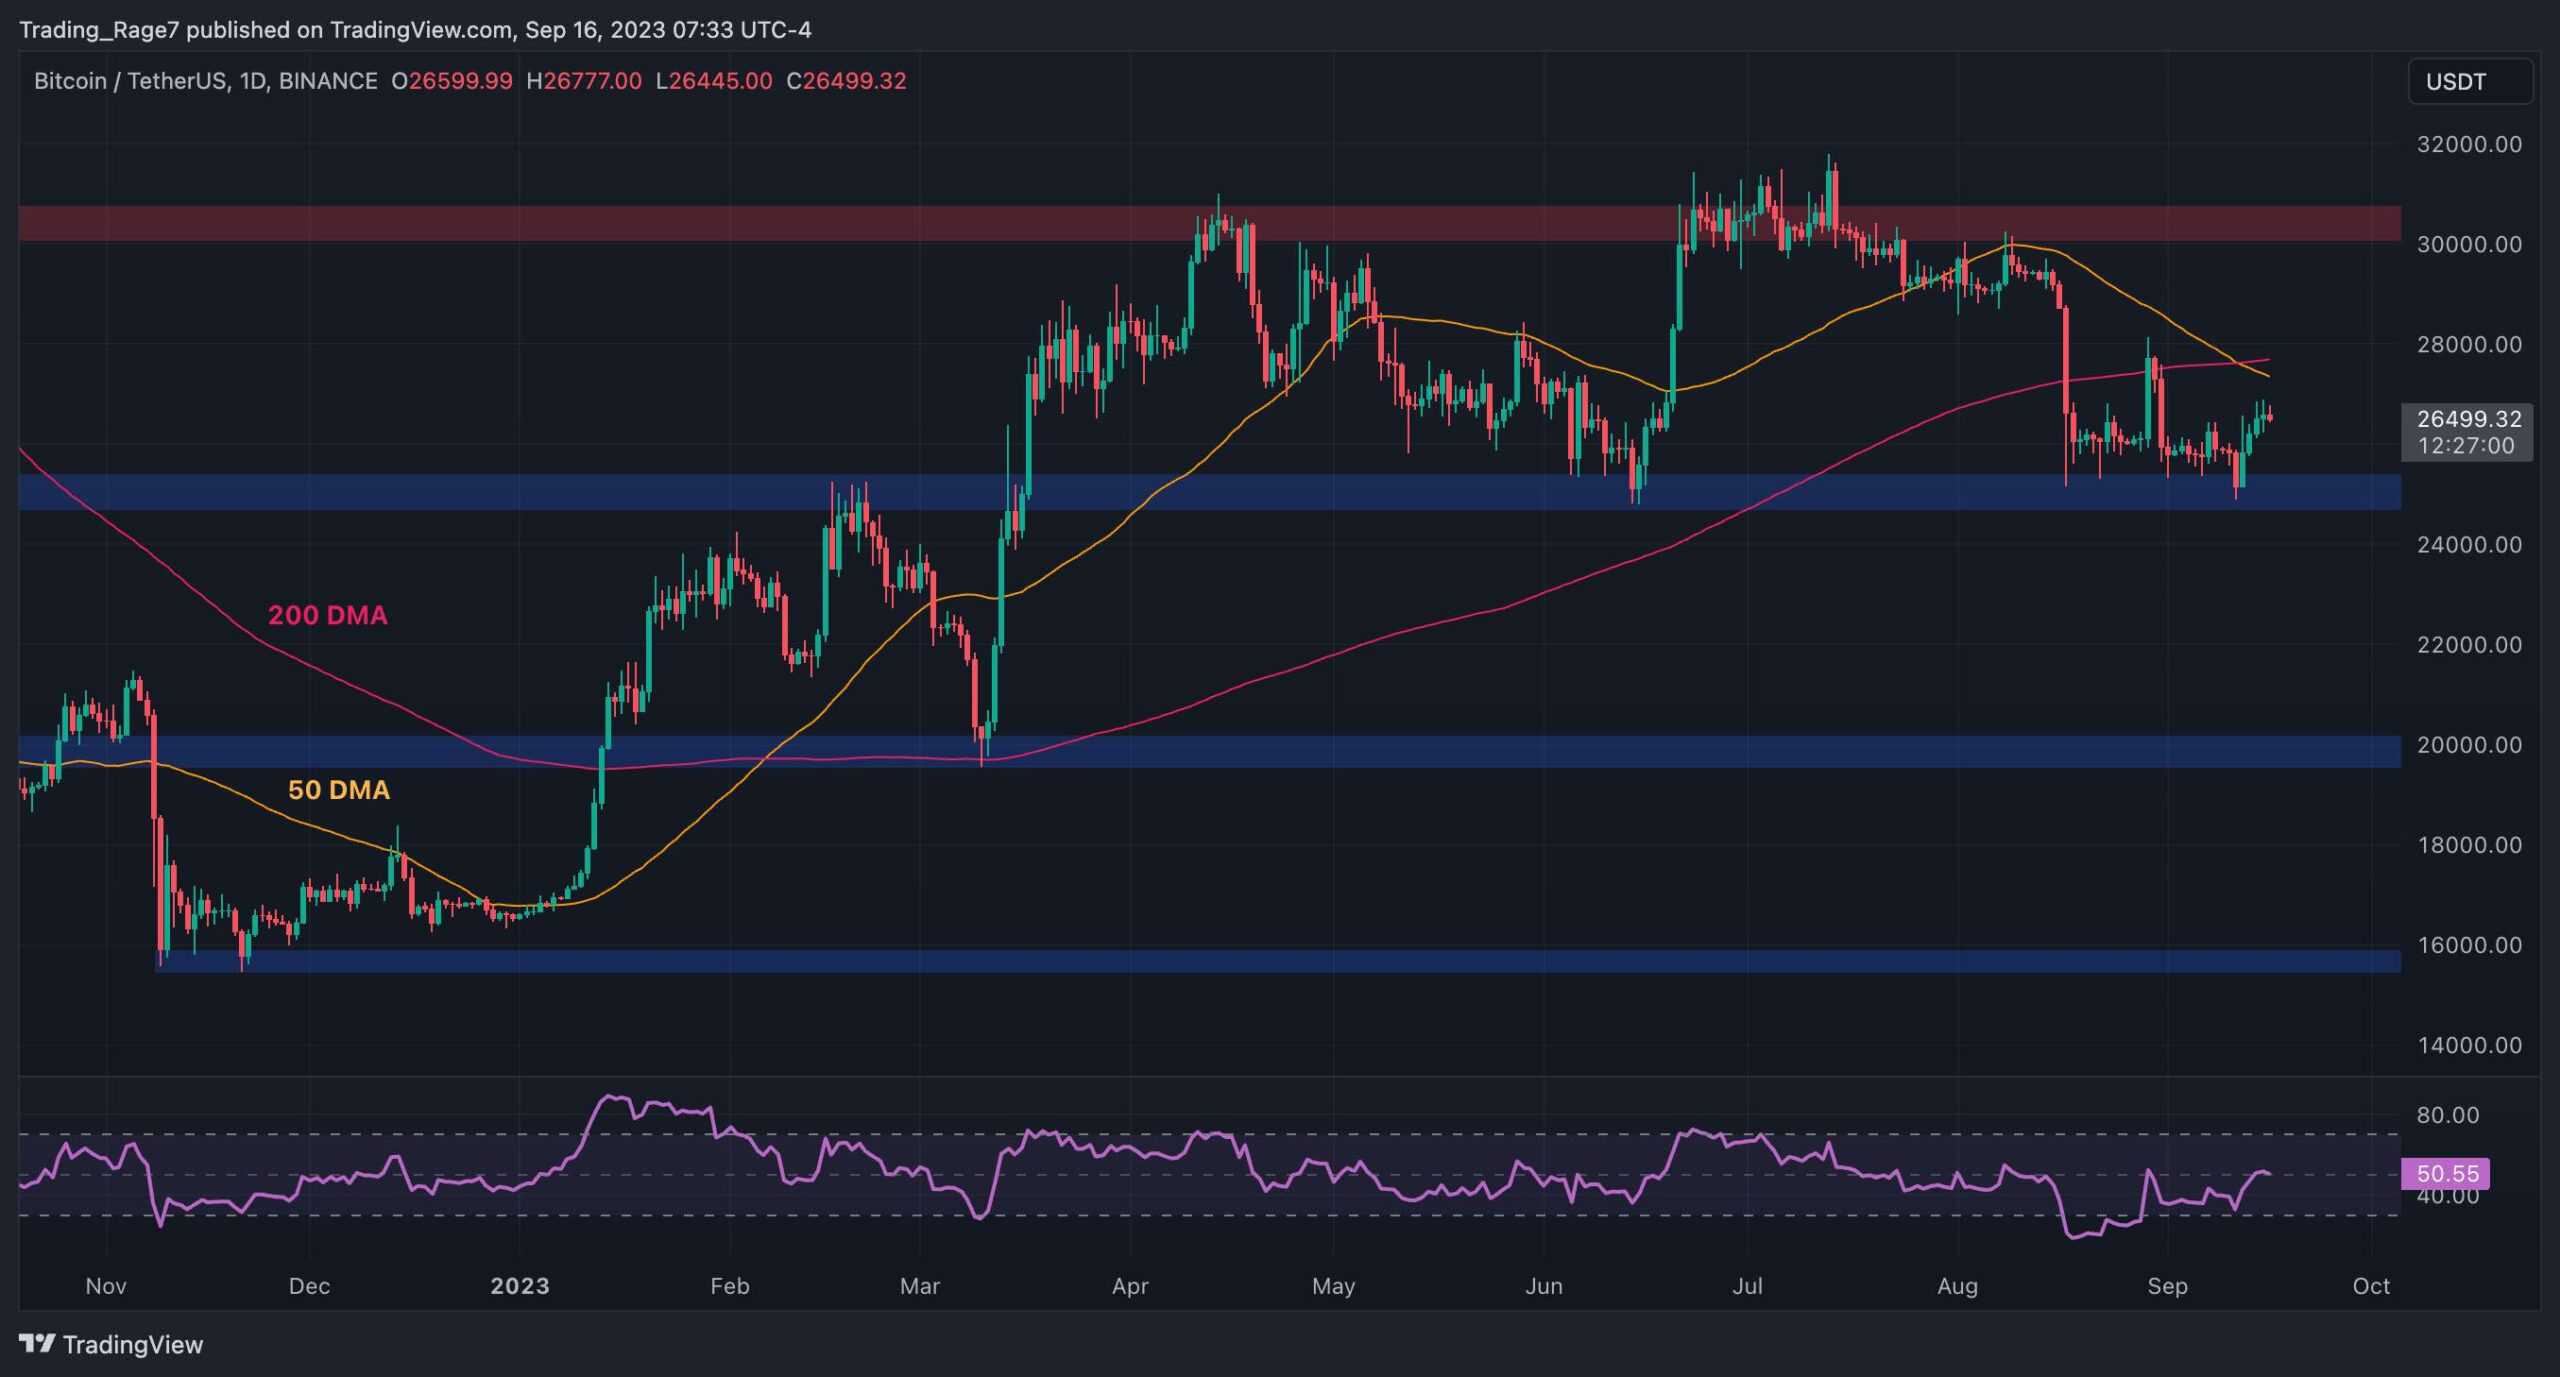
The Daily Chart
On the daily chart, the price has been rejected from the $25K support level and is trending higher. Yet, the 50-day and 200-day moving averages around the $28K mark are two significant resistance levels that the market should break through for a retest and potential breakout from the $30K zone.
The RSI indicator has also increased above the 50% threshold, indicating that momentum is once again in favor of the buyers.
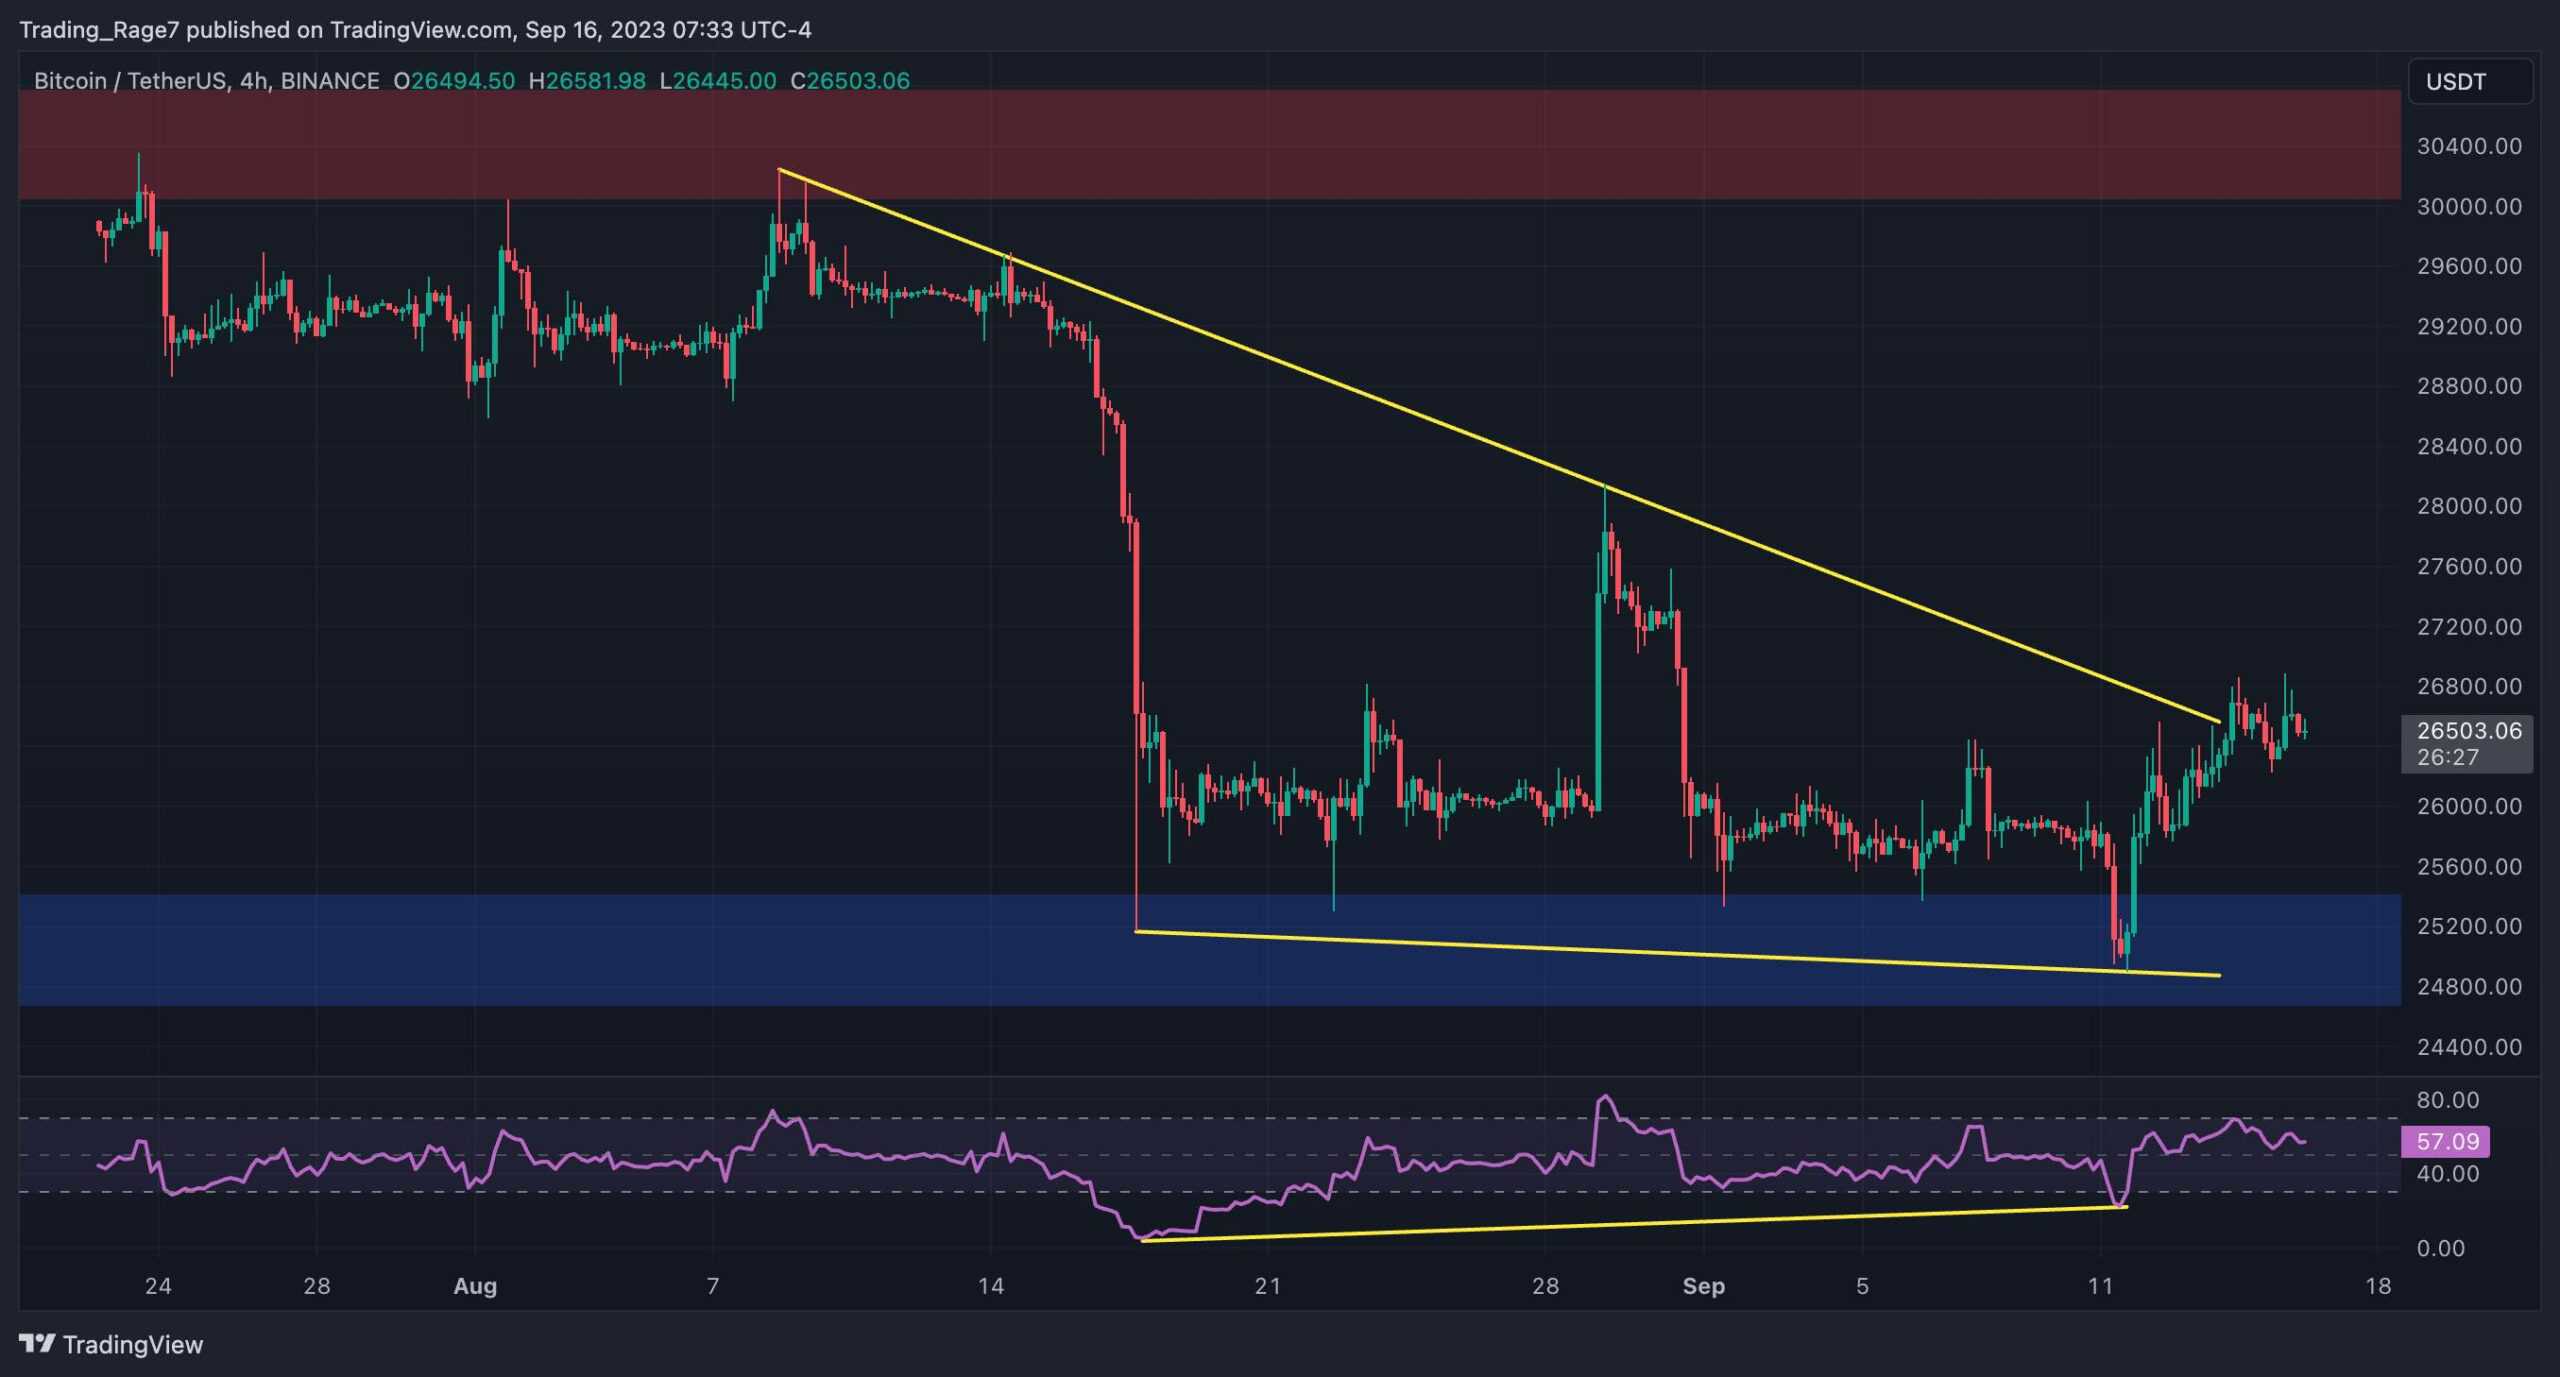
The 4-Hour Chart
The 4-hour timeframe demonstrates a clearer picture of the recent price action. The market is currently attempting to break above the upper boundary of the large falling wedge pattern. In case of a successful breakout, the price is likely to rally towards the $30K resistance level in the short term, as this is a classic bullish reversal pattern.
The RSI’s recent bullish divergence also validates the reversal scenario, making another rise toward the $30K zone more probable.
On-chain Analysis
By Edris
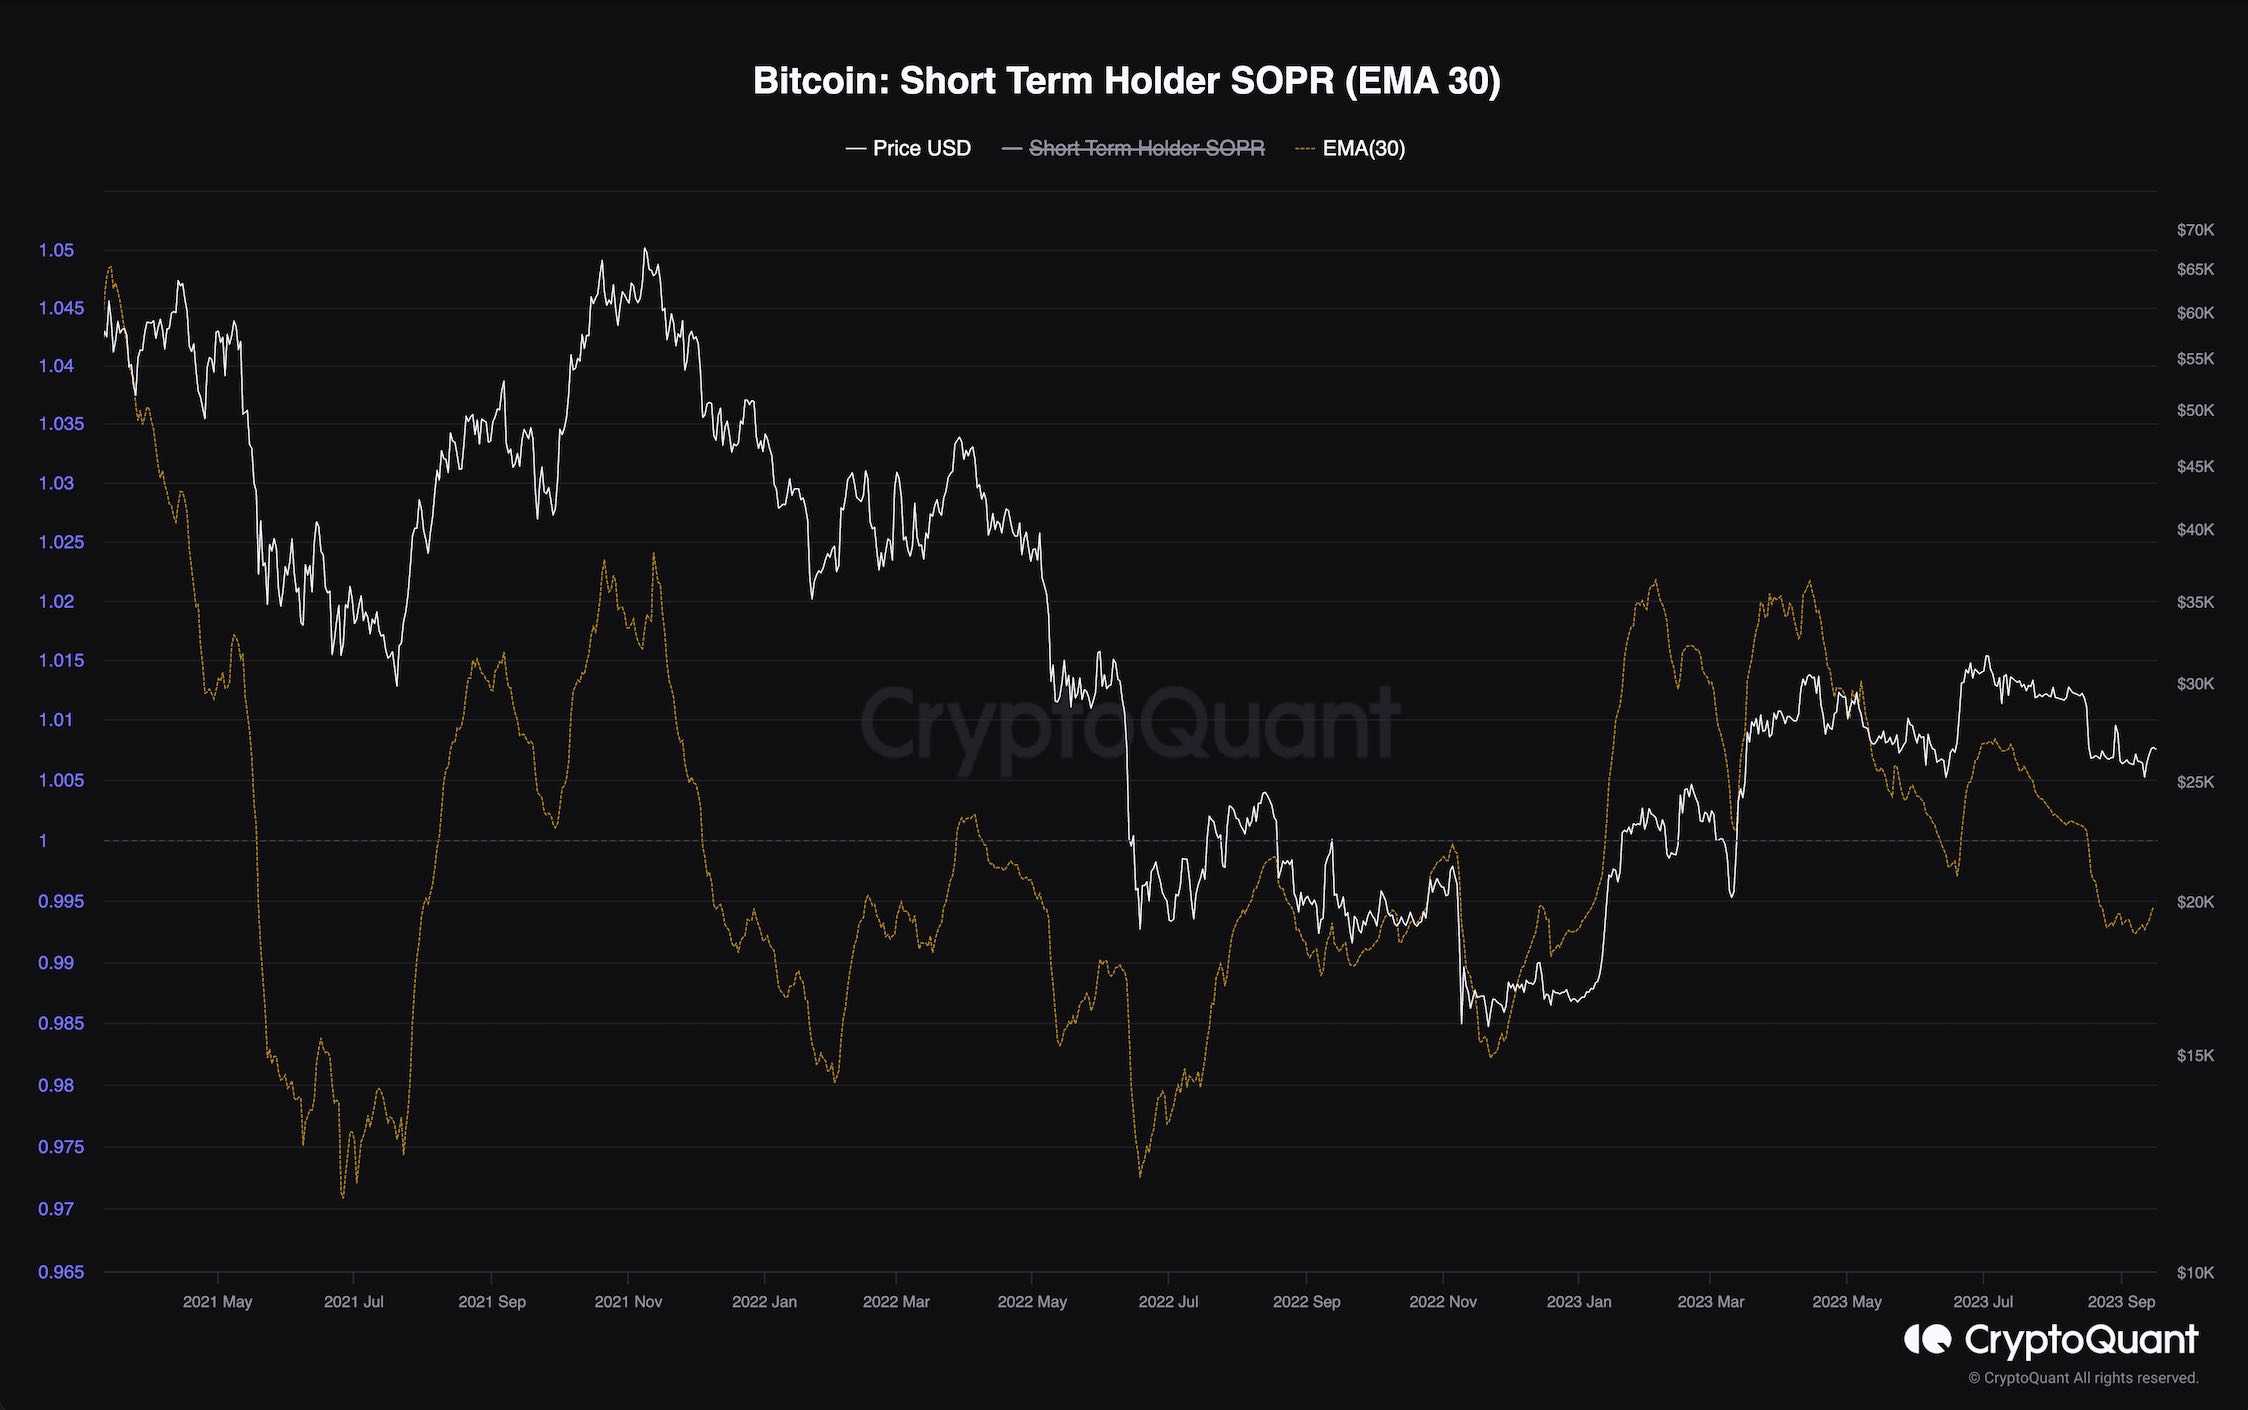
Short-Term Holder SOPR
Bitcoin’s price has been decisively rejected from the $30K resistance level and has been trending down. This price decline has affected investors, and analyzing its effects could provide valuable insights.
This chart demonstrates the Short-Term Holder Spent Output Ratio metric or STH SOPR. A 30-day exponential moving average is applied for better visualization. This metric indicates whether short-term holders who have bought their coins in the past 6 months are selling at a profit or a loss on aggregate. Values above 1 show profit realization, while values below 1 indicate realizing losses.
As the chart depicts, the STH SOPR metric has been trending below 1 over the last few weeks following the recent price drop. Therefore, short-term holders are selling their coins below their buying price out of fear and to prevent further losses. While capitulation in the middle of an uptrend is usually a good thing, as weak hands transfer their coins to strong hands, the market is not in a bullish phase yet. Therefore, if this behavior continues, the market might be overwhelmed by the resulting excess supply and drop lower.