After reaching the critical price area of -30K, Bitcoin’s bullish rally got rejected, and the price went back into the -28K consolidation range. Over the next short-term, the K mark will likely serve as the most major resistance. This range was the bottom recorded in mid-2021 before the rally to the current Bitcoin’s ATH at K recorded in November 2021. Technical Analysis By Shayan The Daily Chart After forming a pullback to the 100-day moving average line at .6K, the price continued to spike with notable bullish momentum. However, Bitcoin now faces powerful resistance at K. On the bearish side, a significant divergence between the price and the RSI indicator can be seen, which could lead to a correction phase before a possible continuation upwards. The
Topics:
CryptoVizArt considers the following as important: Bitcoin (BTC) Price, BTC Analysis, btcusd, btcusdt
This could be interesting, too:
Chayanika Deka writes XRP, SOL, and ADA Inclusion in US Crypto Reserve Pushes Traders on Edge
Chayanika Deka writes Why Arthur Hayes Is Bullish on Bitcoin Under Trump’s Economic Strategy
Mandy Williams writes Why the Bitcoin Market Is Stuck—and the Key Metric That Could Change It: CryptoQuant CEO
Wayne Jones writes Metaplanet Acquires 156 BTC, Bringing Total Holdings to 2,391
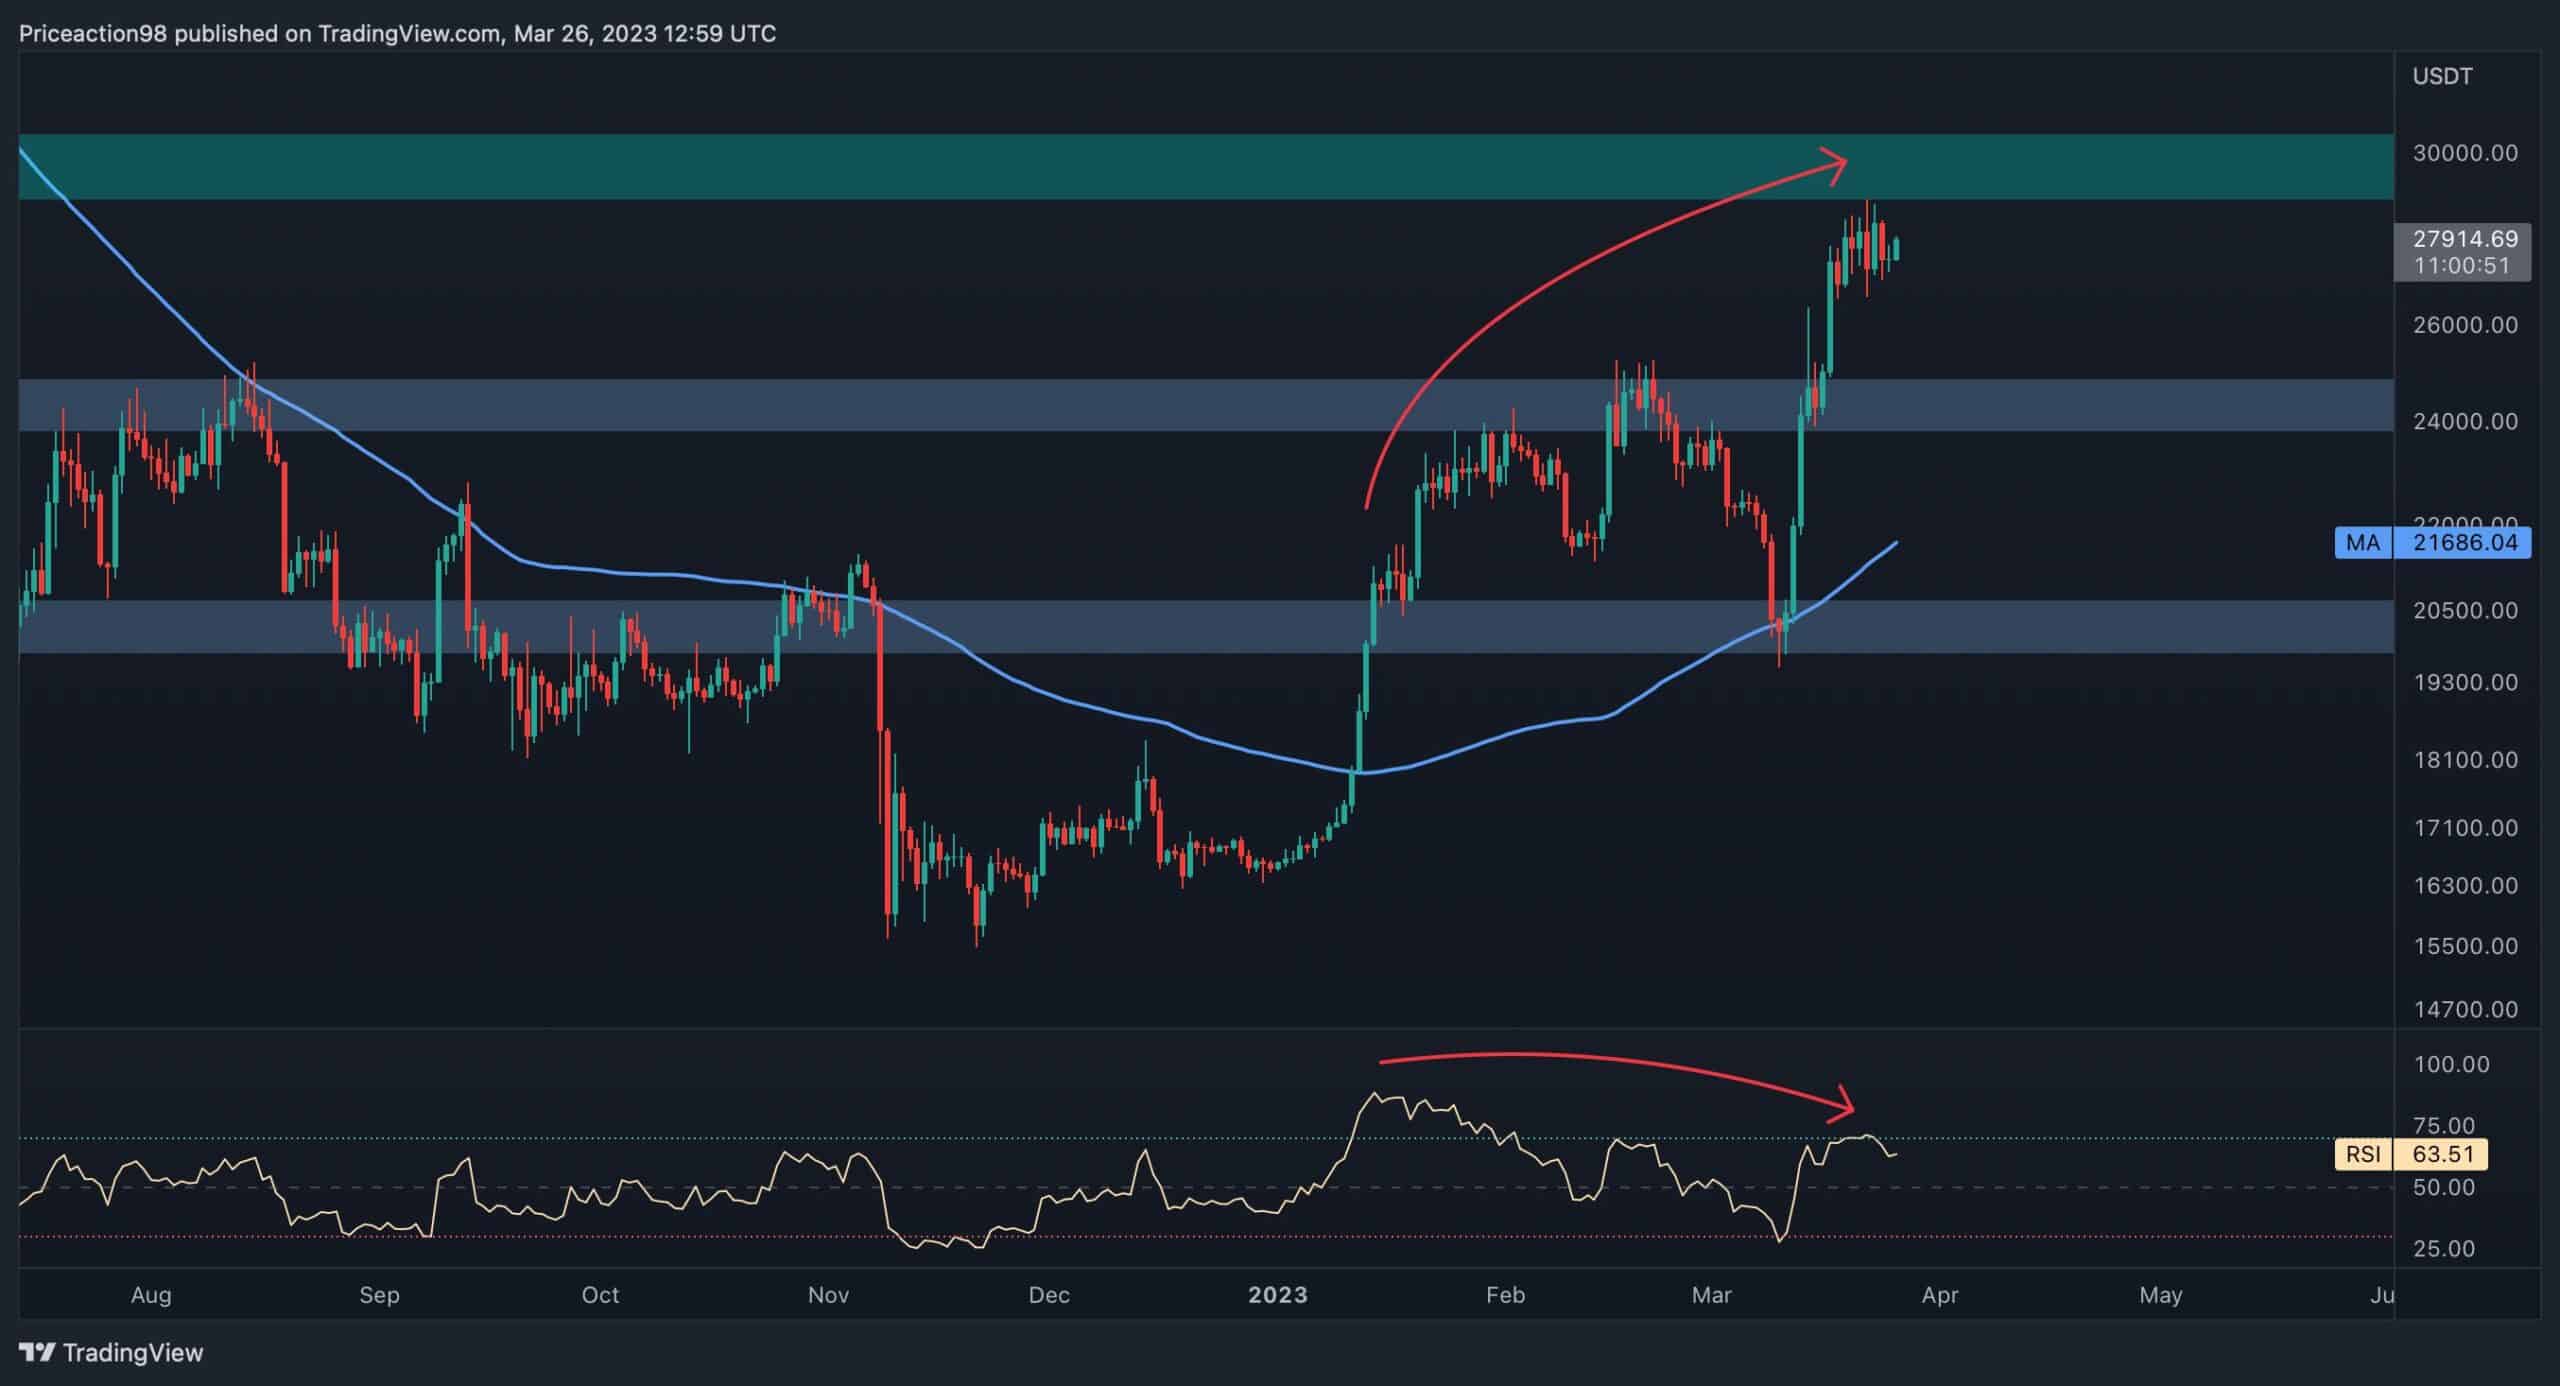
After reaching the critical price area of $29-30K, Bitcoin’s bullish rally got rejected, and the price went back into the $27-28K consolidation range.
Over the next short-term, the $30K mark will likely serve as the most major resistance. This range was the bottom recorded in mid-2021 before the rally to the current Bitcoin’s ATH at $69K recorded in November 2021.
Technical Analysis
By Shayan
The Daily Chart
After forming a pullback to the 100-day moving average line at $19.6K, the price continued to spike with notable bullish momentum. However, Bitcoin now faces powerful resistance at $30K.
On the bearish side, a significant divergence between the price and the RSI indicator can be seen, which could lead to a correction phase before a possible continuation upwards.
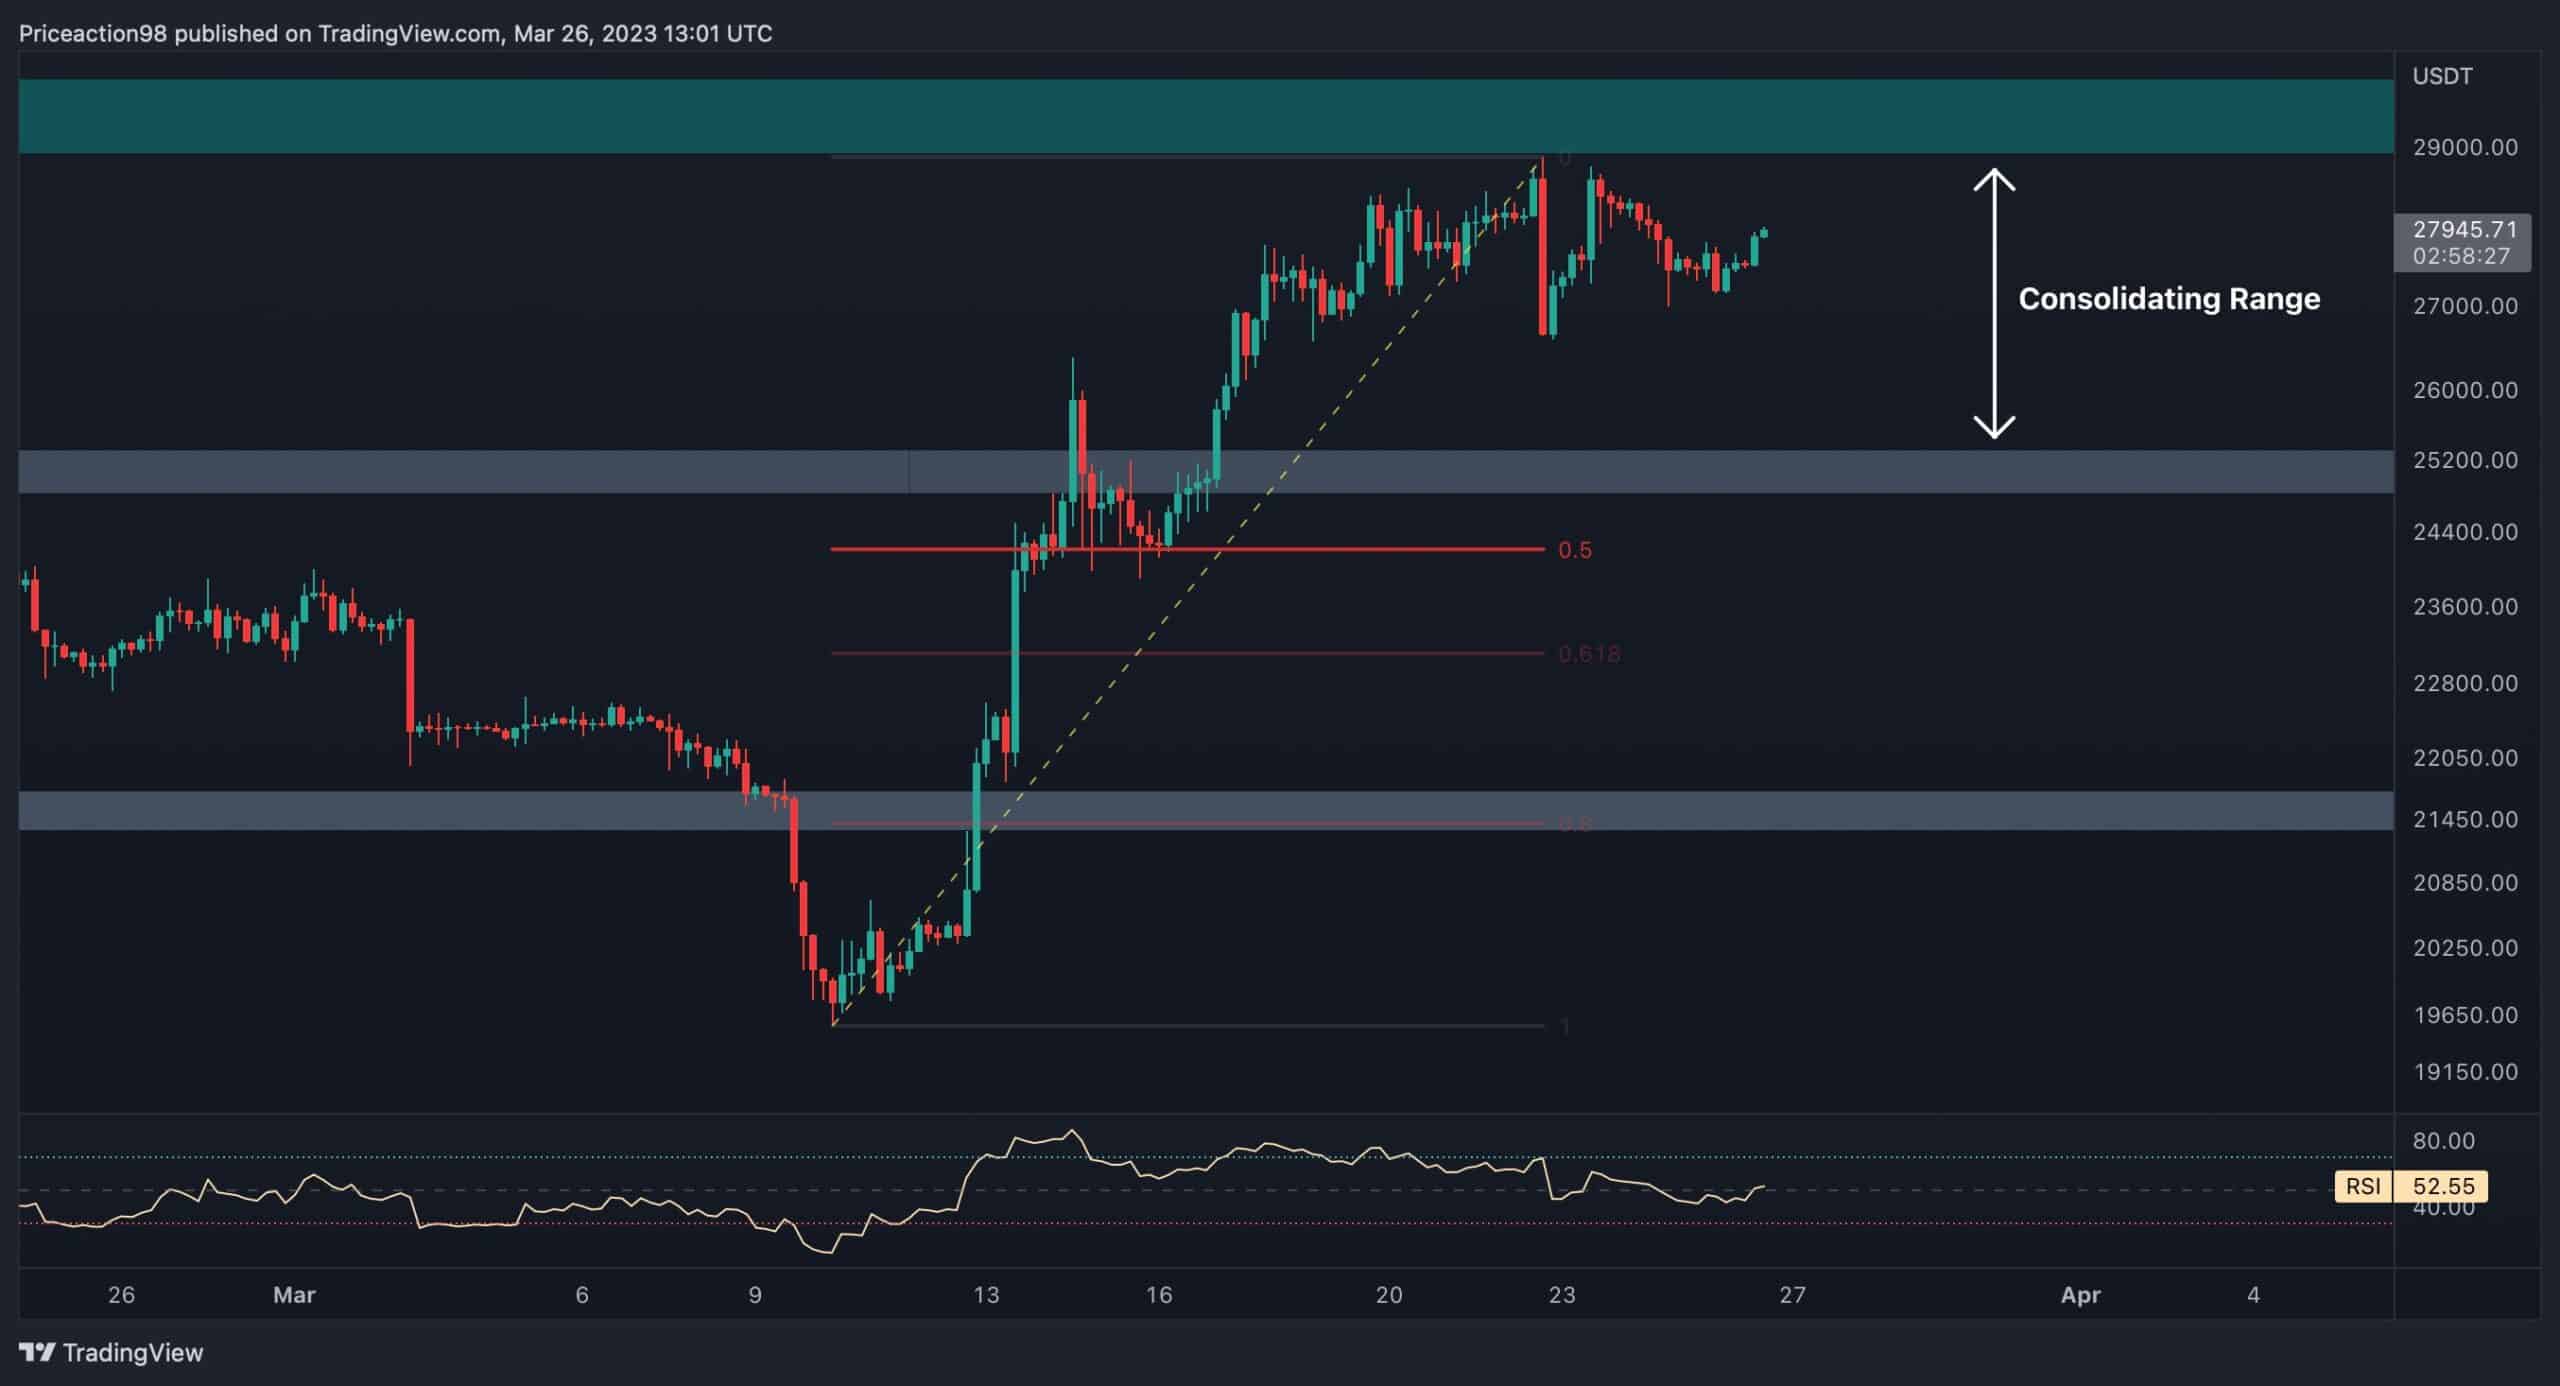
The 4-Hour Chart
By looking at Bitcoin’s recent price action, it can be seen that the intense bullish momentum has weakened while a confluence takes place between the Bitcoin bulls and bears at this specific price region.
Considering the psychological strength of the $30K price level, the most probable scenario for Bitcoin in the mid-term is to consolidate in a static range between $25K and $30K.
In the event of a significant plummet, the price range between the 0.5 ($24.4K) and 61.8 ($23K) levels of Fibonacci retracement will likely support Bitcoin.
On-chain Analysis
It appears that Bitcoin is currently experiencing a bullish market based on several dependable indicators. However, it is essential to trade with caution due to the possibility of a price correction resulting from the recent rapid increase.
The Short-Term Holder SOPR metric also supports the above, when it had seen a sudden spike simultaneously, with Bitcoin reaching the resistance zone of $30K, indicating selling pressure from short-term investors.
This price range represents a significant barrier to Bitcoin on its way up. A breakout above this level could potentially clear uncertainty and lead to massive demand to enter the market.
