Bitcoin’s price is currently testing a key area, and its reaction could determine the mid-term price action of the market. Therefore, it would be beneficial to analyze the possible scenarios thoroughly. Technical Analysis By Edris The Daily Chart On the daily timeframe, the price has been testing the 50-day moving average, located around the ,500 level, over the last few days. In the event of a bullish breakout, Bitcoin is likely to move towards the ,500 resistance level and even the 200-day moving average located around the K area. On the other hand, a bearish rejection could lead to a drop to the K level and potentially lower, which would be disastrous as the market would likely crash again. Source: TradingViewThe 4-Hour Chart Looking at the 4-hour chart, the
Topics:
CryptoVizArt considers the following as important: Bitcoin (BTC) Price, BTC Analysis, BTCEUR, BTCGBP, btcusd, btcusdt
This could be interesting, too:
Chayanika Deka writes XRP, SOL, and ADA Inclusion in US Crypto Reserve Pushes Traders on Edge
Chayanika Deka writes Why Arthur Hayes Is Bullish on Bitcoin Under Trump’s Economic Strategy
Mandy Williams writes Why the Bitcoin Market Is Stuck—and the Key Metric That Could Change It: CryptoQuant CEO
Wayne Jones writes Metaplanet Acquires 156 BTC, Bringing Total Holdings to 2,391
Bitcoin’s price is currently testing a key area, and its reaction could determine the mid-term price action of the market. Therefore, it would be beneficial to analyze the possible scenarios thoroughly.
Technical Analysis
By Edris
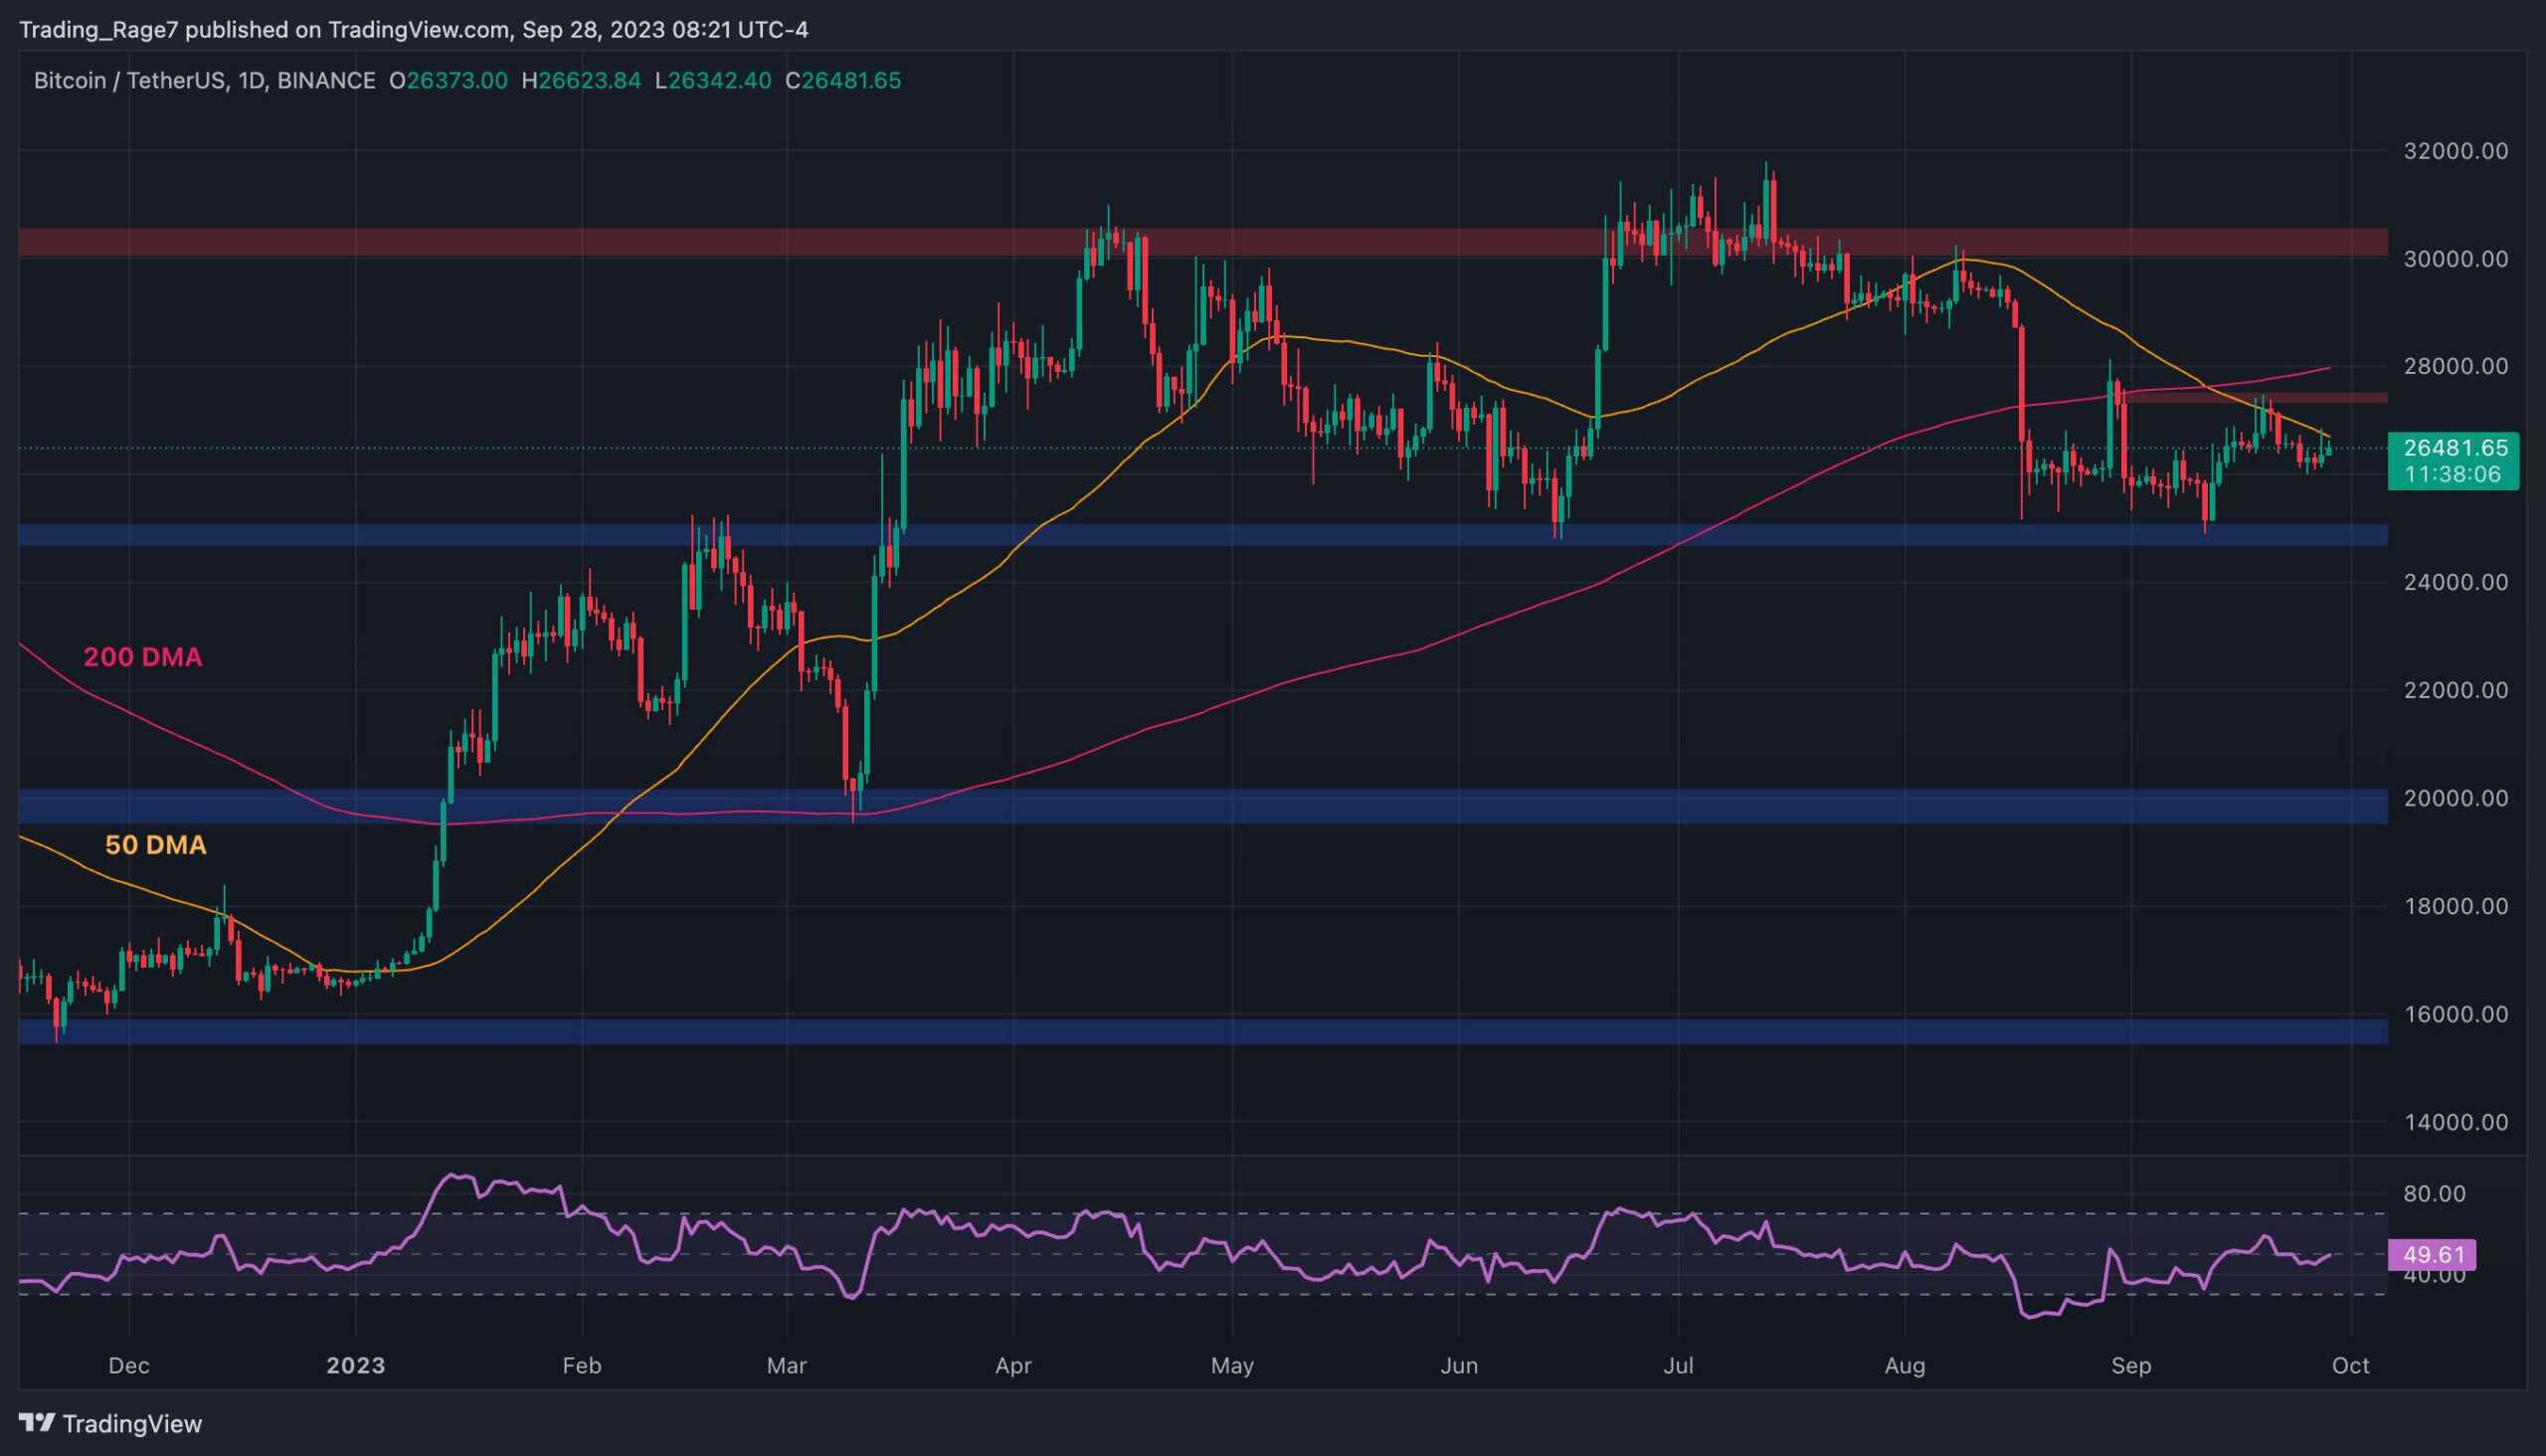
The Daily Chart
On the daily timeframe, the price has been testing the 50-day moving average, located around the $26,500 level, over the last few days. In the event of a bullish breakout, Bitcoin is likely to move towards the $27,500 resistance level and even the 200-day moving average located around the $28K area.
On the other hand, a bearish rejection could lead to a drop to the $25K level and potentially lower, which would be disastrous as the market would likely crash again.
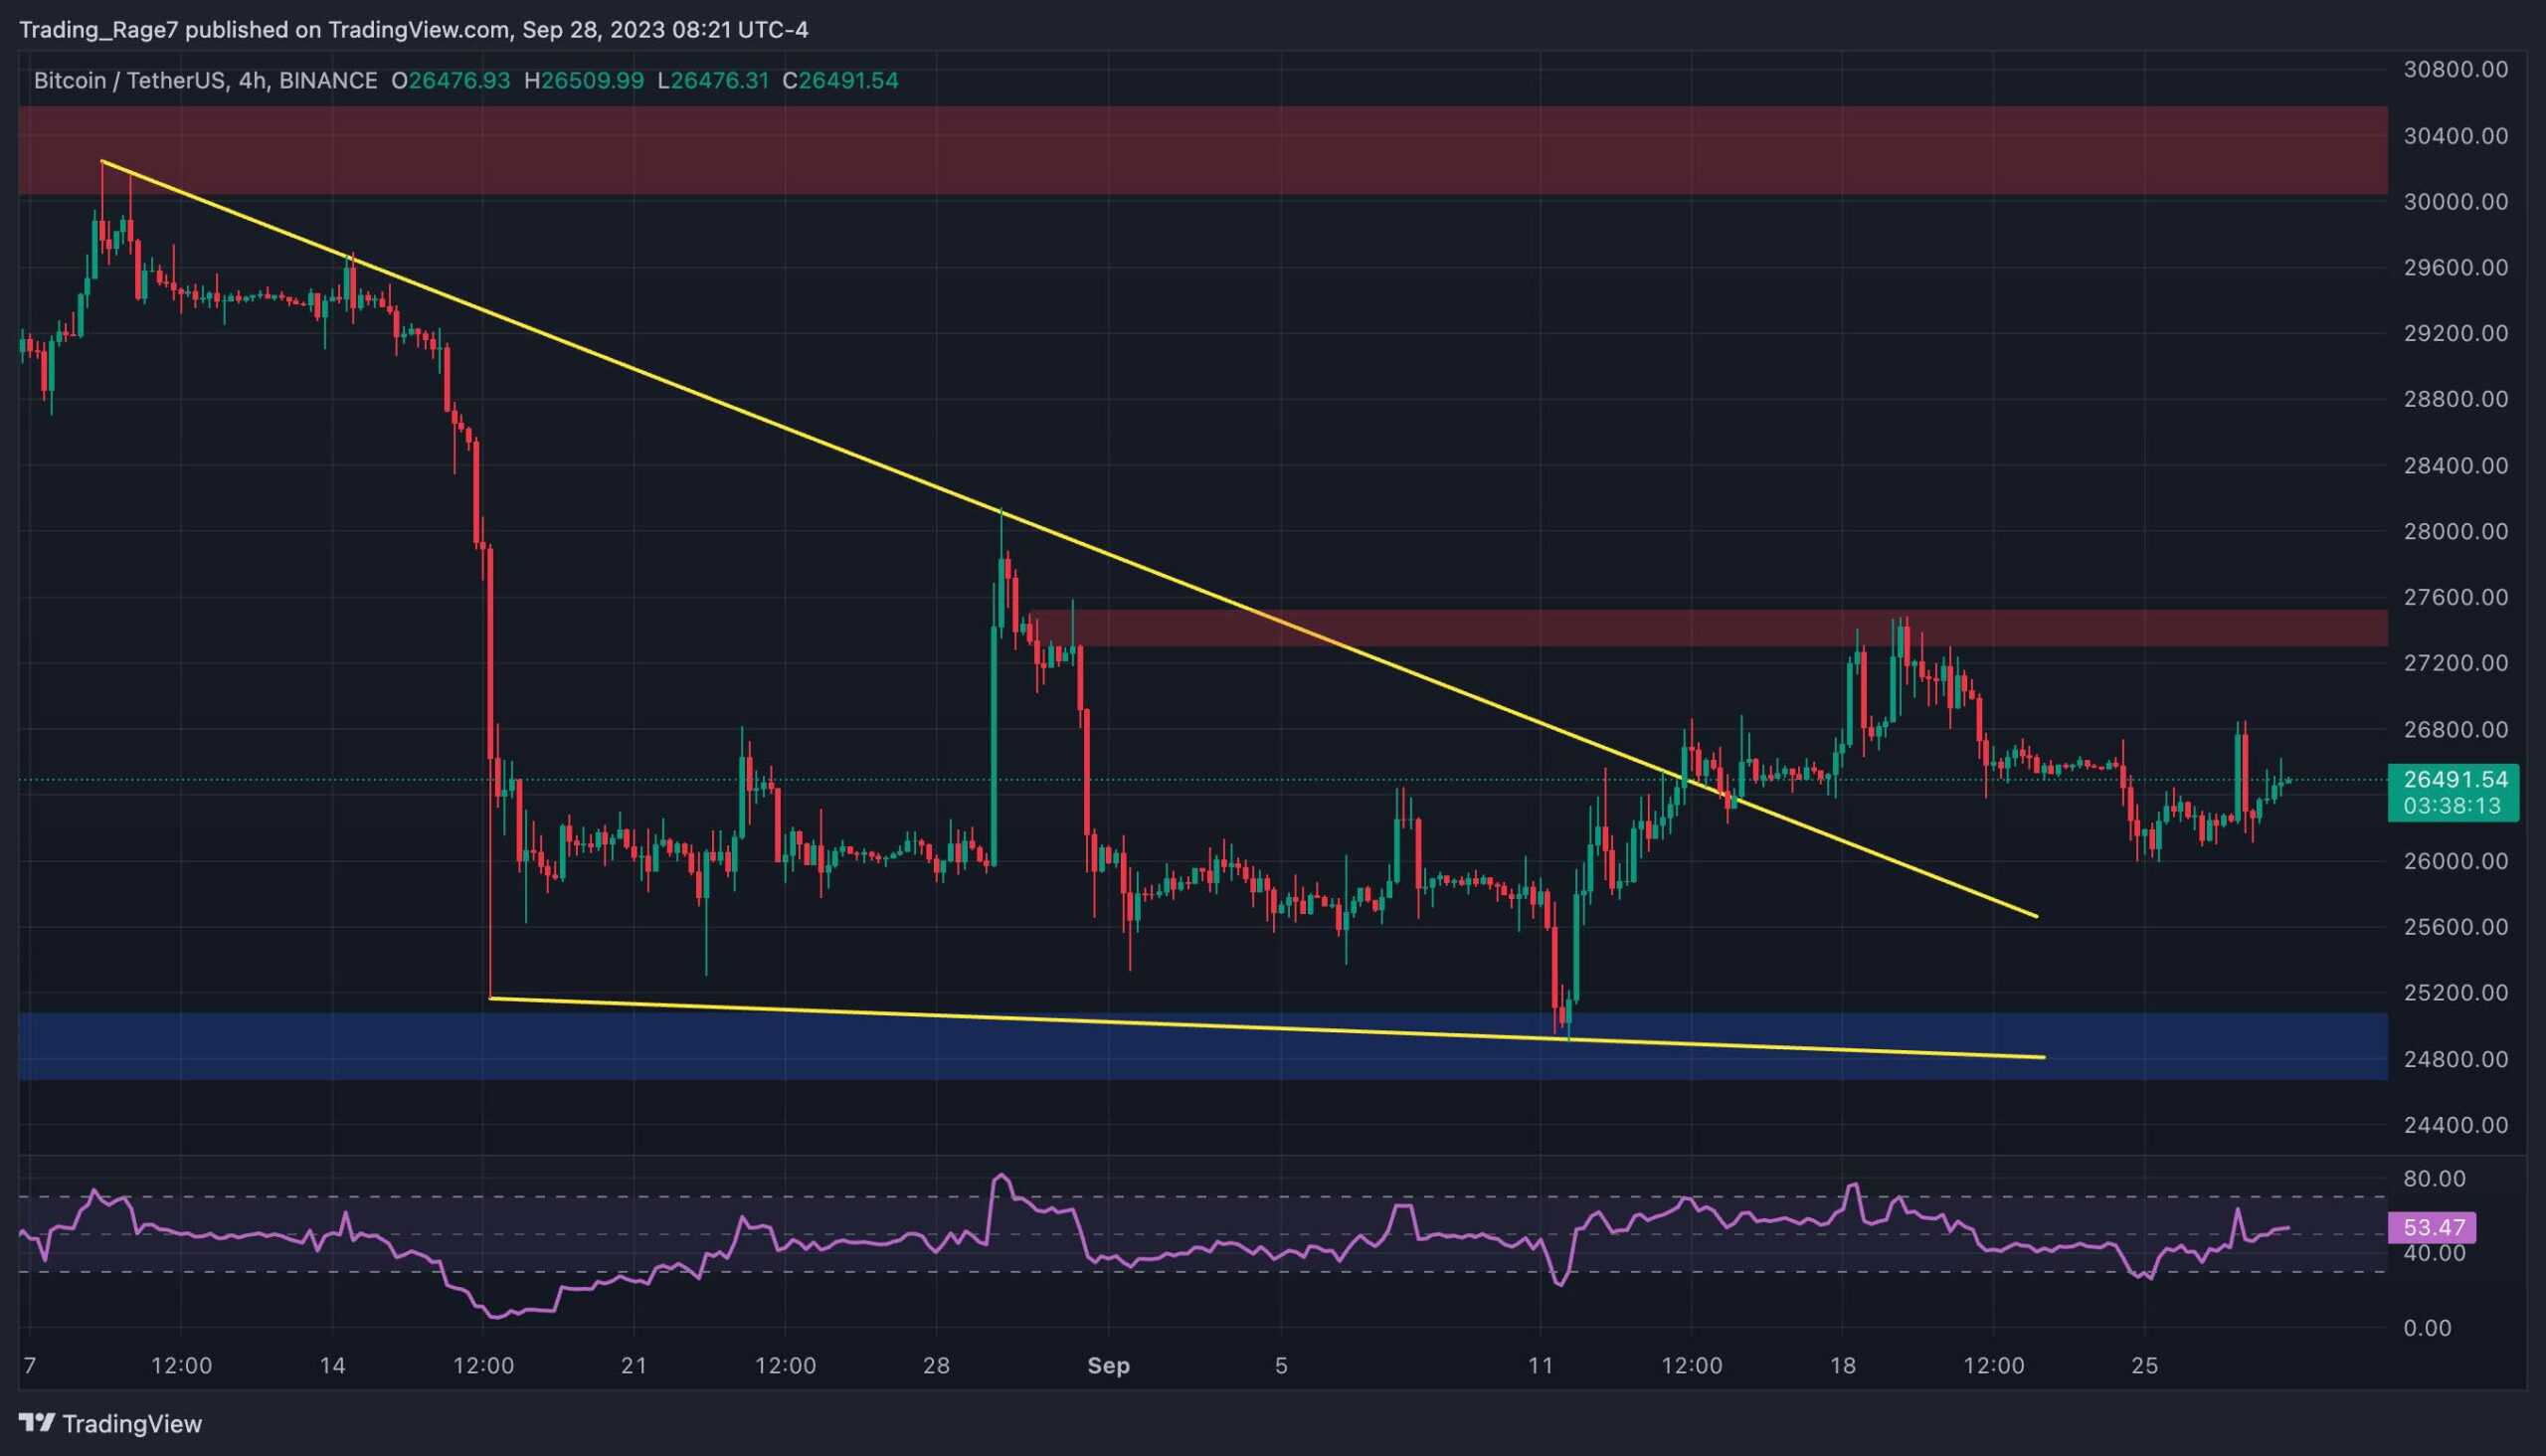
The 4-Hour Chart
Looking at the 4-hour chart, the price has recently broken out of the large falling wedge pattern. This is considered a bullish reversal signal from a classical price action point of view. However, the market has failed to break above the $27,500 zone and has been decisively rejected.
The first probable scenario is for BTC to test the mentioned $27,500 resistance level again and break it to the upside, which would pave the way for a rally to the key $30K area. On the contrary, a drop below the $25K support area is also conceivable and would result in a bearish continuation towards the $20K support level.
On-Chain Analysis
By Edris
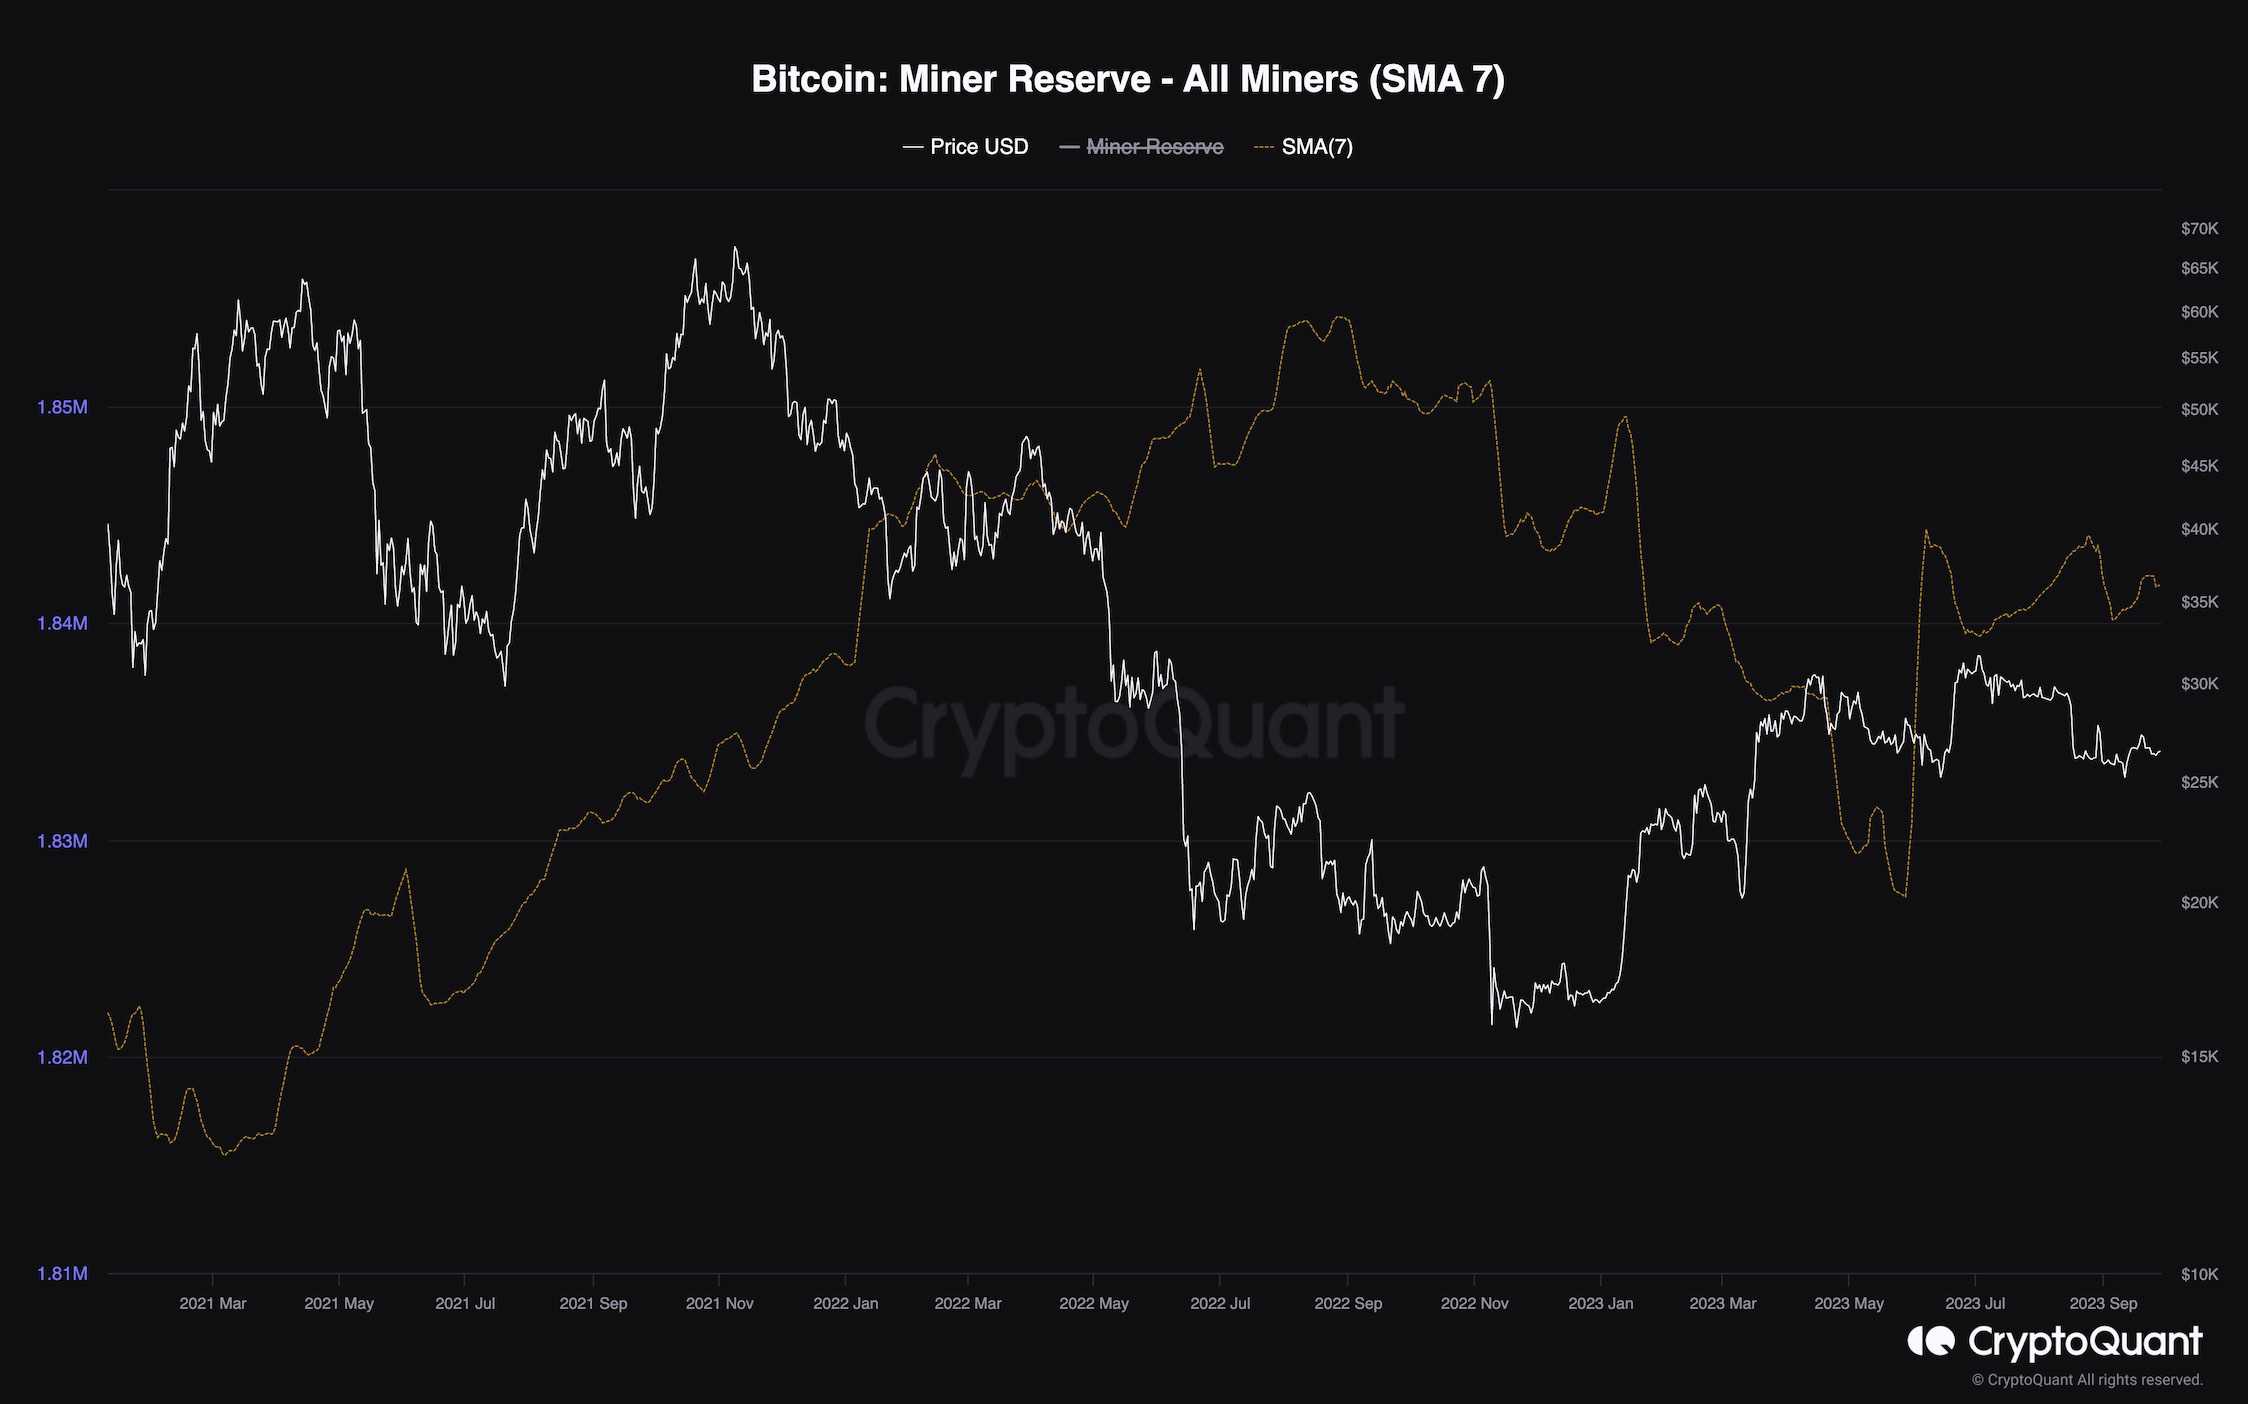
While Bitcoin’s price has been consolidating between the $25K and $30K levels over the past few months, some interesting developments are going on in the background. The miners are seemingly optimistic about the near future.
Miners are arguably the most important entities in the Bitcoin space, as they provide the network with security while also possessing large amounts of BTC. Therefore, they can significantly impact the price with their behavior.
This chart demonstrates the miner reserve metric, which measures the amount of BTC held on miner wallets. It is evident that during the recent range-bound price action, the miners have stopped selling and are once again accumulating Bitcoin. This pattern can be very positive for the price, as it would greatly reduce supply, leading to a potential increase in value.