The instability of Circle’s USDC has caused extreme fear in the market, as stablecoins play a crucial role in the cryptocurrency industry. Bitcoin’s price was affected by the recent turmoil and has declined, but it faces a strong support level. By Shayan The Daily Chart Recently, the price of Bitcoin experienced a downtrend with noticeable bearish momentum after forming a reversal three-drives pattern and breaking down the neckline. The recent turmoil with USDC served as a catalyst for the bearish trend and pushed the price down toward the K level. However, the price faces significant support at the 200-day moving average, approximately at .6K, and is attempting to surpass it. This moving average is a powerful support level, and the bears might find it difficult to
Topics:
CryptoVizArt considers the following as important: Bitcoin (BTC) Price, BTC Analysis, BTCEUR, BTCGBP, btcusd, btcusdt
This could be interesting, too:
Chayanika Deka writes XRP, SOL, and ADA Inclusion in US Crypto Reserve Pushes Traders on Edge
Chayanika Deka writes Why Arthur Hayes Is Bullish on Bitcoin Under Trump’s Economic Strategy
Mandy Williams writes Why the Bitcoin Market Is Stuck—and the Key Metric That Could Change It: CryptoQuant CEO
Wayne Jones writes Metaplanet Acquires 156 BTC, Bringing Total Holdings to 2,391
The instability of Circle’s USDC has caused extreme fear in the market, as stablecoins play a crucial role in the cryptocurrency industry. Bitcoin’s price was affected by the recent turmoil and has declined, but it faces a strong support level.
By Shayan
The Daily Chart
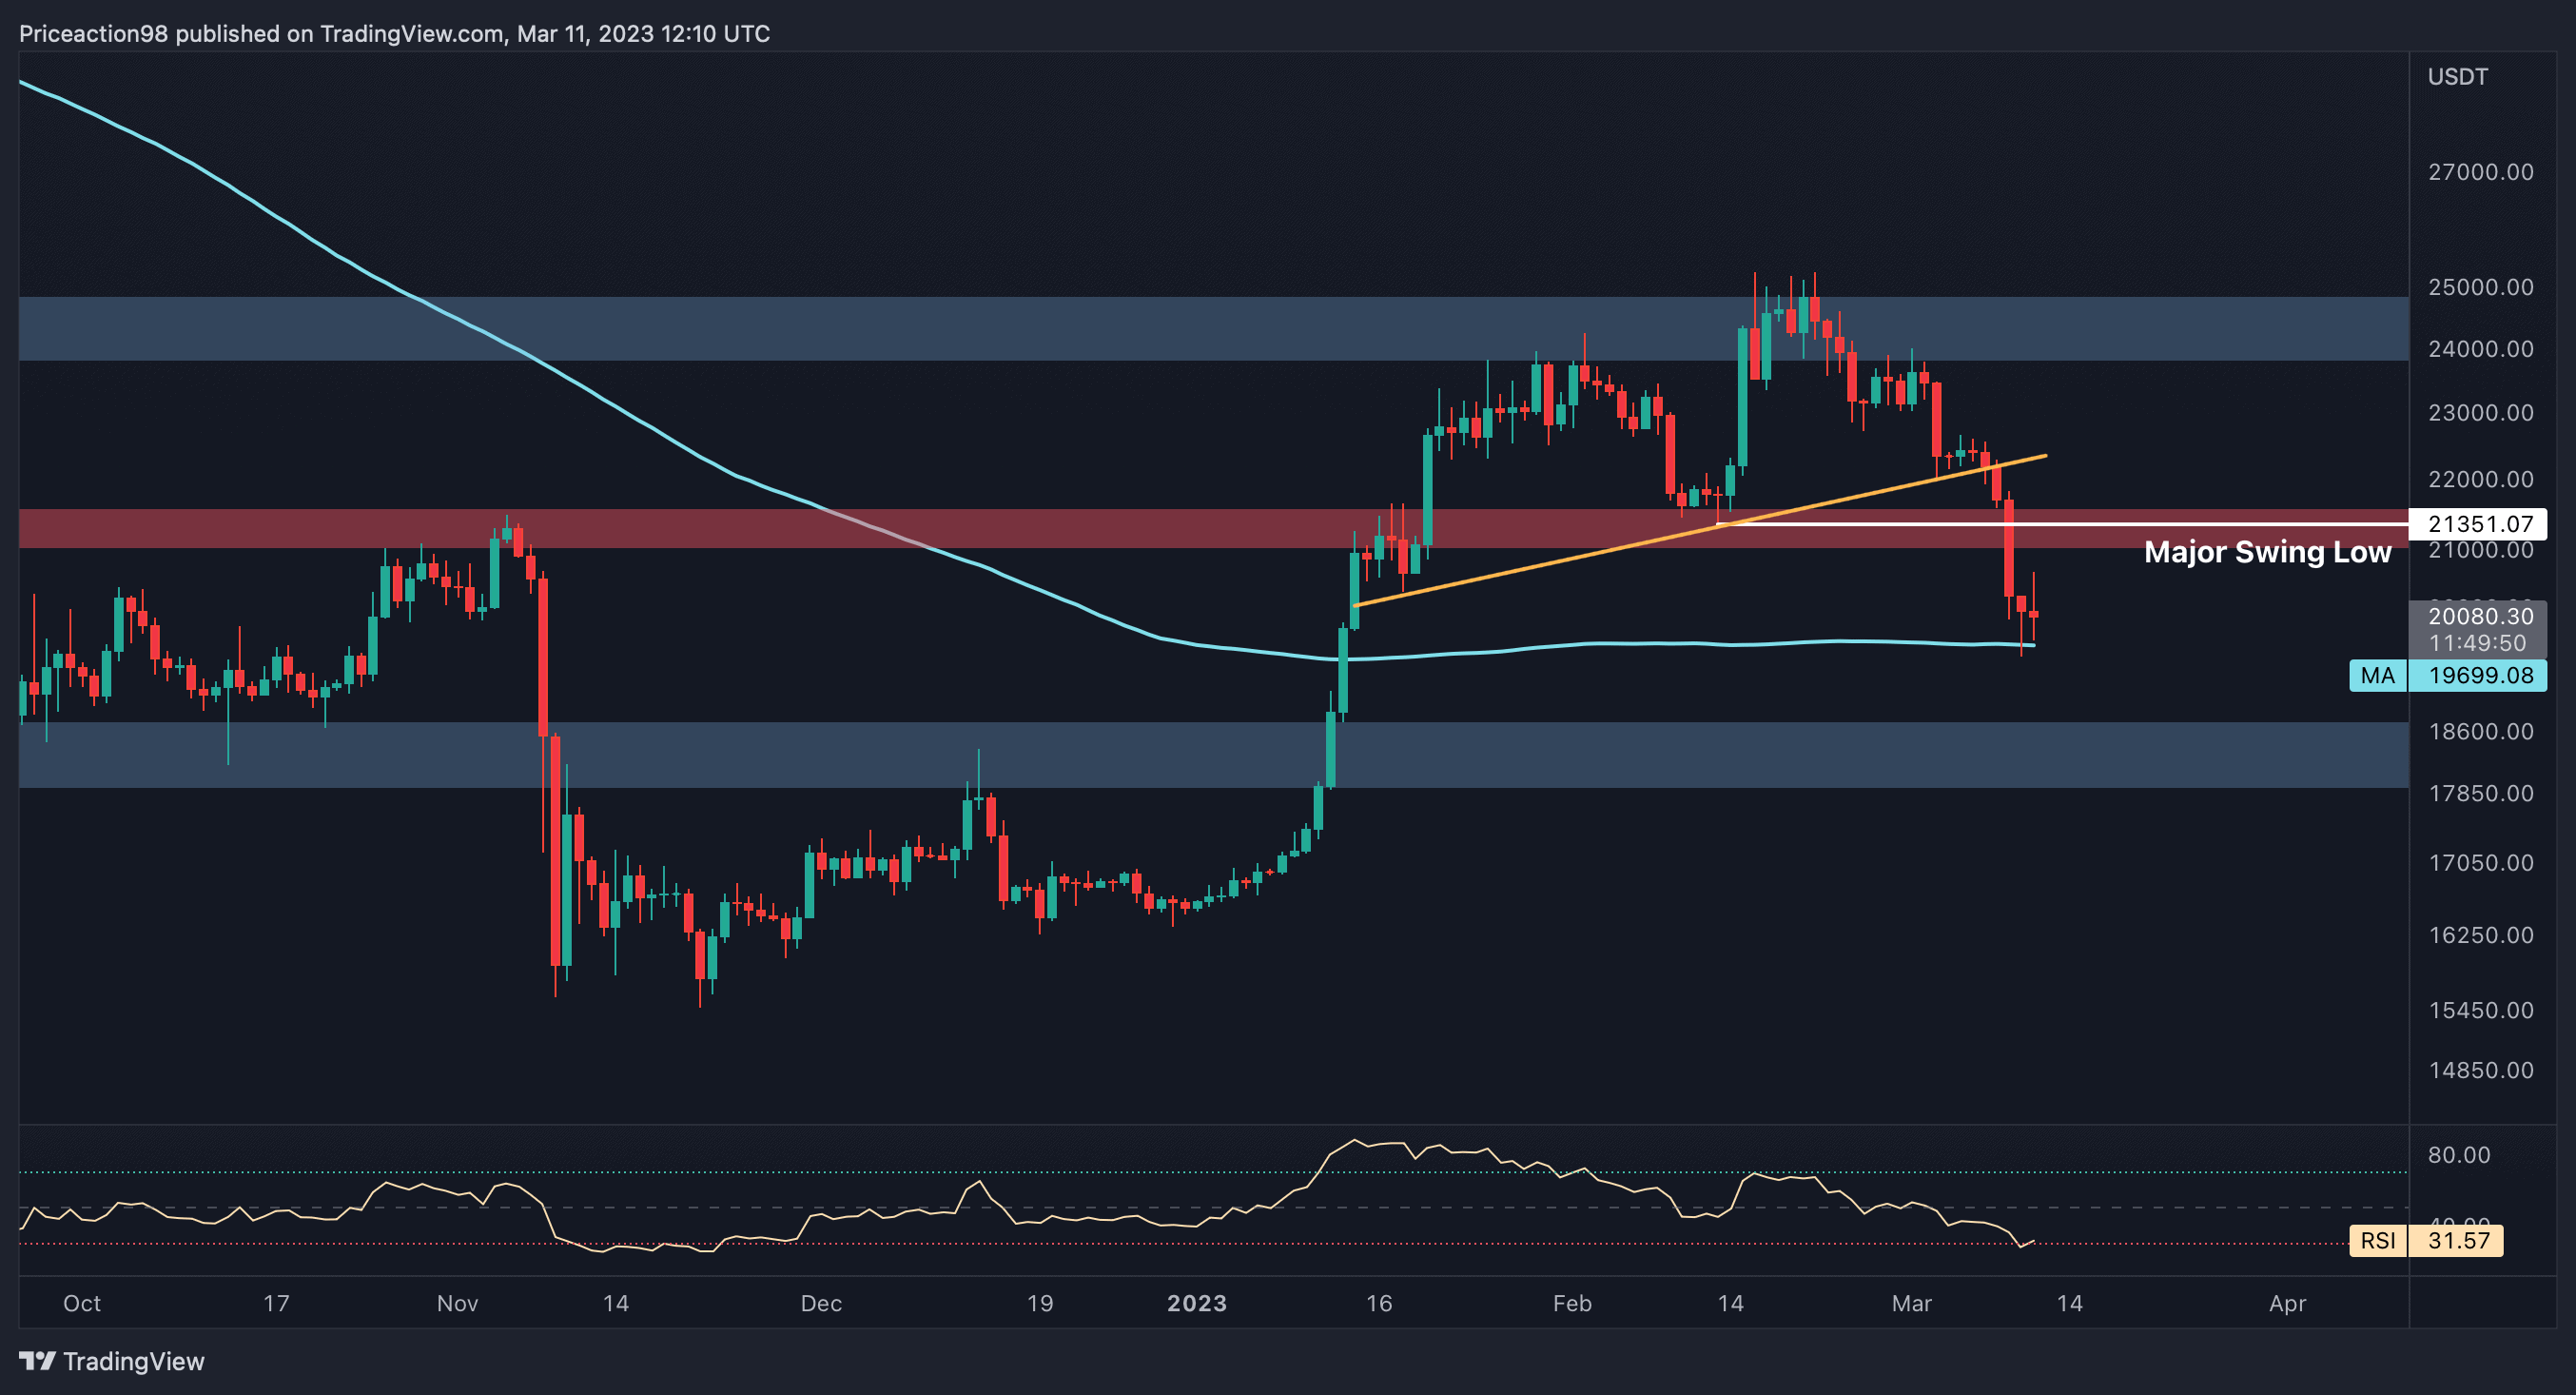
Recently, the price of Bitcoin experienced a downtrend with noticeable bearish momentum after forming a reversal three-drives pattern and breaking down the neckline. The recent turmoil with USDC served as a catalyst for the bearish trend and pushed the price down toward the $19K level.
However, the price faces significant support at the 200-day moving average, approximately at $19.6K, and is attempting to surpass it. This moving average is a powerful support level, and the bears might find it difficult to push the price below it.
Despite this, the daily timeframe suggests that bearish momentum has weakened, and a short-term consolidation stage may occur before the next impulsive move.
The 4-Hour Chart
The price of Bitcoin has experienced a massive decline after breaking the critical support level of $22K, resulting in consecutive big red candles. However, every impulsive trend requires a cool-down phase, along with a correction.
Bitcoin appears to have entered the mid-trend correction stage after reaching a decisive price level at $20K. This level also serves as sentimental support. Additionally, the 61.8 level of the Fibonacci retracement for the recent bullish trend aligns with the $20K level of support, making it a substantial level.
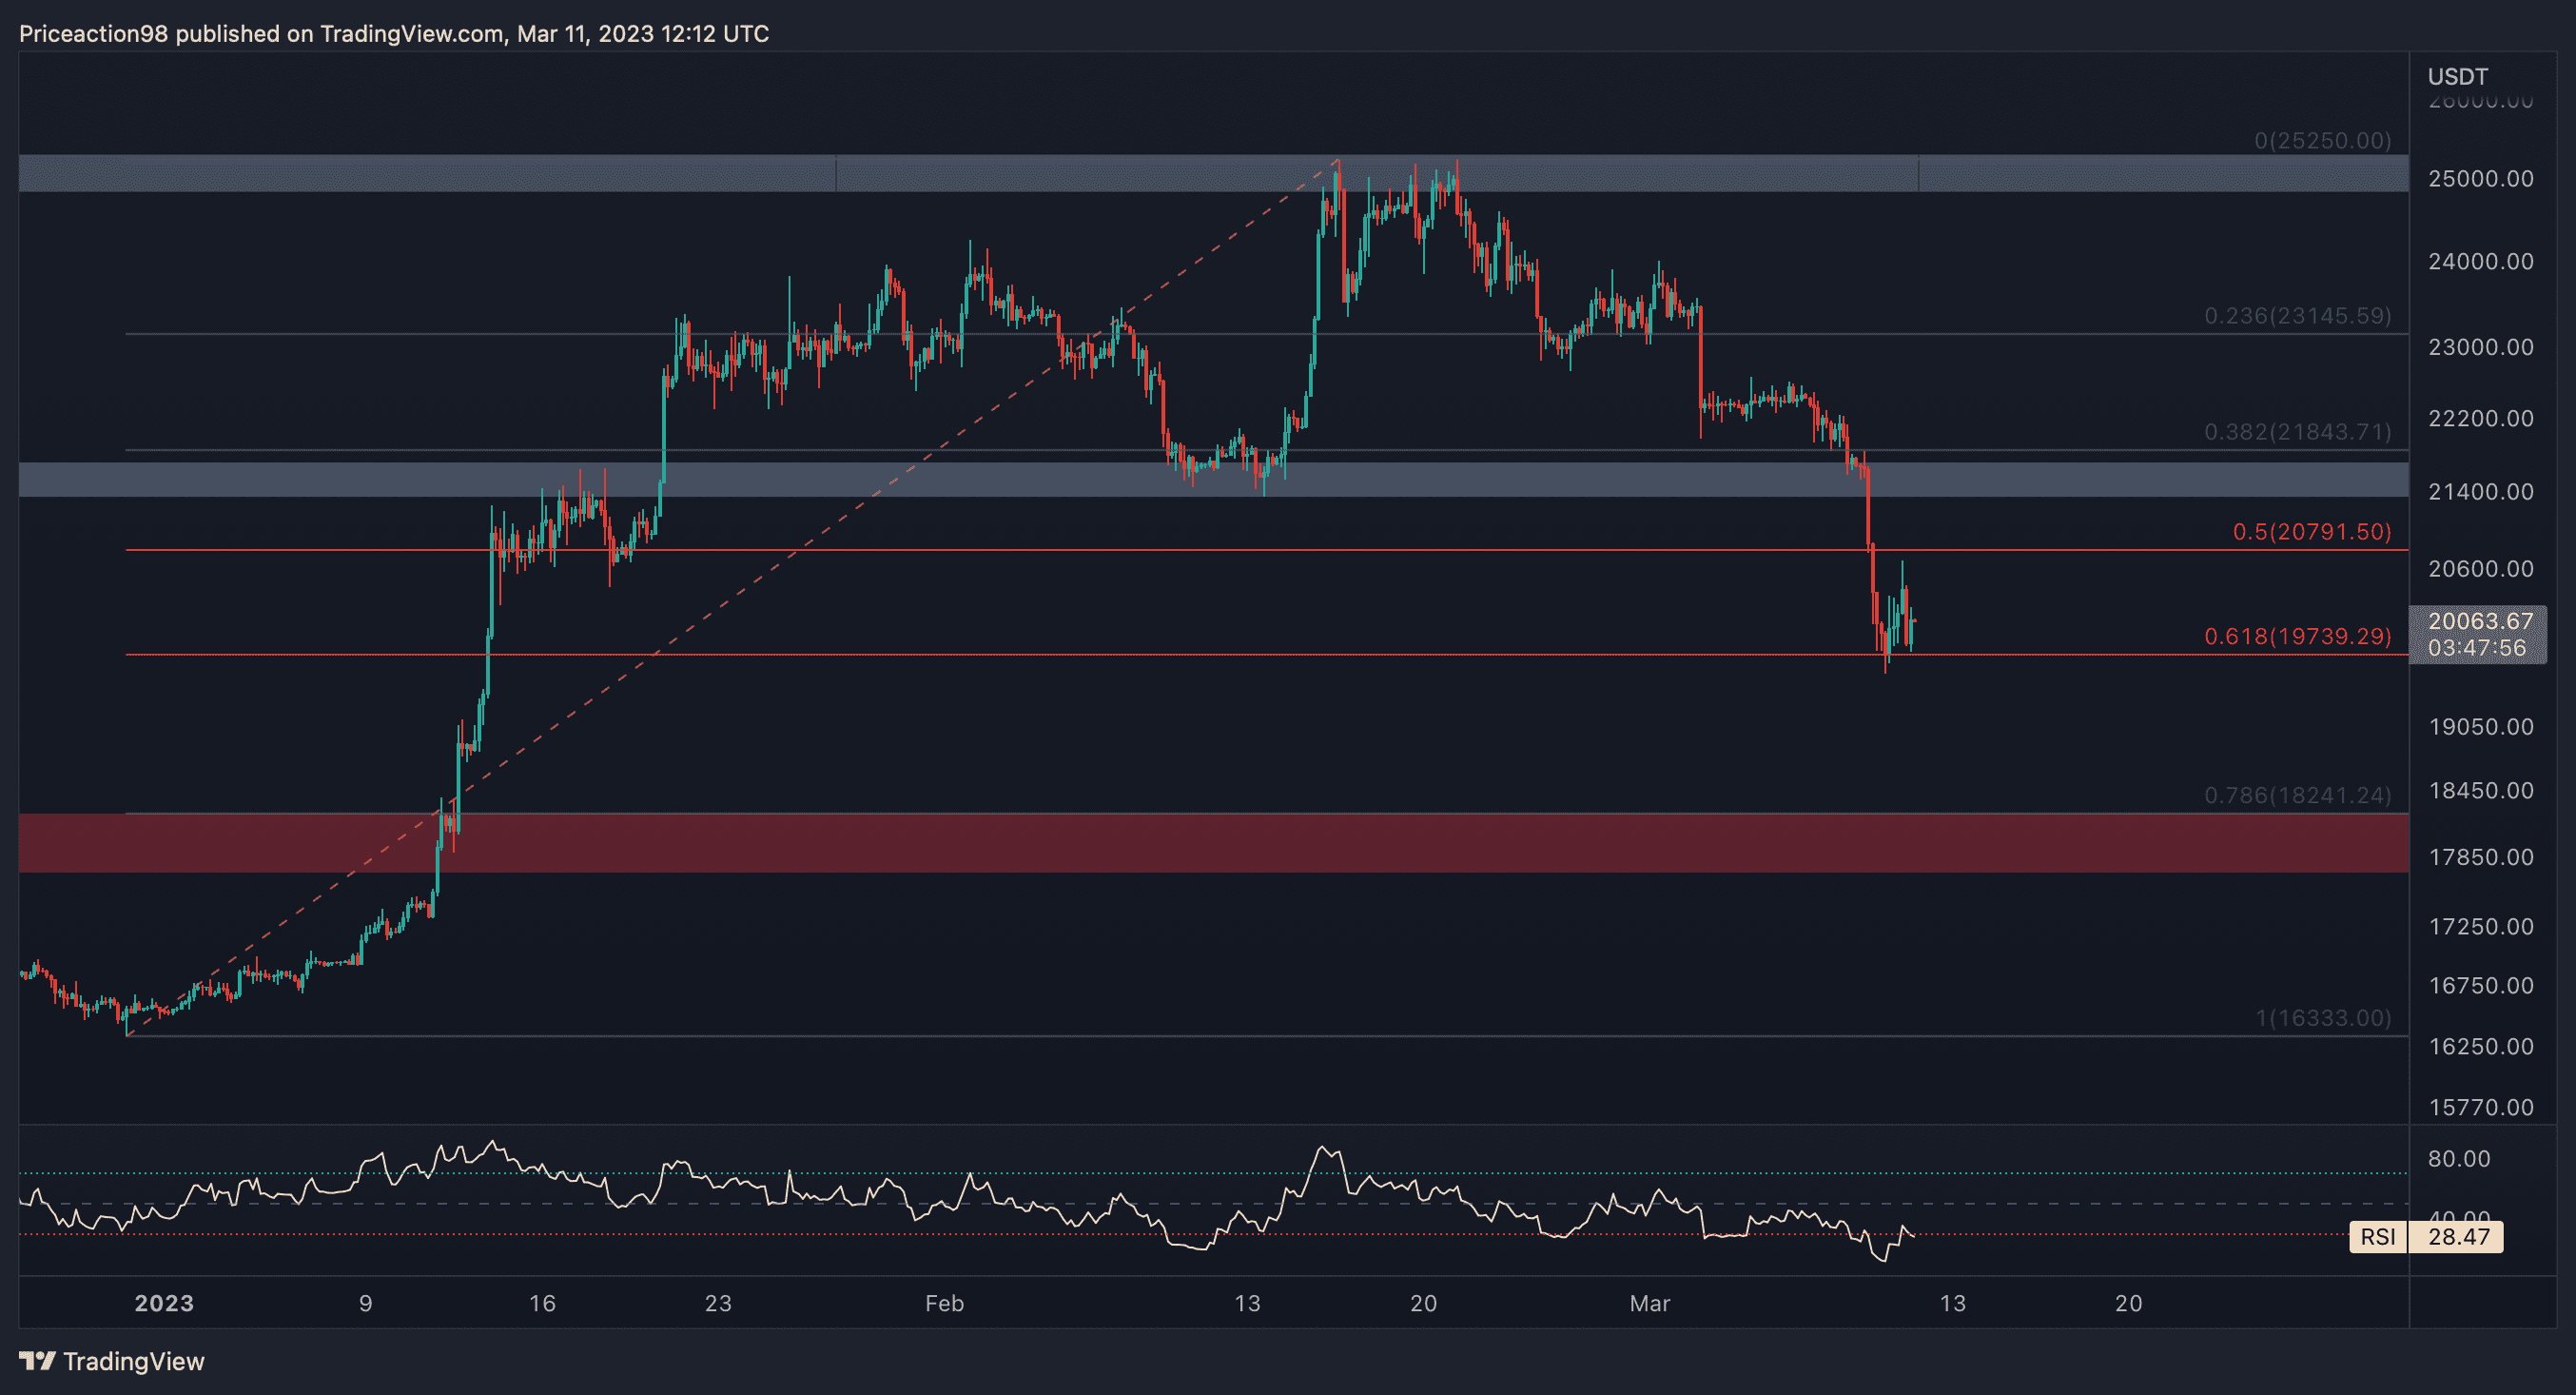
Therefore, the price may consolidate in the current region, forming a correction pattern before trending lower.
By Shayan
The cryptocurrency market has once again entered a stage of fear and uncertainty due to the recent turmoil with Circle and the failure of SVB bank. As a result, market participants have capitulated and rapidly sold their assets to manage their risks.
The Funding Rates metric provides insight into traders’ sentiment and has recently declined impulsively, coinciding with a shakeout in Bitcoin’s price. Traders must be careful and monitor the perpetual market closely in case of another sudden price move.
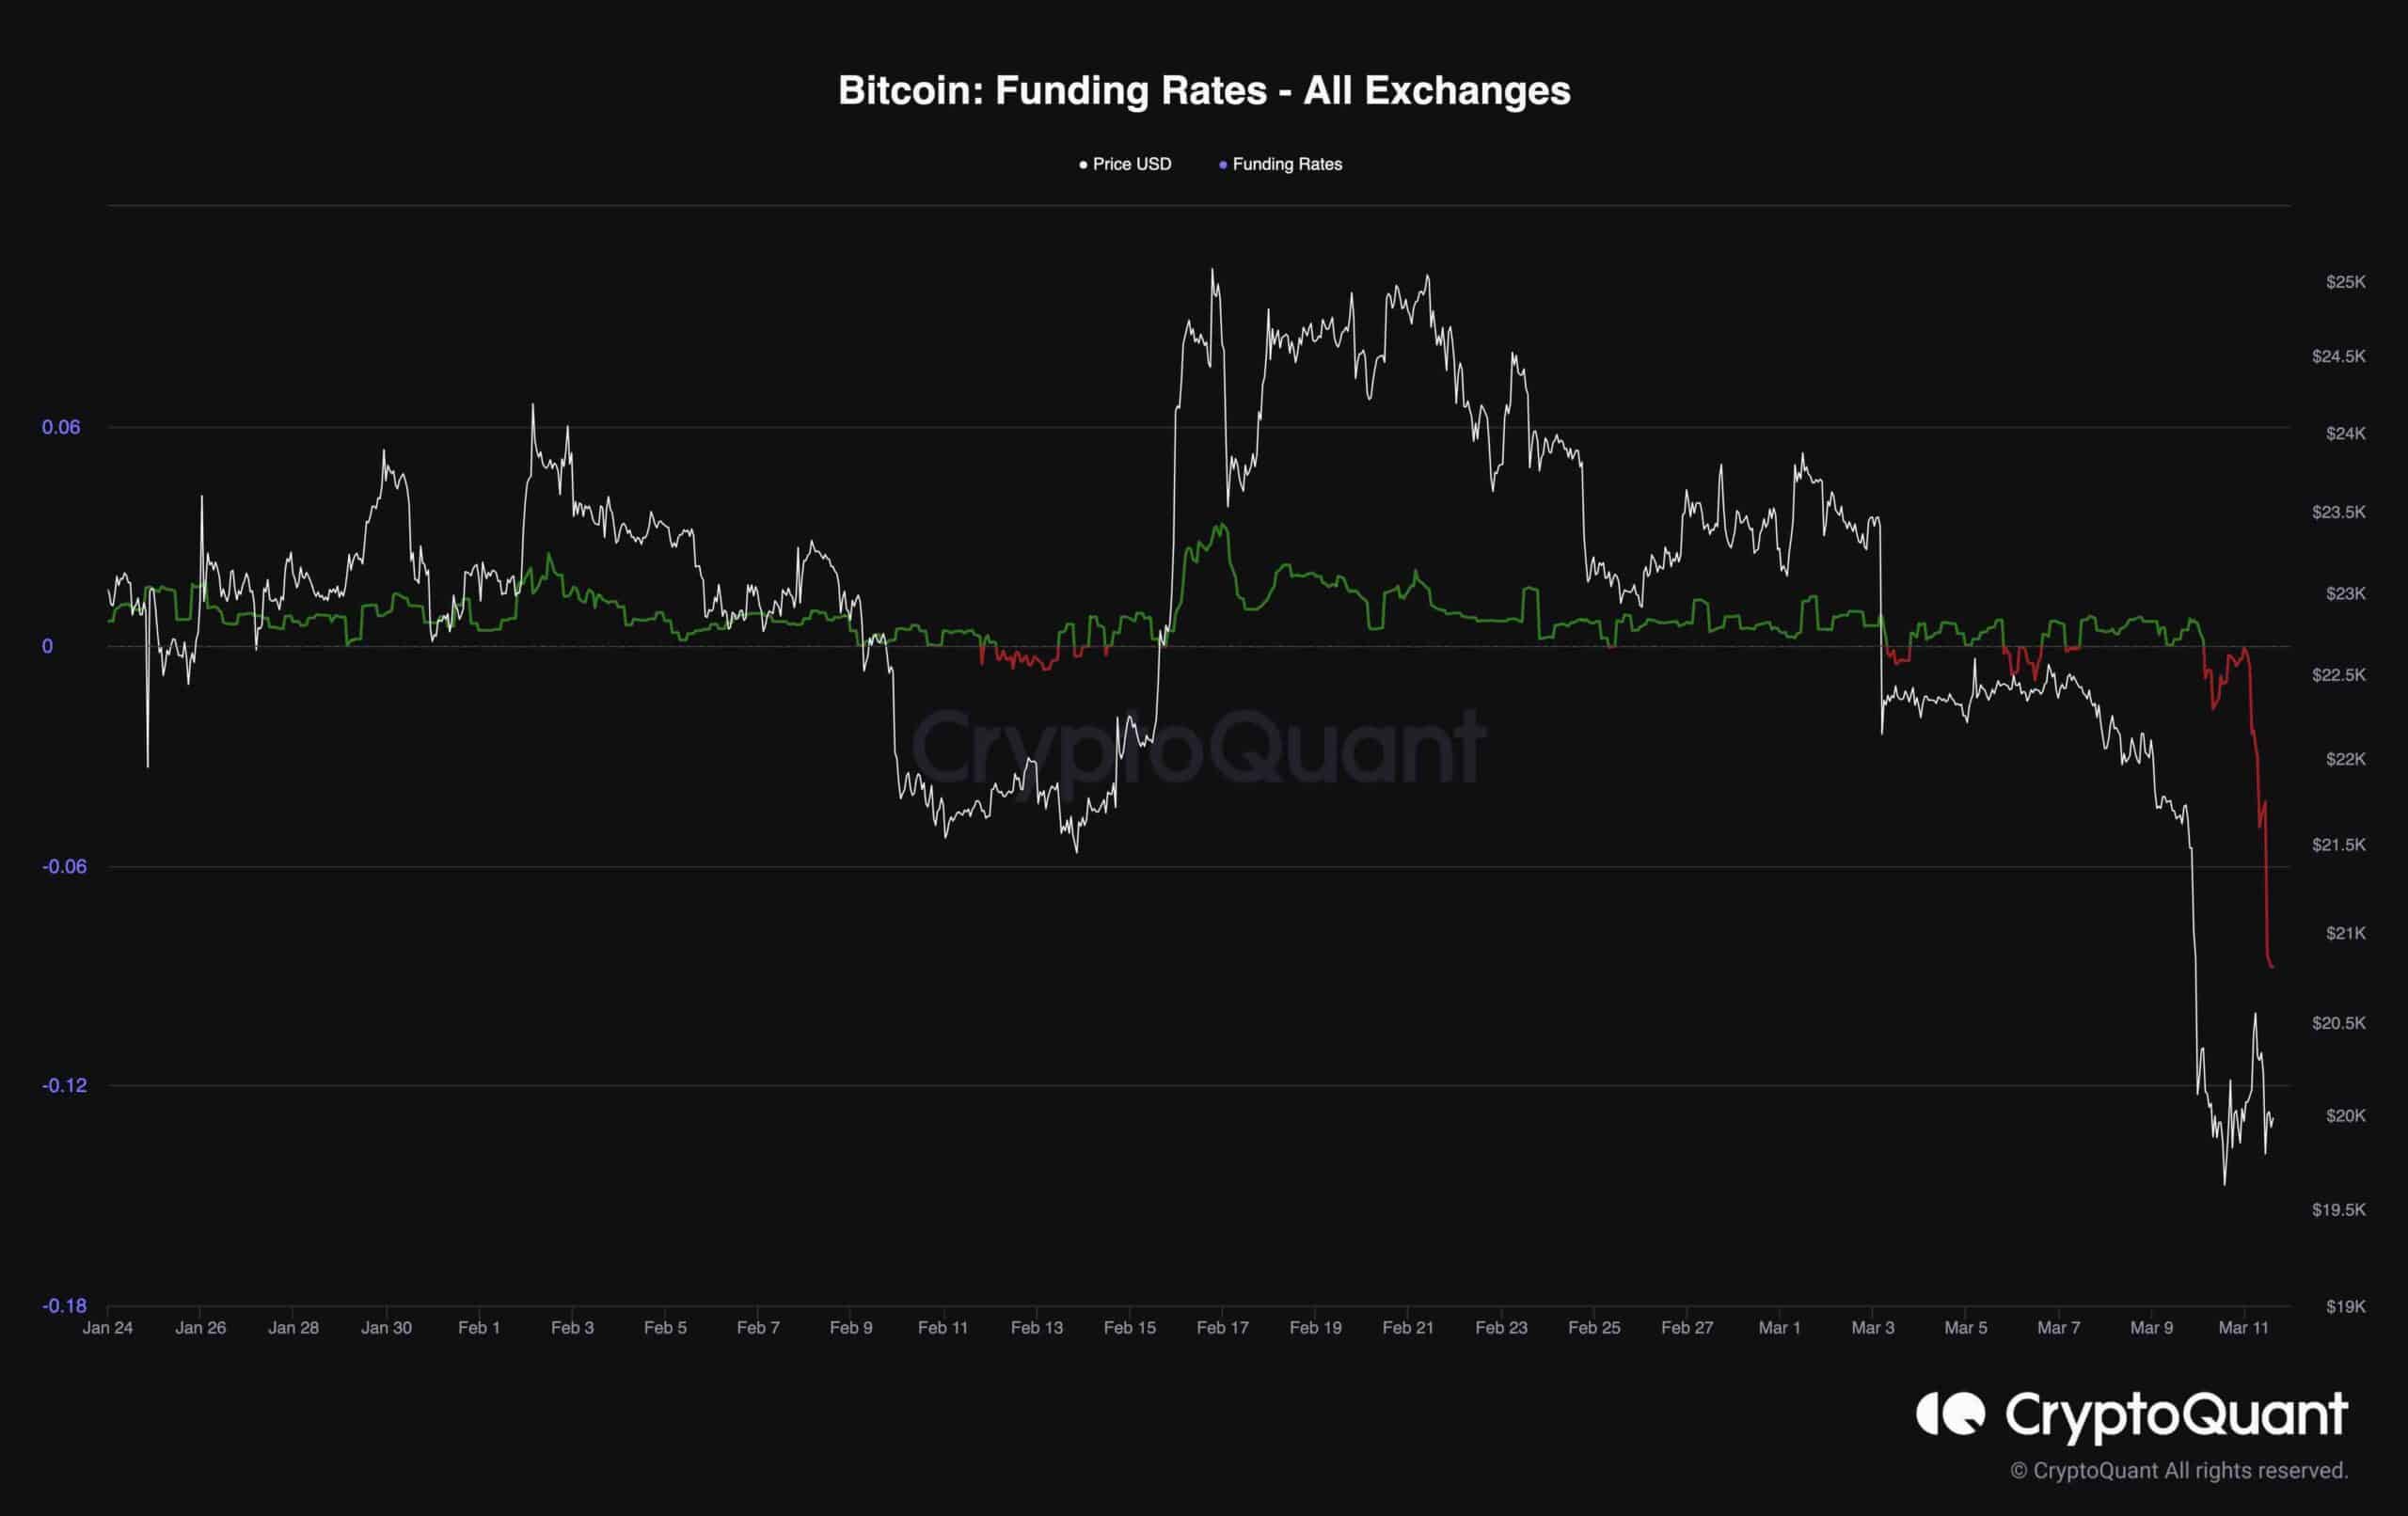
Despite this, the market may become highly volatile with no specific direction in the upcoming days.