Bitcoin’s price movement has remained stagnant after being rejected from the critical resistance zone at ,000. However, it is currently consolidating near a pivotal support area, which includes both the 100-day moving average and the lower boundary of a multi-month ascending channel. Technical Analysis By Shayan The Daily Chart The daily chart analysis shows that the price entered a slight corrective phase at the beginning of July, marked by diminished volatility and subdued price fluctuations. Nevertheless, BTC is gradually approaching a substantial support range comprising the 100-day moving average, positioned at ,544, and the lower threshold of the ascending channel, situated at around ,500. This particular price range holds significant importance as robust
Topics:
CryptoVizArt considers the following as important: Bitcoin (BTC) Price, BTC Analysis, BTCEUR, BTCGBP, btcusd, btcusdt
This could be interesting, too:
Chayanika Deka writes XRP, SOL, and ADA Inclusion in US Crypto Reserve Pushes Traders on Edge
Chayanika Deka writes Why Arthur Hayes Is Bullish on Bitcoin Under Trump’s Economic Strategy
Mandy Williams writes Why the Bitcoin Market Is Stuck—and the Key Metric That Could Change It: CryptoQuant CEO
Wayne Jones writes Metaplanet Acquires 156 BTC, Bringing Total Holdings to 2,391
Bitcoin’s price movement has remained stagnant after being rejected from the critical resistance zone at $30,000. However, it is currently consolidating near a pivotal support area, which includes both the 100-day moving average and the lower boundary of a multi-month ascending channel.
Technical Analysis
By Shayan
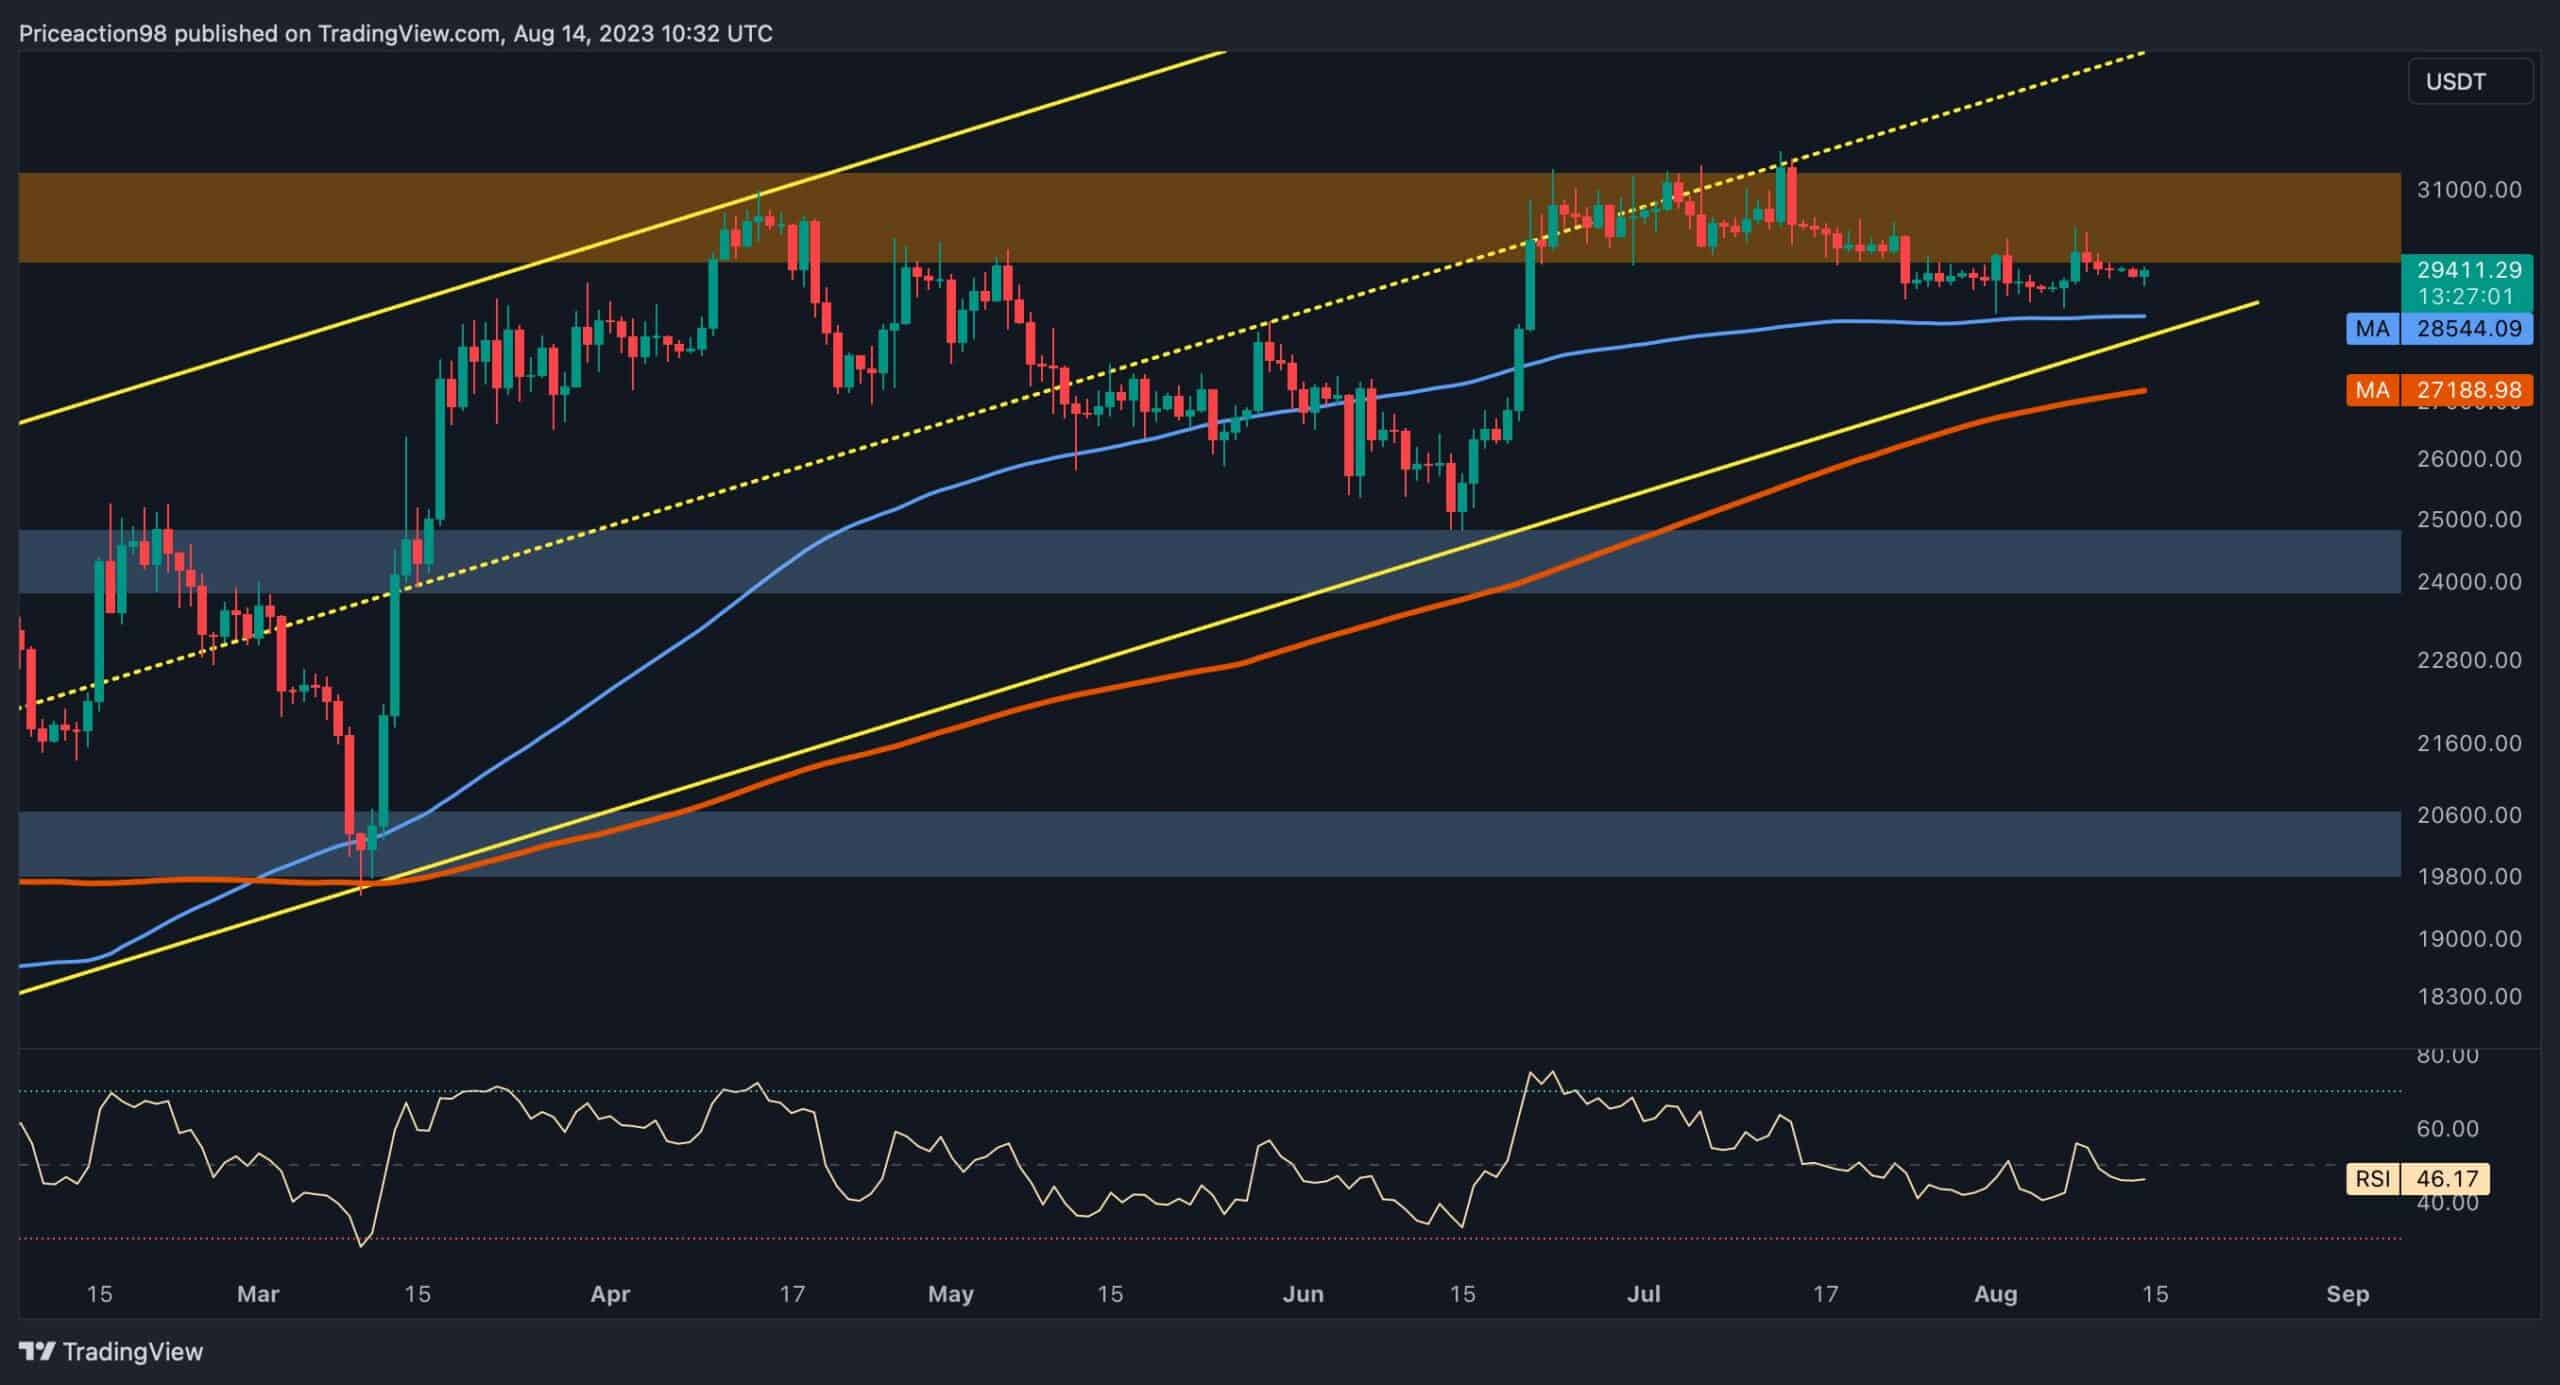
The Daily Chart
The daily chart analysis shows that the price entered a slight corrective phase at the beginning of July, marked by diminished volatility and subdued price fluctuations.
Nevertheless, BTC is gradually approaching a substantial support range comprising the 100-day moving average, positioned at $28,544, and the lower threshold of the ascending channel, situated at around $28,500. This particular price range holds significant importance as robust support that could potentially prevent additional declines.
However, the current price action within this pivotal support area suggests the prevalence of market indecision, evident from the formation of small and directionless candles. Consequently, if the price receives support and witnesses strengthened buying pressure, market participants could anticipate a decisive reversal in price.
Conversely, in the absence of such support, the price might breach the mentioned support levels, subsequently triggering a cascade effect toward the noteworthy support zone at $25,000.
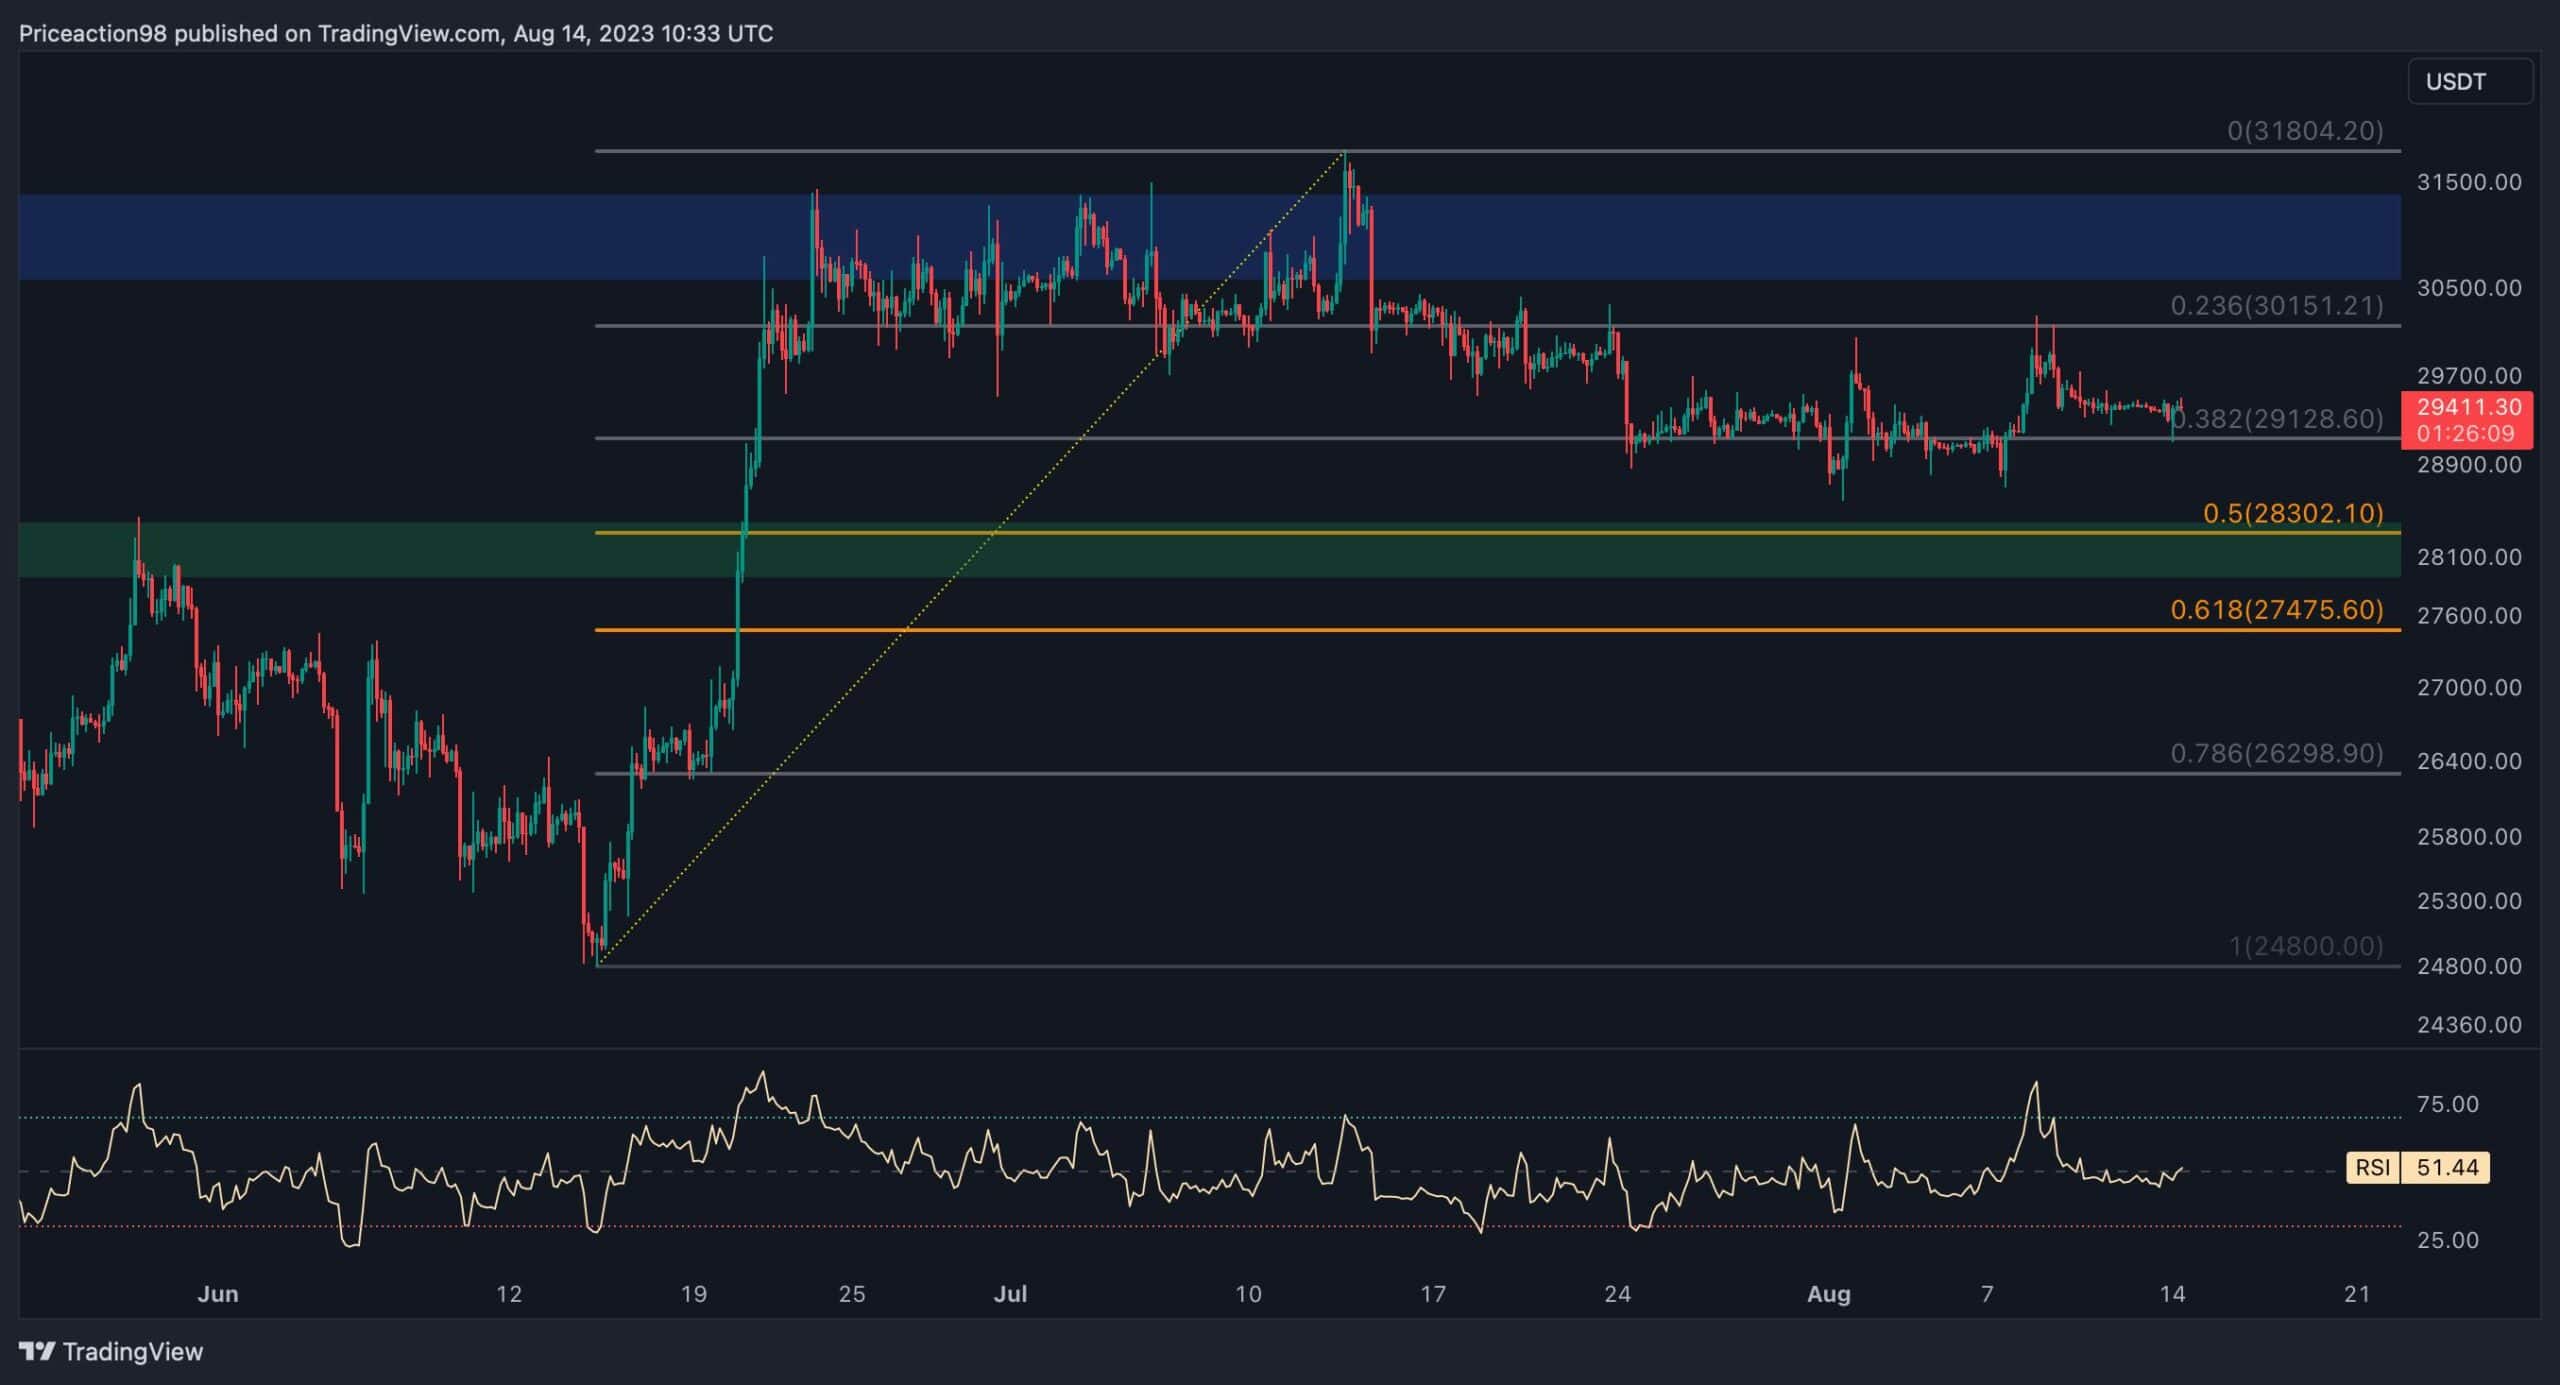
The 4-Hour Chart
On the 4-hour chart, it is observable that the price appears to be constrained within a static range, oscillating between the resistance at $30,000 and the minor support at $28,000. At present, Bitcoin is consolidating close to the critical 0.5 Fibonacci retracement level, displaying efforts to avoid a downward breach.
Considering the likelihood of the price undergoing a temporary corrective phase, it is reasonable to regard the price range marked by the 0.5 and 0.618 Fibonacci retracement levels as the most probable target for this movement. Therefore, a positive response within this defined range could potentially pave the way for a fresh upward trend, propelling the price toward the significant resistance level at $30,000.
However, in the event that the price breaks below the range outlined by the 0.5 and 0.618 Fibonacci levels, it may provoke an impulsive plunge toward the support region around the $25K mark.
Sentiment Analysis
By: Edris
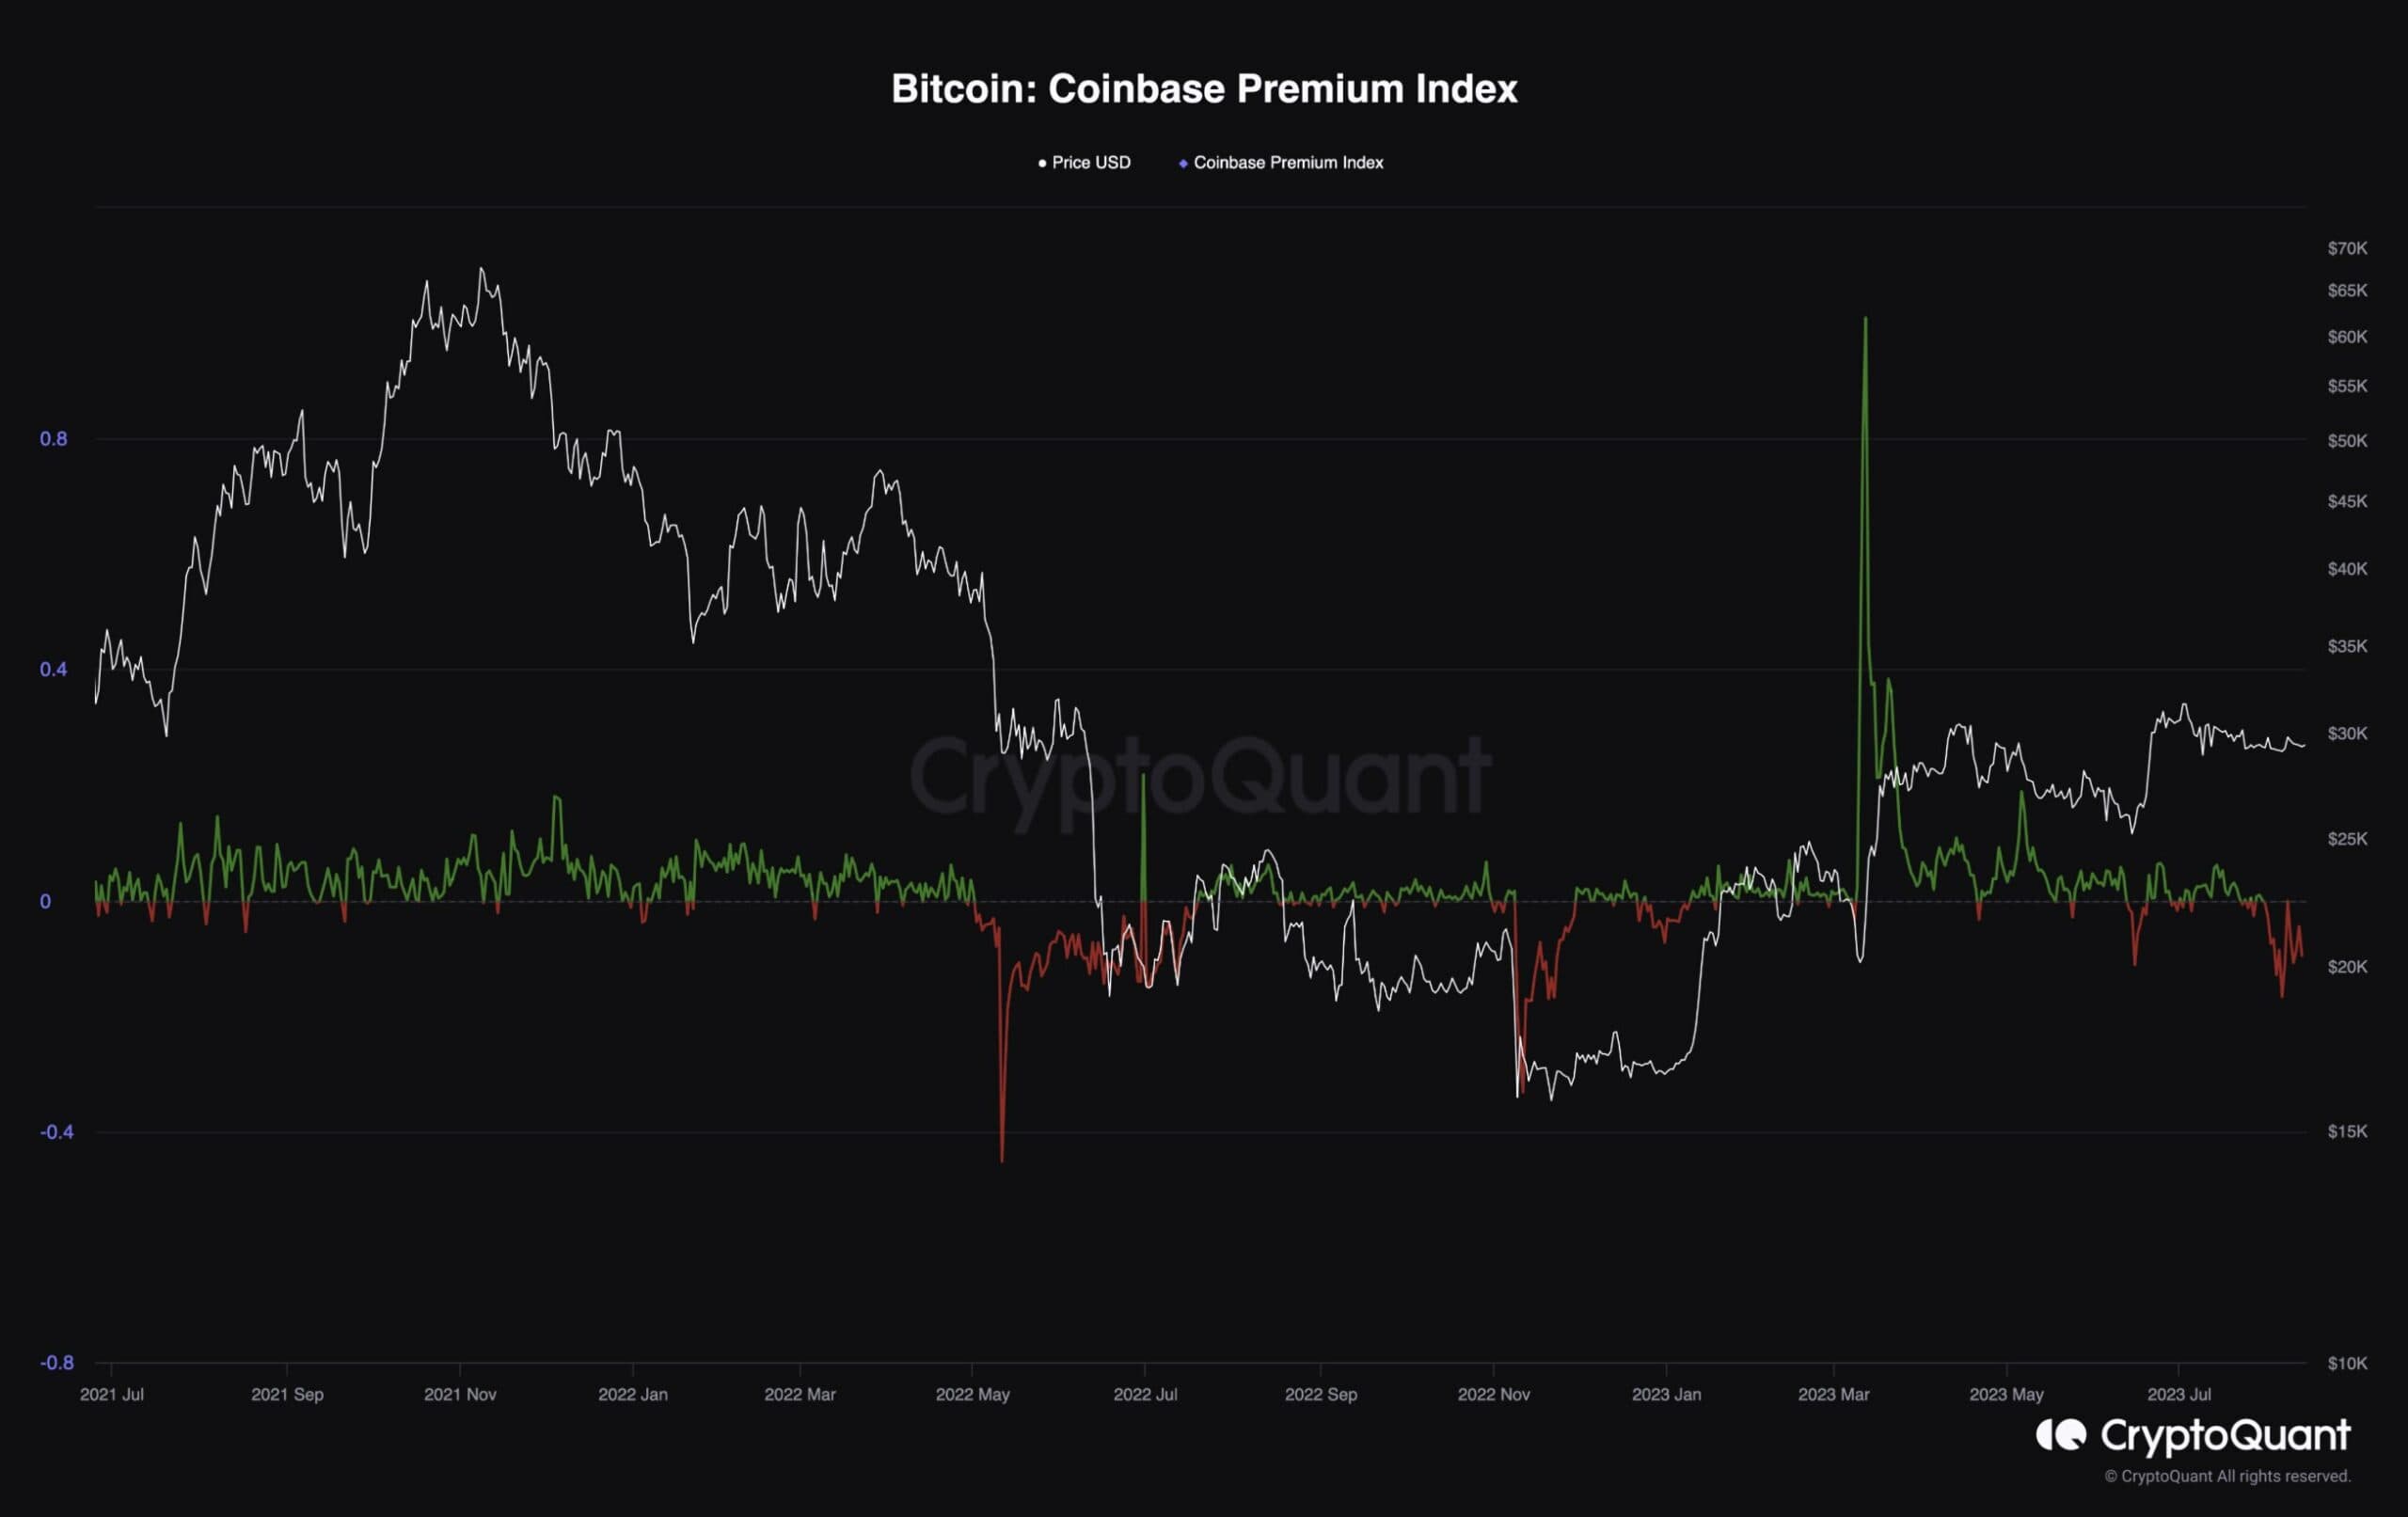
Bitcoin Coinbase Premium Index
Although Bitcoin’s price has remained relatively stable, there are significant developments taking place behind the scenes. The Bitcoin Coinbase premium index measures the percentage difference between Coinbase Pro price (USD pair) and Binance price(USDT pair). Positive premium values indicate stronger buying pressure by US investors in Coinbase, while negative values suggest selling pressure by Americans.
US investors include financial institutions and wealthy individuals interested in the crypto market. Therefore, analyzing their behavior can provide valuable insight.
As the chart depicts, this metric has been showing negative values over the past few weeks, pointing to the fact that American investors are selling their BTC. If this pattern continues and the market fails to break above $30K, the price might reverse to the downside in the short term due to excess supply.