After an extended consolidation phase around the crucial K resistance region, Bitcoin’s price is exhibiting slight fluctuations, possibly forming a double-top pattern. The emergence of this pattern could signal a notable downturn in the short term. Technical Analysis By Shayan The Daily Chart A detailed examination of the daily chart reveals that Bitcoin’s consolidation has prolonged near the critical K resistance zone. This significant price range aligns with the upper boundary of a multi-month ascending channel, resulting in a period of price stabilization and sideways movement. However, the failure to reclaim the prior significant swing high at .6K suggests the presence of supply near this crucial threshold. As a potential development, the price seems to form a
Topics:
CryptoVizArt considers the following as important: Bitcoin (BTC) Price, BTC Analysis, BTCEUR, BTCGBP, btcusd, btcusdt
This could be interesting, too:
Chayanika Deka writes XRP, SOL, and ADA Inclusion in US Crypto Reserve Pushes Traders on Edge
Chayanika Deka writes Why Arthur Hayes Is Bullish on Bitcoin Under Trump’s Economic Strategy
Mandy Williams writes Why the Bitcoin Market Is Stuck—and the Key Metric That Could Change It: CryptoQuant CEO
Wayne Jones writes Metaplanet Acquires 156 BTC, Bringing Total Holdings to 2,391
After an extended consolidation phase around the crucial $45K resistance region, Bitcoin’s price is exhibiting slight fluctuations, possibly forming a double-top pattern. The emergence of this pattern could signal a notable downturn in the short term.
Technical Analysis
By Shayan
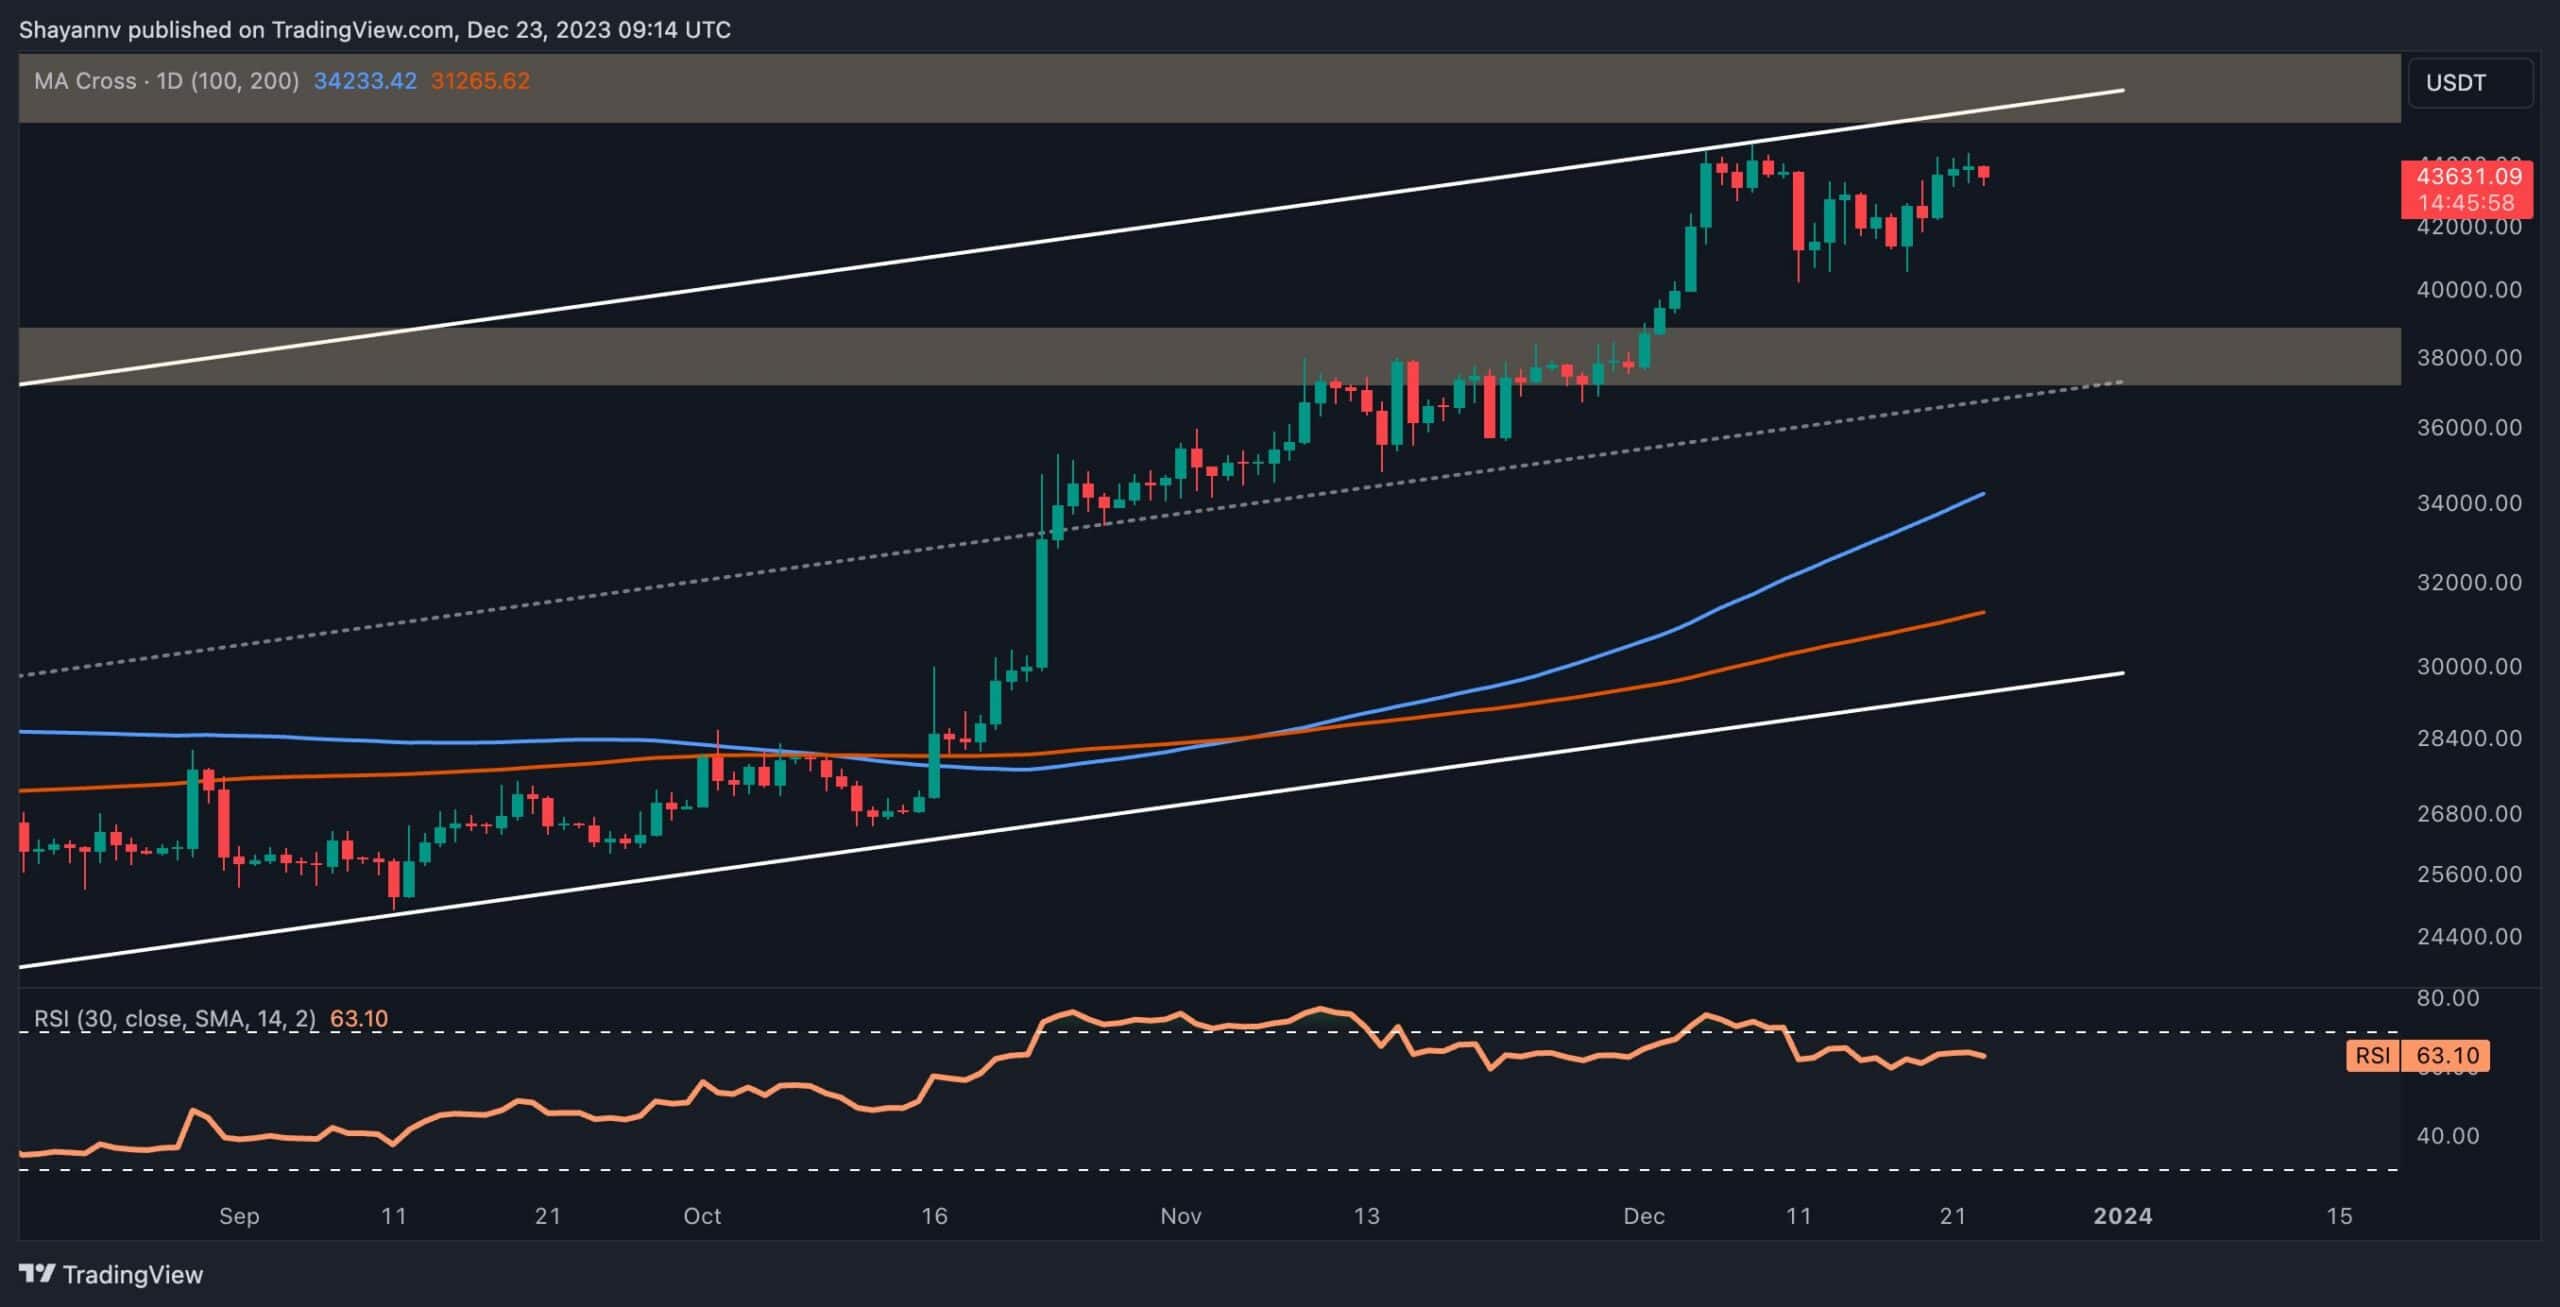
The Daily Chart
A detailed examination of the daily chart reveals that Bitcoin’s consolidation has prolonged near the critical $45K resistance zone. This significant price range aligns with the upper boundary of a multi-month ascending channel, resulting in a period of price stabilization and sideways movement. However, the failure to reclaim the prior significant swing high at $44.6K suggests the presence of supply near this crucial threshold.
As a potential development, the price seems to form a double-top pattern. A break below the neckline of this pattern could indicate a possible downturn in the market, targeting the decisive support range of around $38K. Nevertheless, the market will likely maintain the current consolidation pattern in the short term, fluctuating from $38K to $45K.
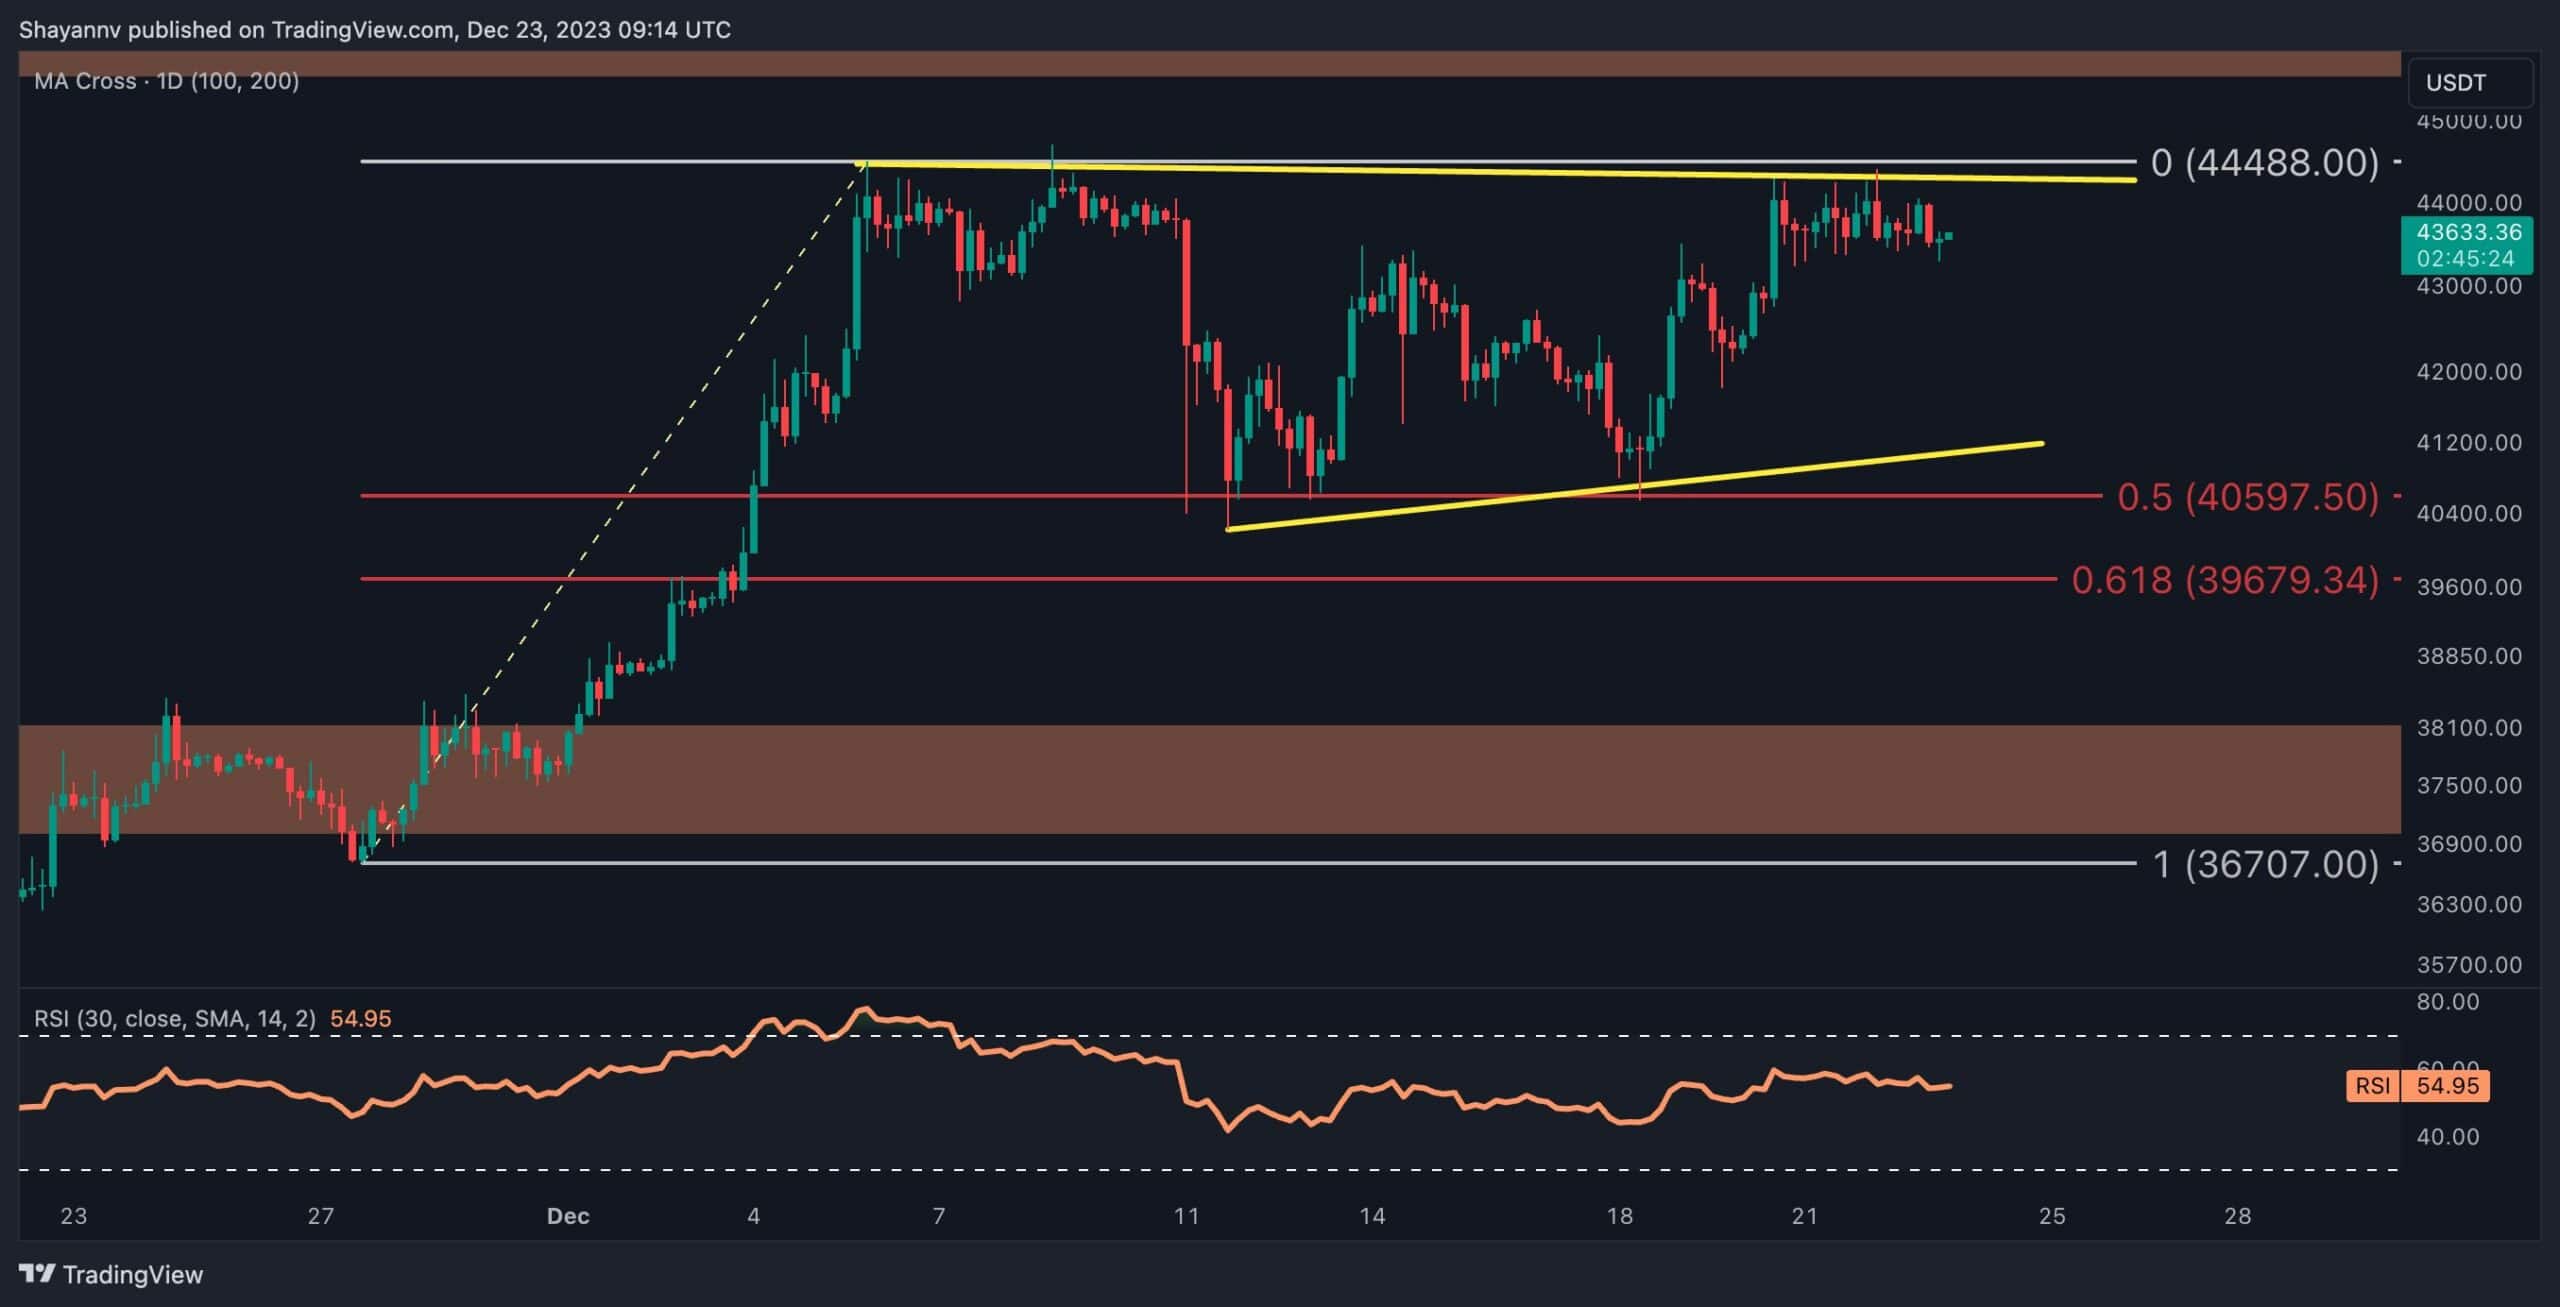
The 4-Hour Chart
An in-depth analysis of the 4-hour chart illustrates Bitcoin’s price experiencing a sideways movement, consolidating within a crucial range between the 0.5 Fibonacci level at $40.5K and the resistance region of $45K. This reflects an overall balance between buyers and sellers.
Amid this consolidation, the price has been tracing a sideways wedge pattern, moving between its upper and lower thresholds. Notably, the lower trendline of this wedge aligns with a key support level represented by the 0.5 Fibonacci retracement level, offering substantial support.
Currently, the price is attempting to surpass the upper boundary of the wedge. This breakout could pave the way for a renewed bullish movement if successful. However, considering the current market state and sentiment, it is likely that the price will extend its consolidation stage, continuing to fluctuate between the significant support at $40K and the crucial resistance at $45K.
On-chain Analysis
By Shayan
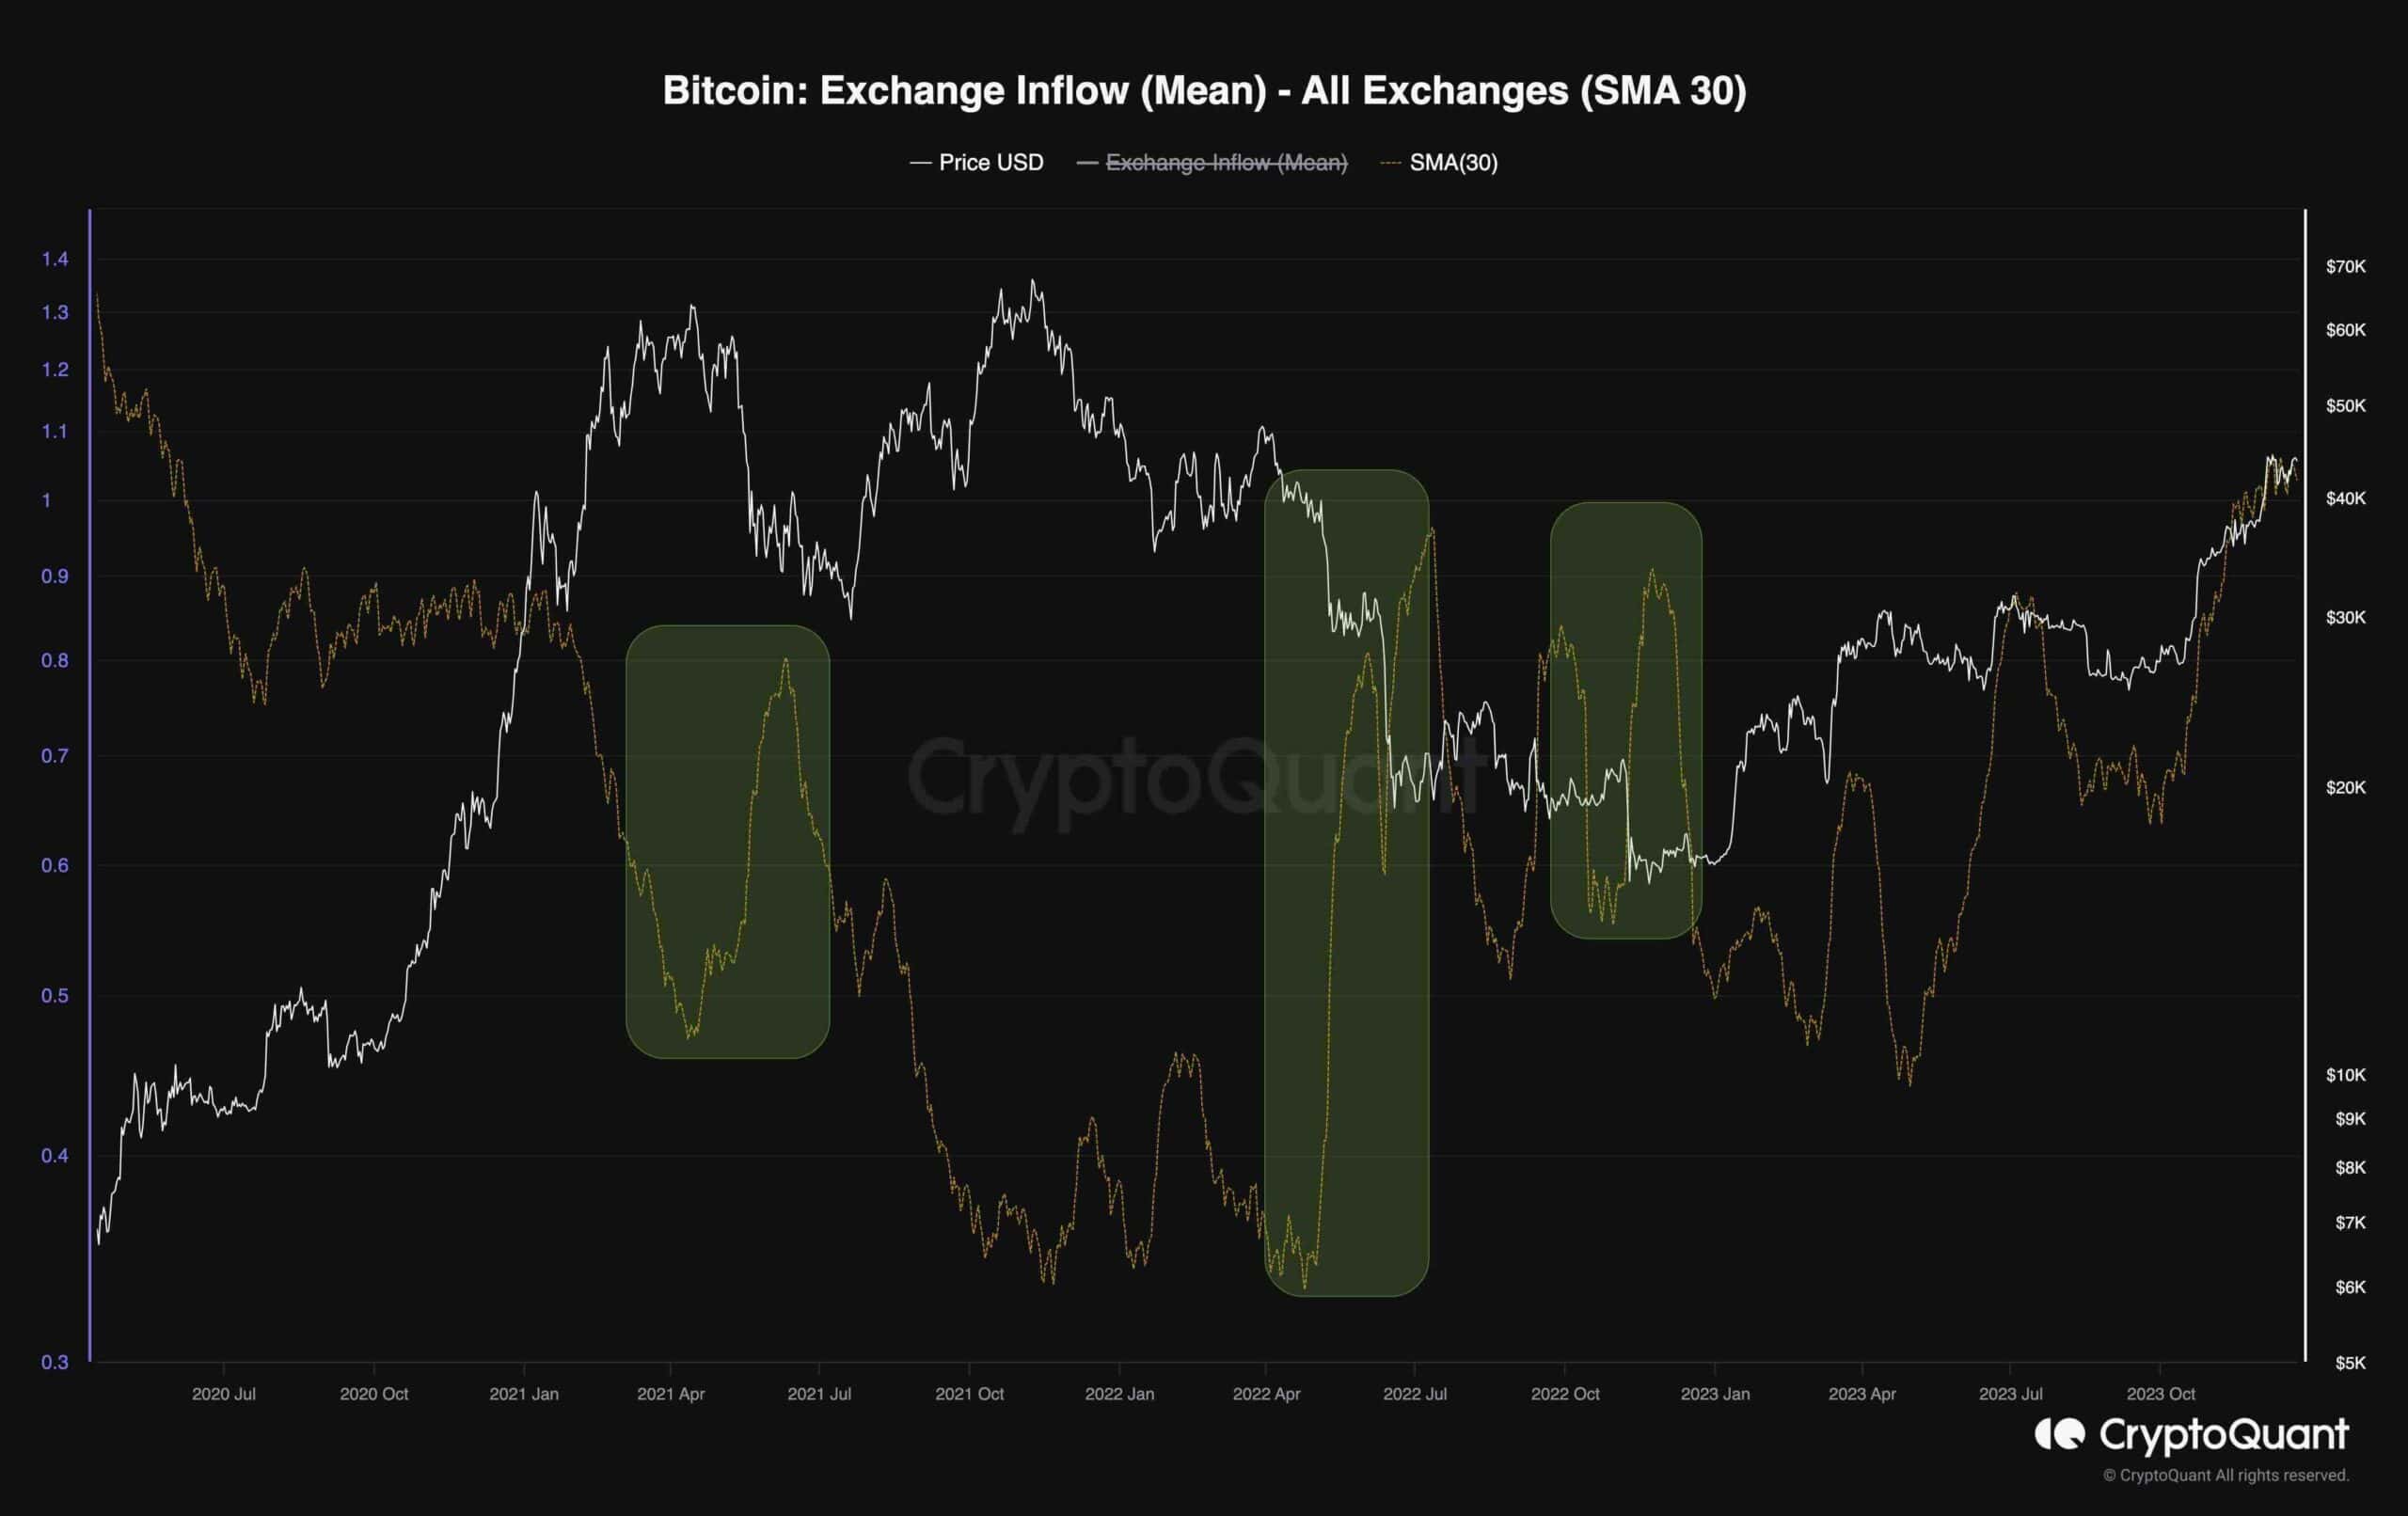
This chart depicts the mean amount of coins per transaction sent to exchanges, with a 30-day moving average applied alongside Bitcoin’s price. Elevated values of this metric indicate that investors are transmitting a higher amount of coins per transaction, suggesting increased selling pressure that may lead to a future price drop.
Historically, a surge in this metric has been correlated with a subsequent price cascade attributed to significant selling pressure from larger market participants. Recently, the indicator has experienced an upswing, signifying that participants are sending larger amounts of BTC to exchanges, potentially for distribution purposes.
While current distribution activities may be attributed to profit realization, sustained surges in this metric to concerning levels could signal substantial selling pressure from major market players, potentially resulting in a decline in prices.