Bitcoin’s price surged yesterday, bouncing from a critical support level. The surge came following the Grayscale news. However, a bearish continuation is still possible if the price remains below the 200-day moving average. Technical Analysis By Edris The Daily Chart On the daily chart, the price has finally demonstrated some bullish price action after finding support at the K level. The 200-day moving average, located around the ,500 mark, is currently being tested. A breakout above it would likely result in further rally and a possible retest of the K level. However, if the 200-day moving average rejects the price to the downside, another bearish move would become likely, potentially pushing the price toward the K level in the coming weeks. The 4-Hour Chart
Topics:
CryptoVizArt considers the following as important: Bitcoin (BTC) Price, BTC Analysis, BTCEUR, BTCGBP, btcusd, btcusdt
This could be interesting, too:
Chayanika Deka writes XRP, SOL, and ADA Inclusion in US Crypto Reserve Pushes Traders on Edge
Chayanika Deka writes Why Arthur Hayes Is Bullish on Bitcoin Under Trump’s Economic Strategy
Mandy Williams writes Why the Bitcoin Market Is Stuck—and the Key Metric That Could Change It: CryptoQuant CEO
Wayne Jones writes Metaplanet Acquires 156 BTC, Bringing Total Holdings to 2,391
Bitcoin’s price surged yesterday, bouncing from a critical support level. The surge came following the Grayscale news. However, a bearish continuation is still possible if the price remains below the 200-day moving average.
Technical Analysis
By Edris
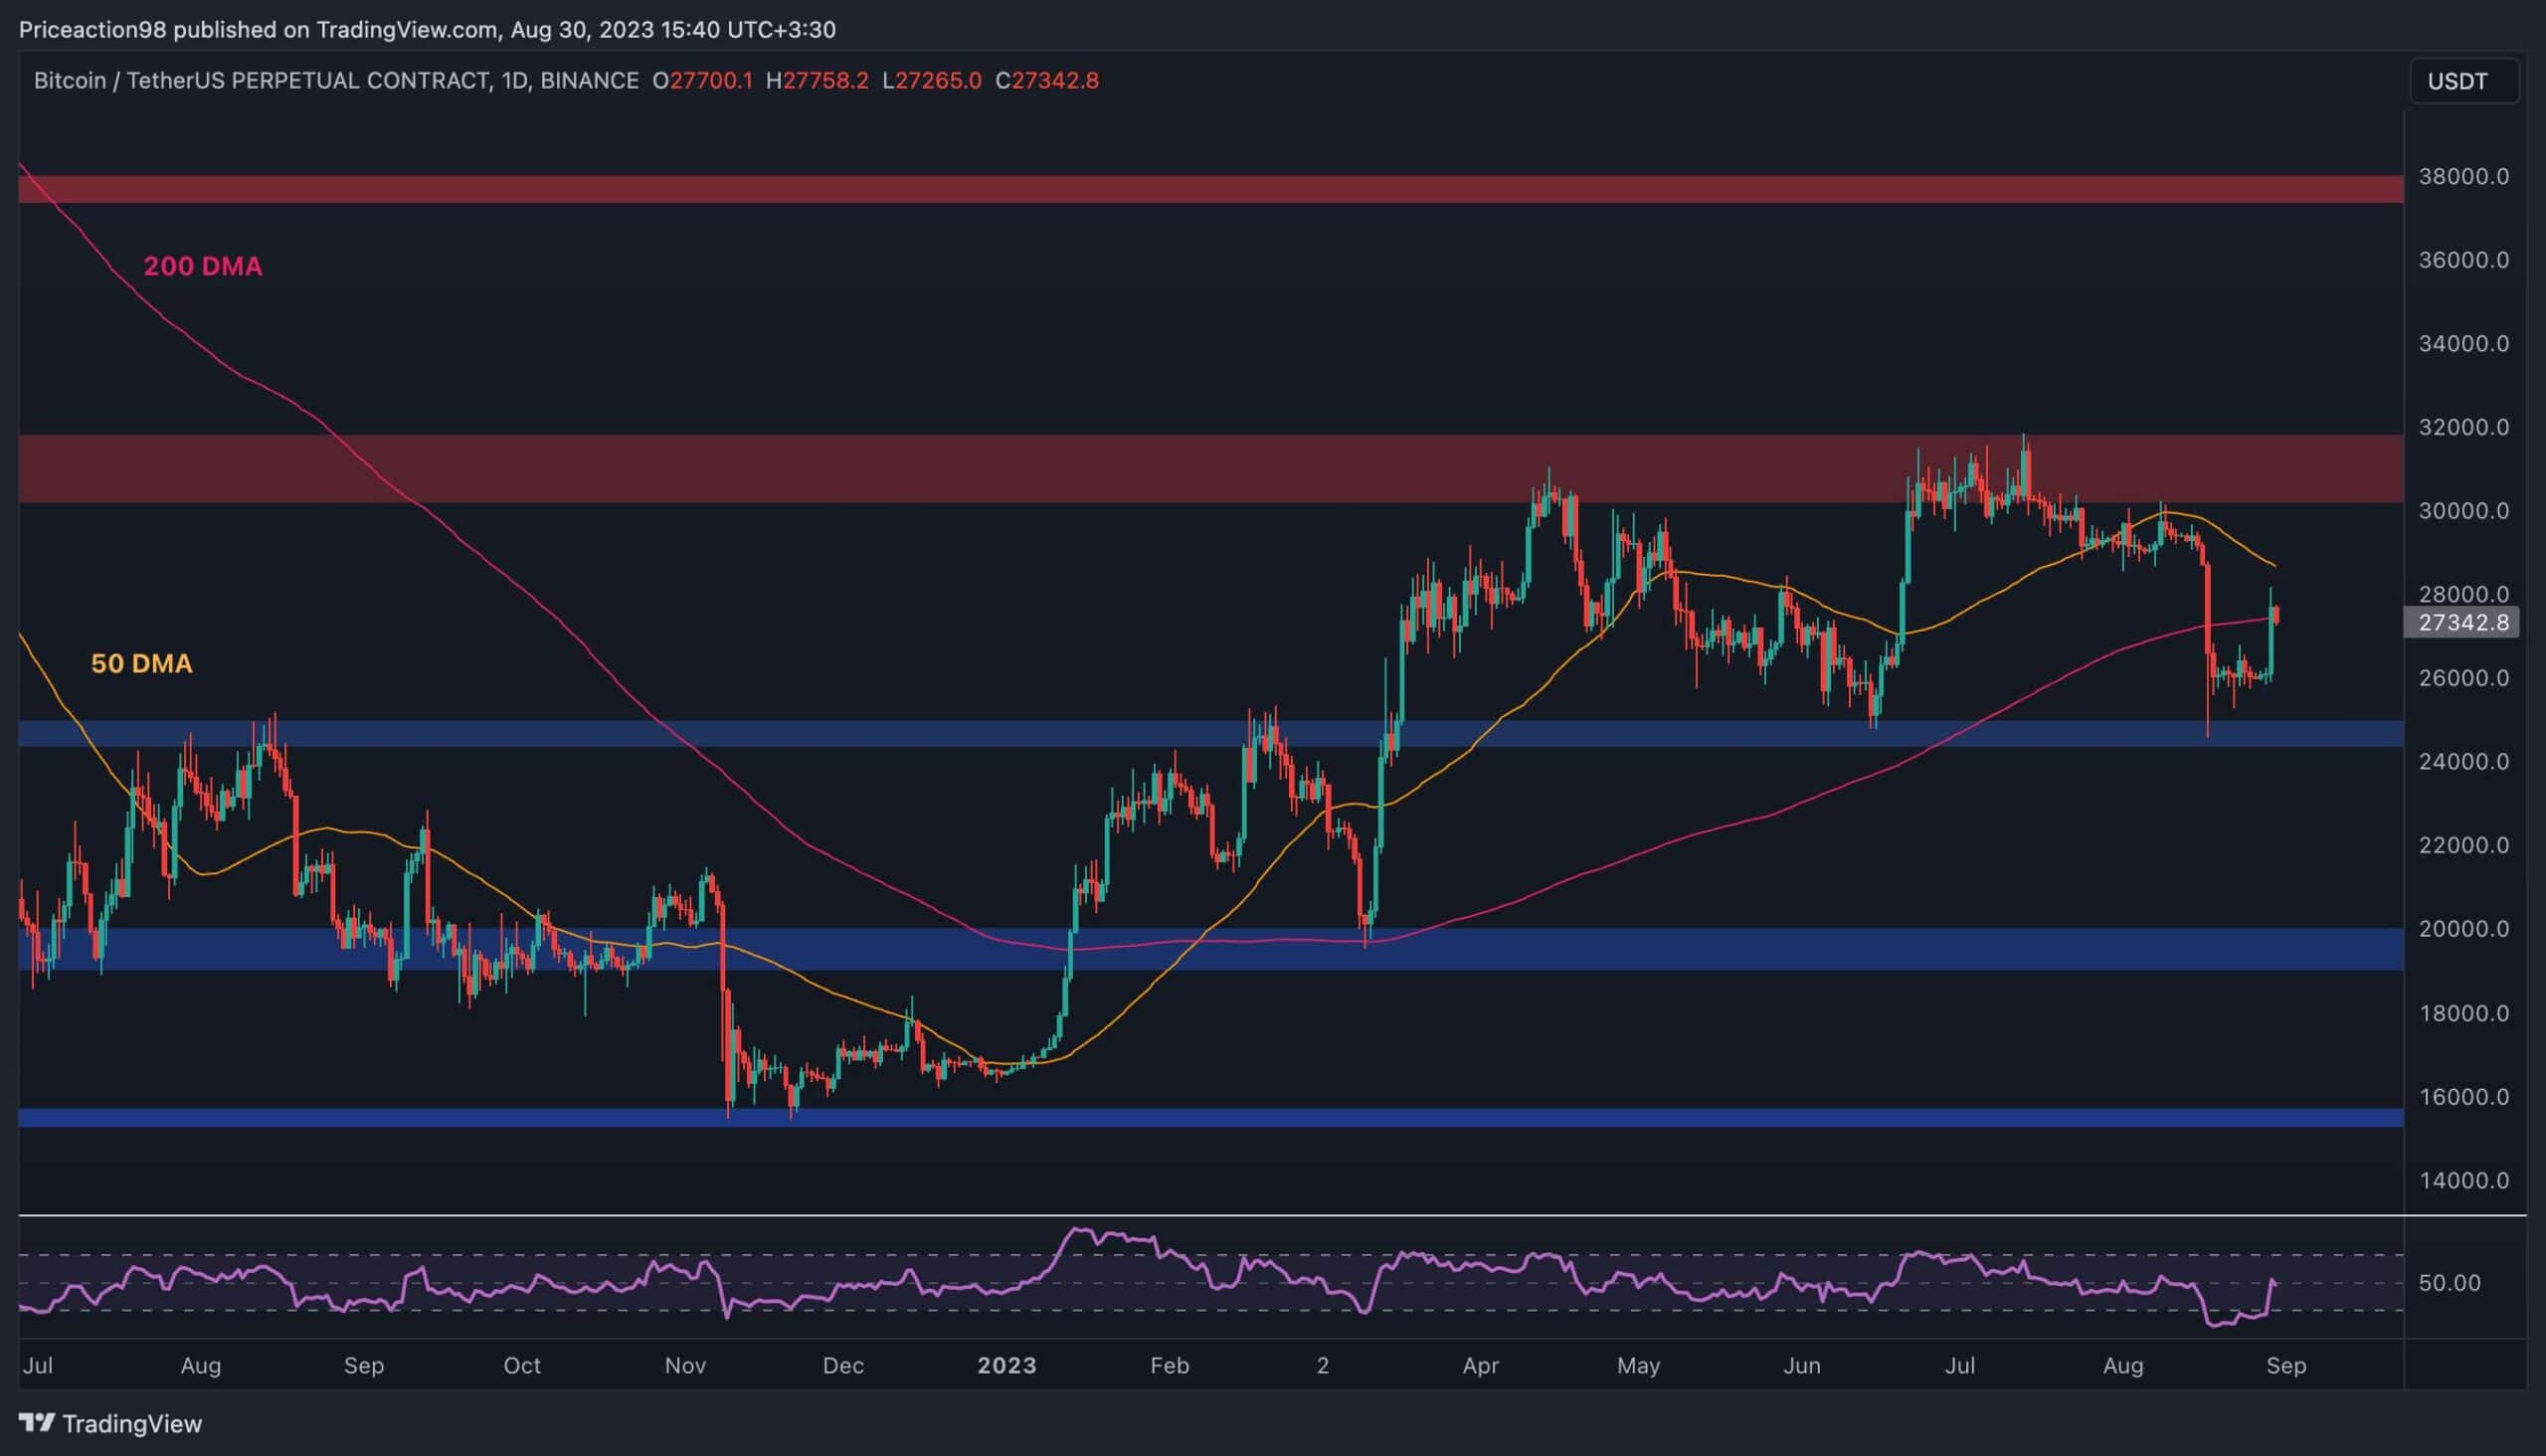
The Daily Chart
On the daily chart, the price has finally demonstrated some bullish price action after finding support at the $25K level. The 200-day moving average, located around the $27,500 mark, is currently being tested.
A breakout above it would likely result in further rally and a possible retest of the $30K level. However, if the 200-day moving average rejects the price to the downside, another bearish move would become likely, potentially pushing the price toward the $25K level in the coming weeks.
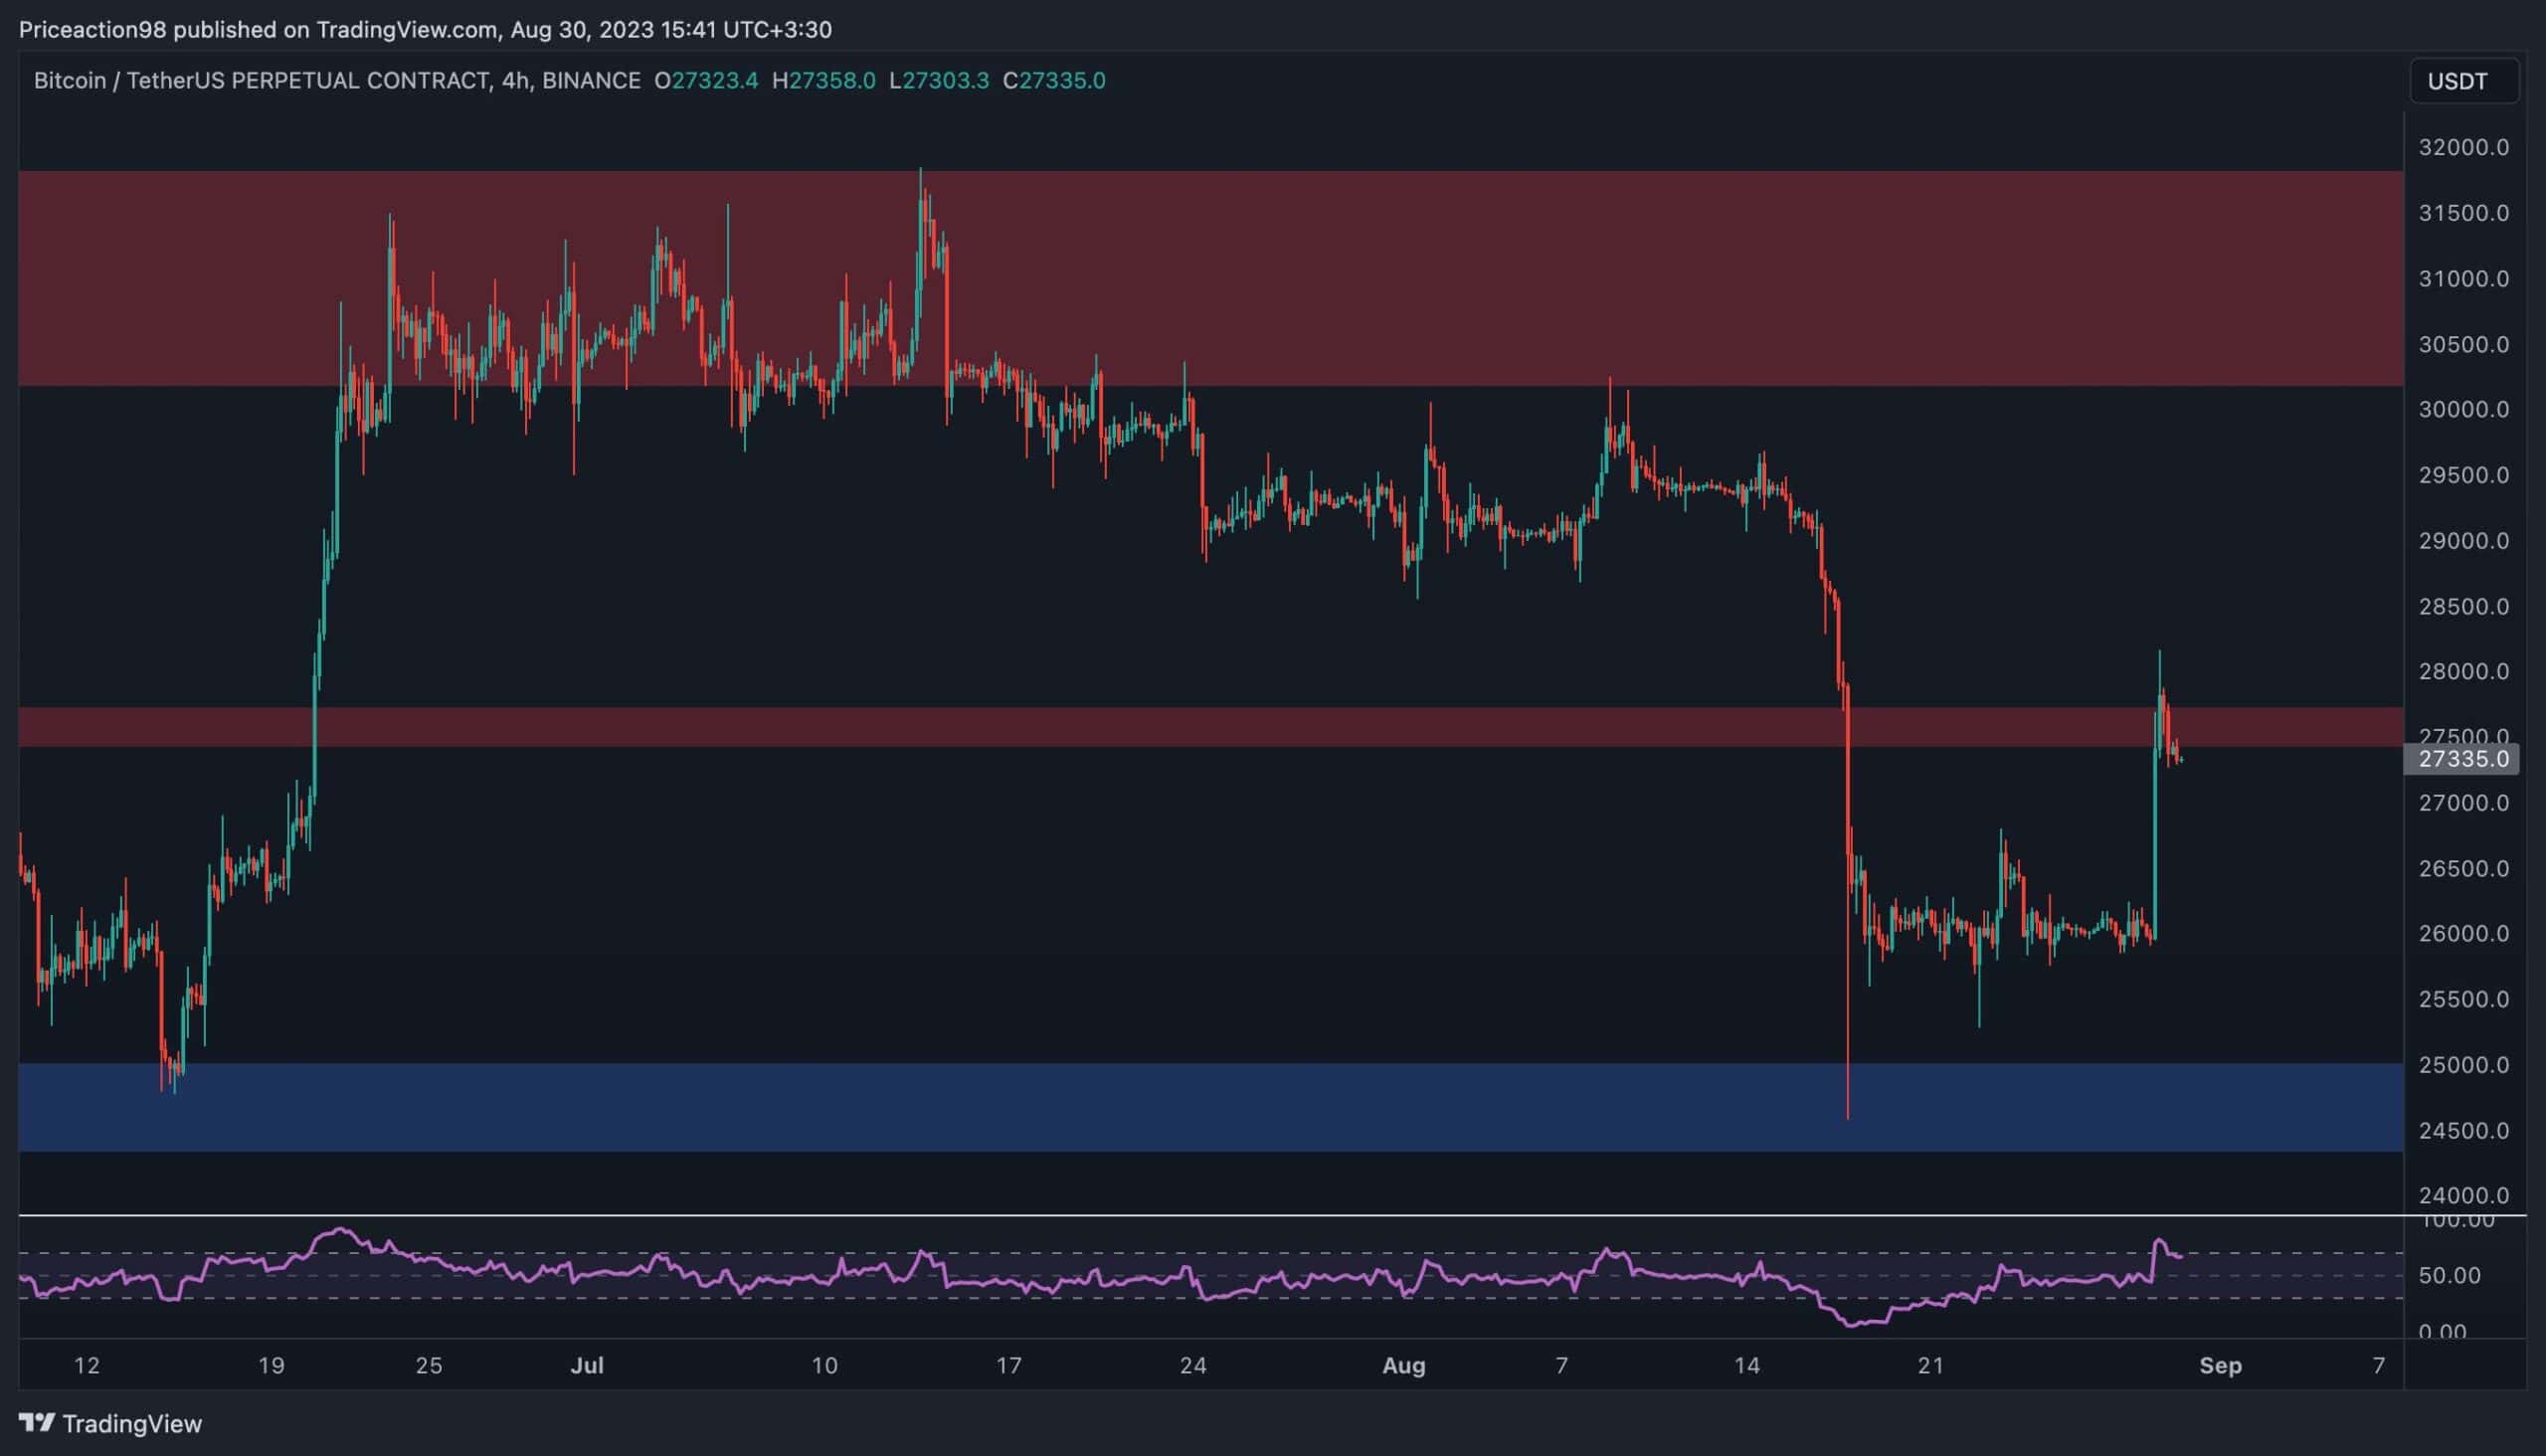
The 4-Hour Chart
The 4-hour chart shows the market is again around a key area. The price is testing the $27,500 level as the bullish momentum has faded.
If BTC rises above the mentioned resistance level, a rally towards $30K and beyond would become highly likely. Yet, considering the overbought signal indicated by the RSI and the current price action, a bearish rejection seems more probable. In this case, another drop toward the $25K level could be expected in the short term.
On-Chain Analysis
By: Edris
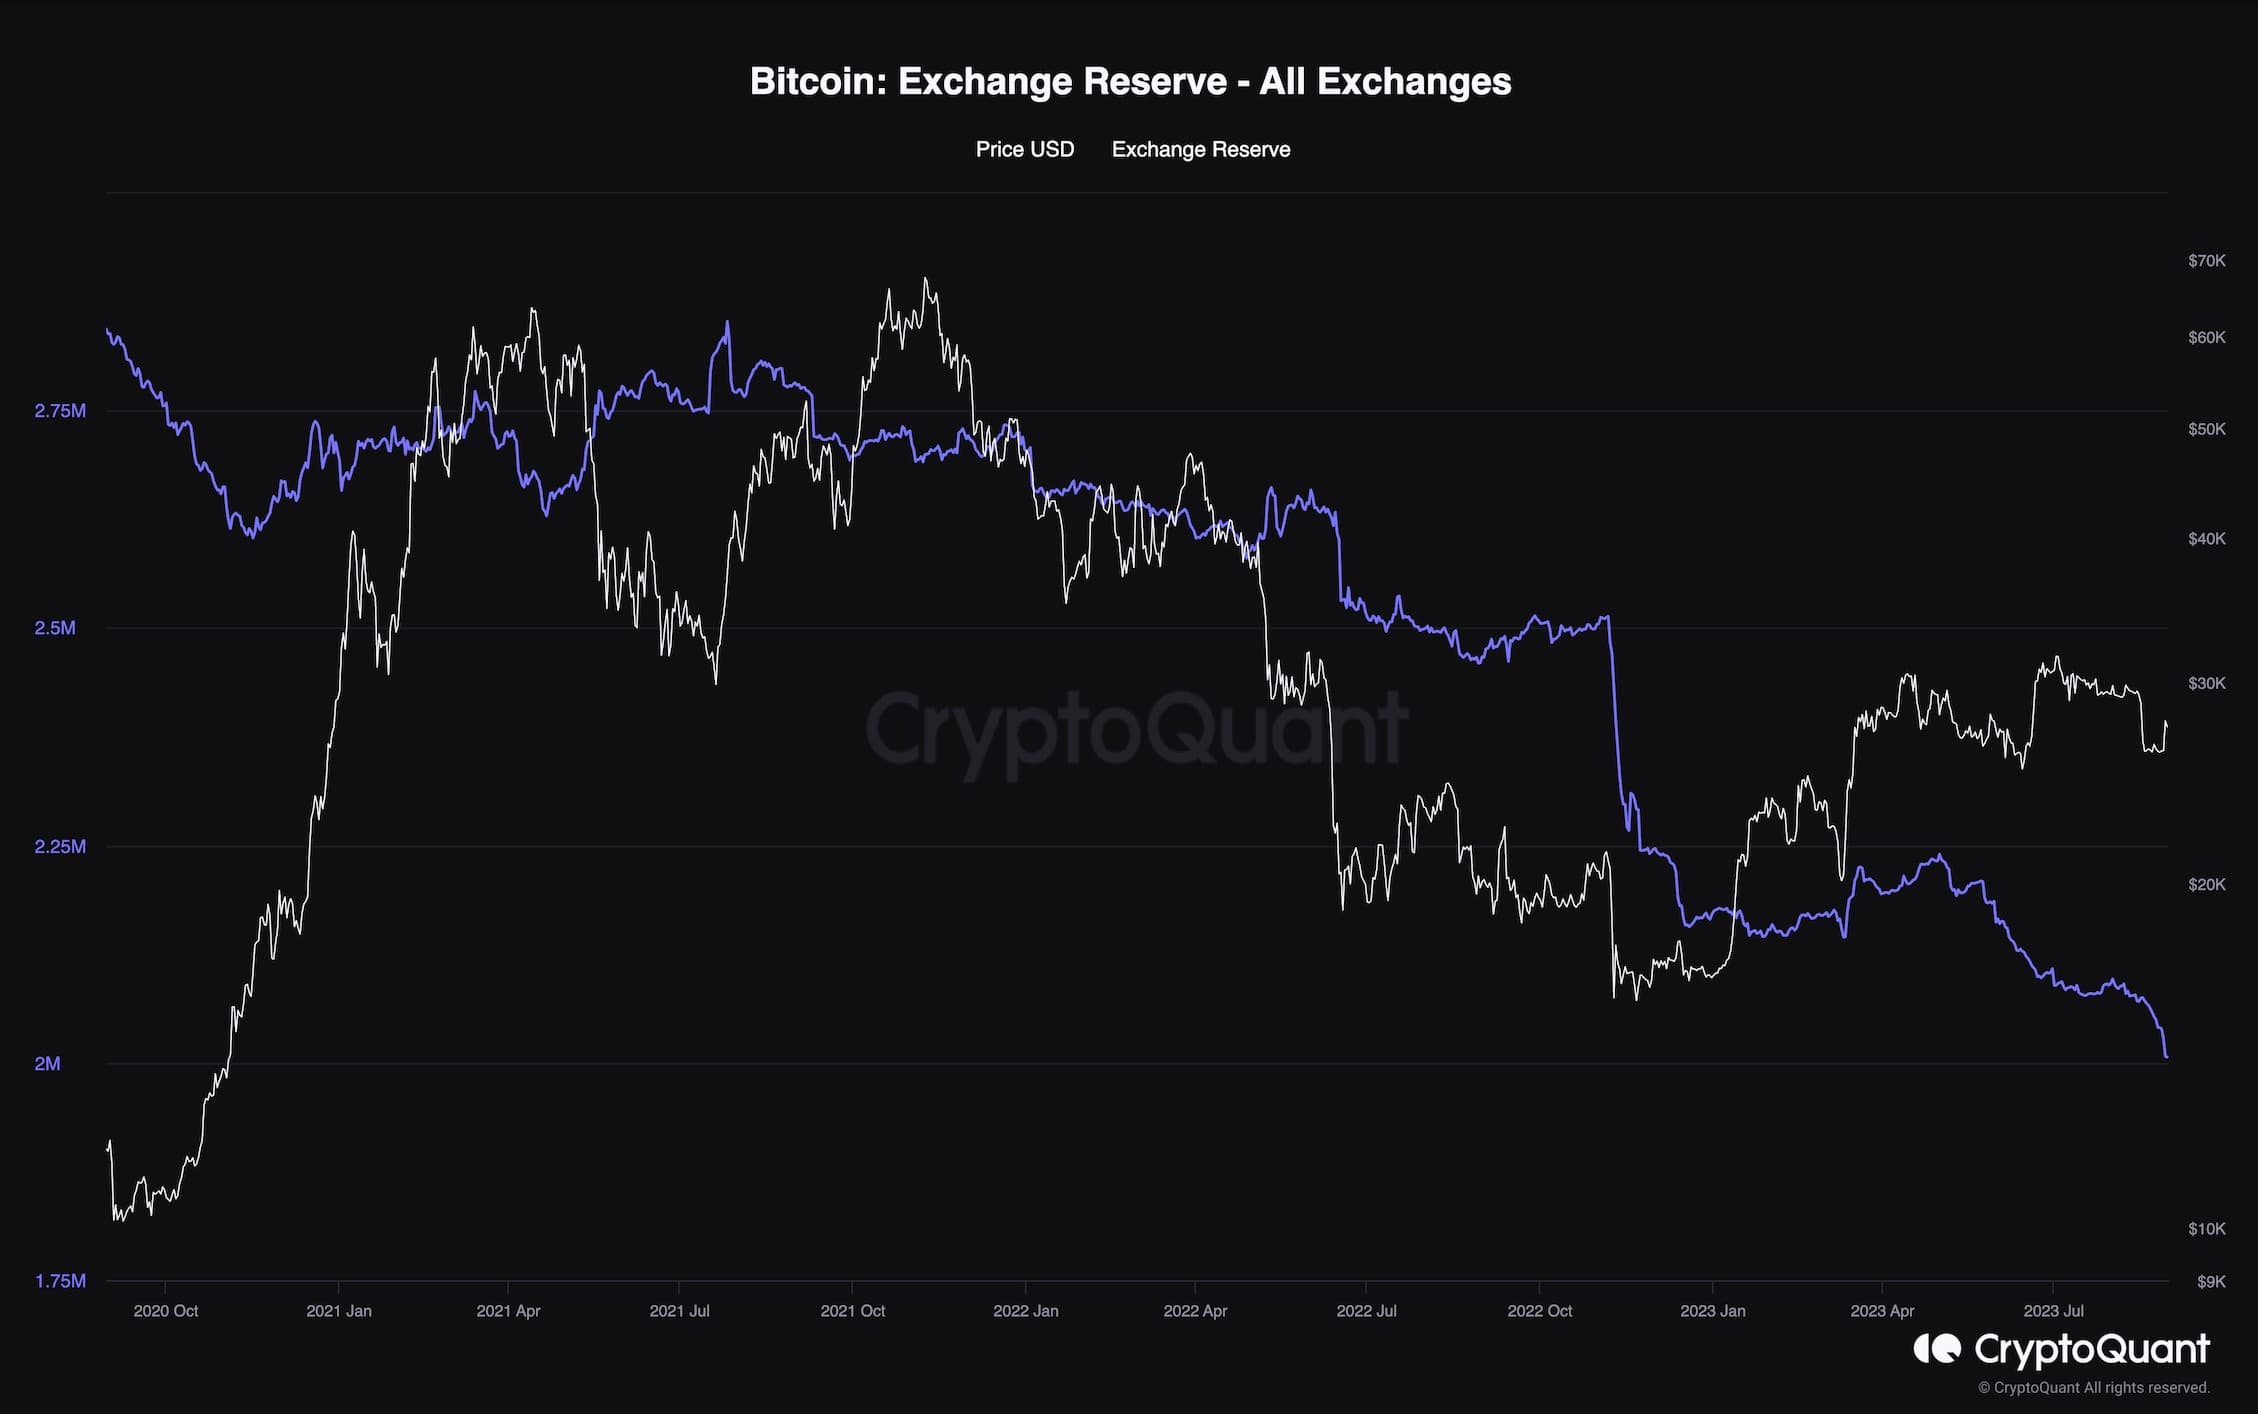
Bitcoin Exchange Reserve
Bitcoin’s price recently experienced a pullback but is again rising towards the $30K resistance level. To determine whether the rally is sustainable, it would be beneficial to examine the on-chain metrics in greater depth.
The chart below demonstrates the Bitcoin Exchange Reserve metric, which measures the amount of BTC held on exchange wallets. Typically, an increase in this value indicates potential selling pressure, while a decrease suggests a possible increase in demand.
As the chart shows, this metric has decreased rapidly over the last few weeks. This spike in demand has likely contributed to the recent recovery, and higher prices can be anticipated if this trend continues.