Bitcoin’s price has been trending to the upside since the beginning of 2023. However, it has been showing signs of a reversal recently, following a clear rejection from the K resistance level. Technical Analysis By: Edris The Daily Chart The price has been consolidating since it failed to break above the K resistance level. The 50-day moving average has been providing support but is currently getting broken to the downside around the K mark. In the event of a valid bearish breakout, the K support level would be the next probable target, followed by the key 200-day moving average, which is trending around the K area. The RSI has also dropped below the 50% threshold recently, hinting at a potential decline in the short term as momentum is shifting bearish.
Topics:
CryptoVizArt considers the following as important: Bitcoin (BTC) Price, BTC Analysis, btcusd, btcusdt
This could be interesting, too:
Chayanika Deka writes XRP, SOL, and ADA Inclusion in US Crypto Reserve Pushes Traders on Edge
Chayanika Deka writes Why Arthur Hayes Is Bullish on Bitcoin Under Trump’s Economic Strategy
Mandy Williams writes Why the Bitcoin Market Is Stuck—and the Key Metric That Could Change It: CryptoQuant CEO
Wayne Jones writes Metaplanet Acquires 156 BTC, Bringing Total Holdings to 2,391
Bitcoin’s price has been trending to the upside since the beginning of 2023. However, it has been showing signs of a reversal recently, following a clear rejection from the $30K resistance level.
Technical Analysis
By: Edris
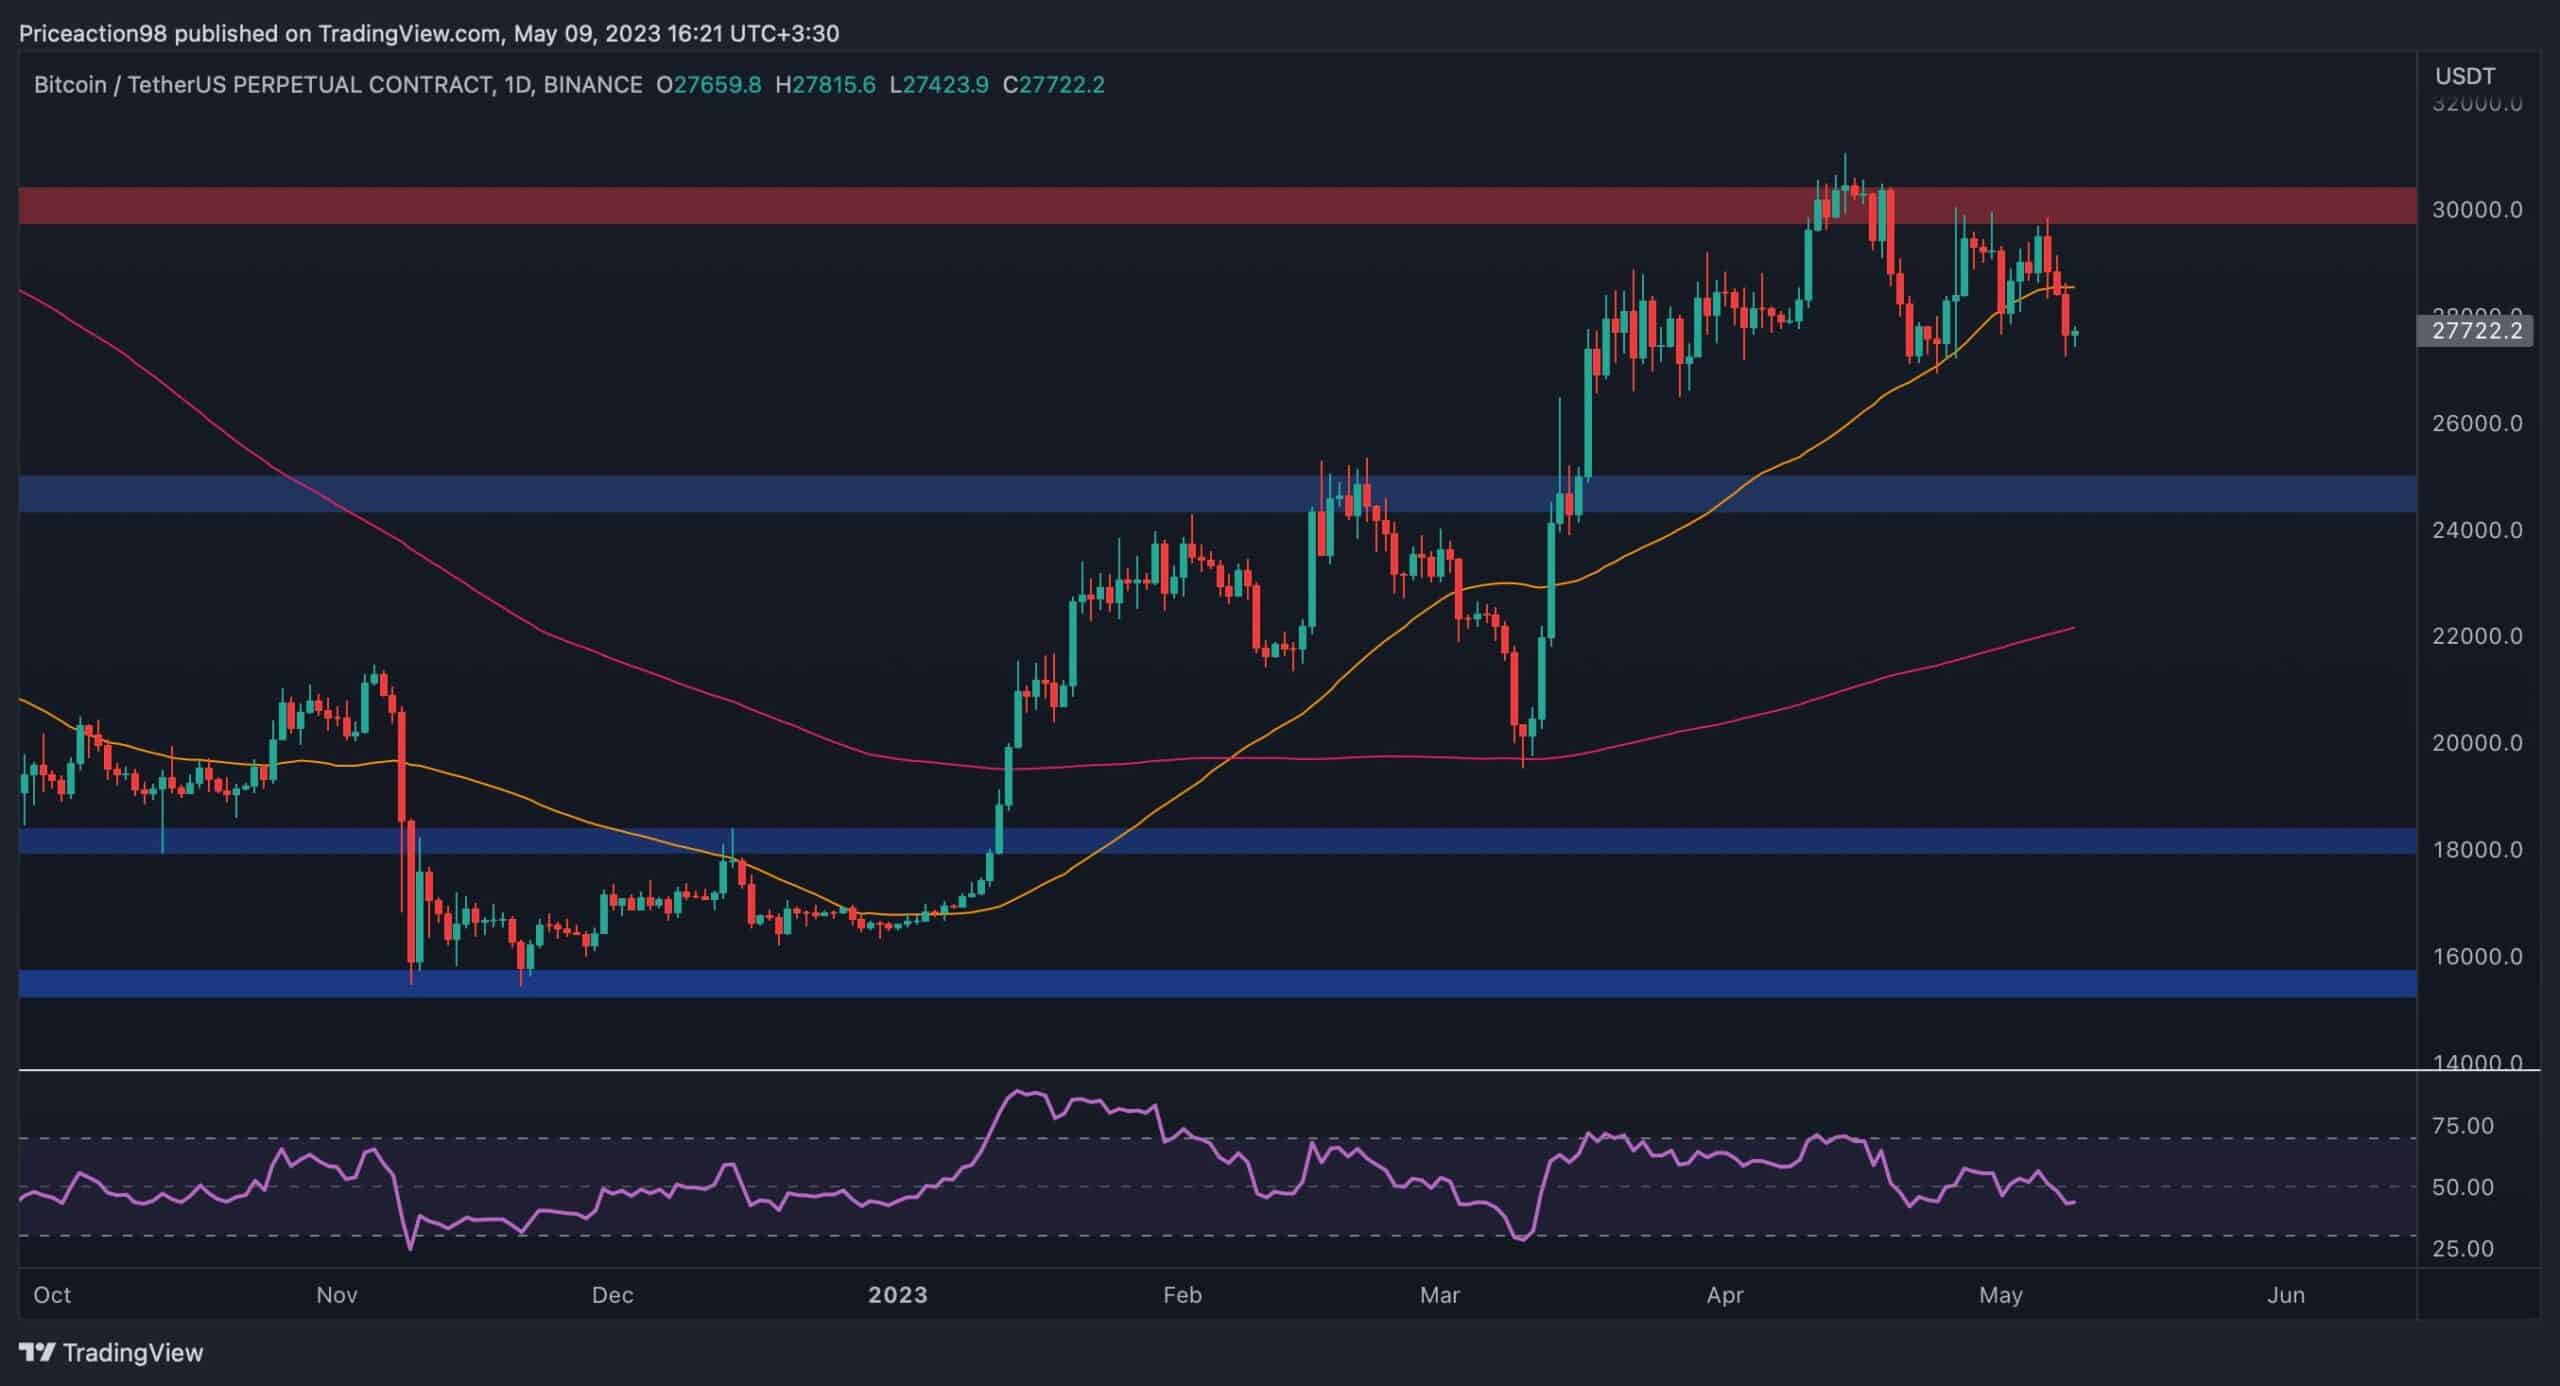
The Daily Chart
The price has been consolidating since it failed to break above the $30K resistance level. The 50-day moving average has been providing support but is currently getting broken to the downside around the $28K mark.
In the event of a valid bearish breakout, the $25K support level would be the next probable target, followed by the key 200-day moving average, which is trending around the $22K area. The RSI has also dropped below the 50% threshold recently, hinting at a potential decline in the short term as momentum is shifting bearish.
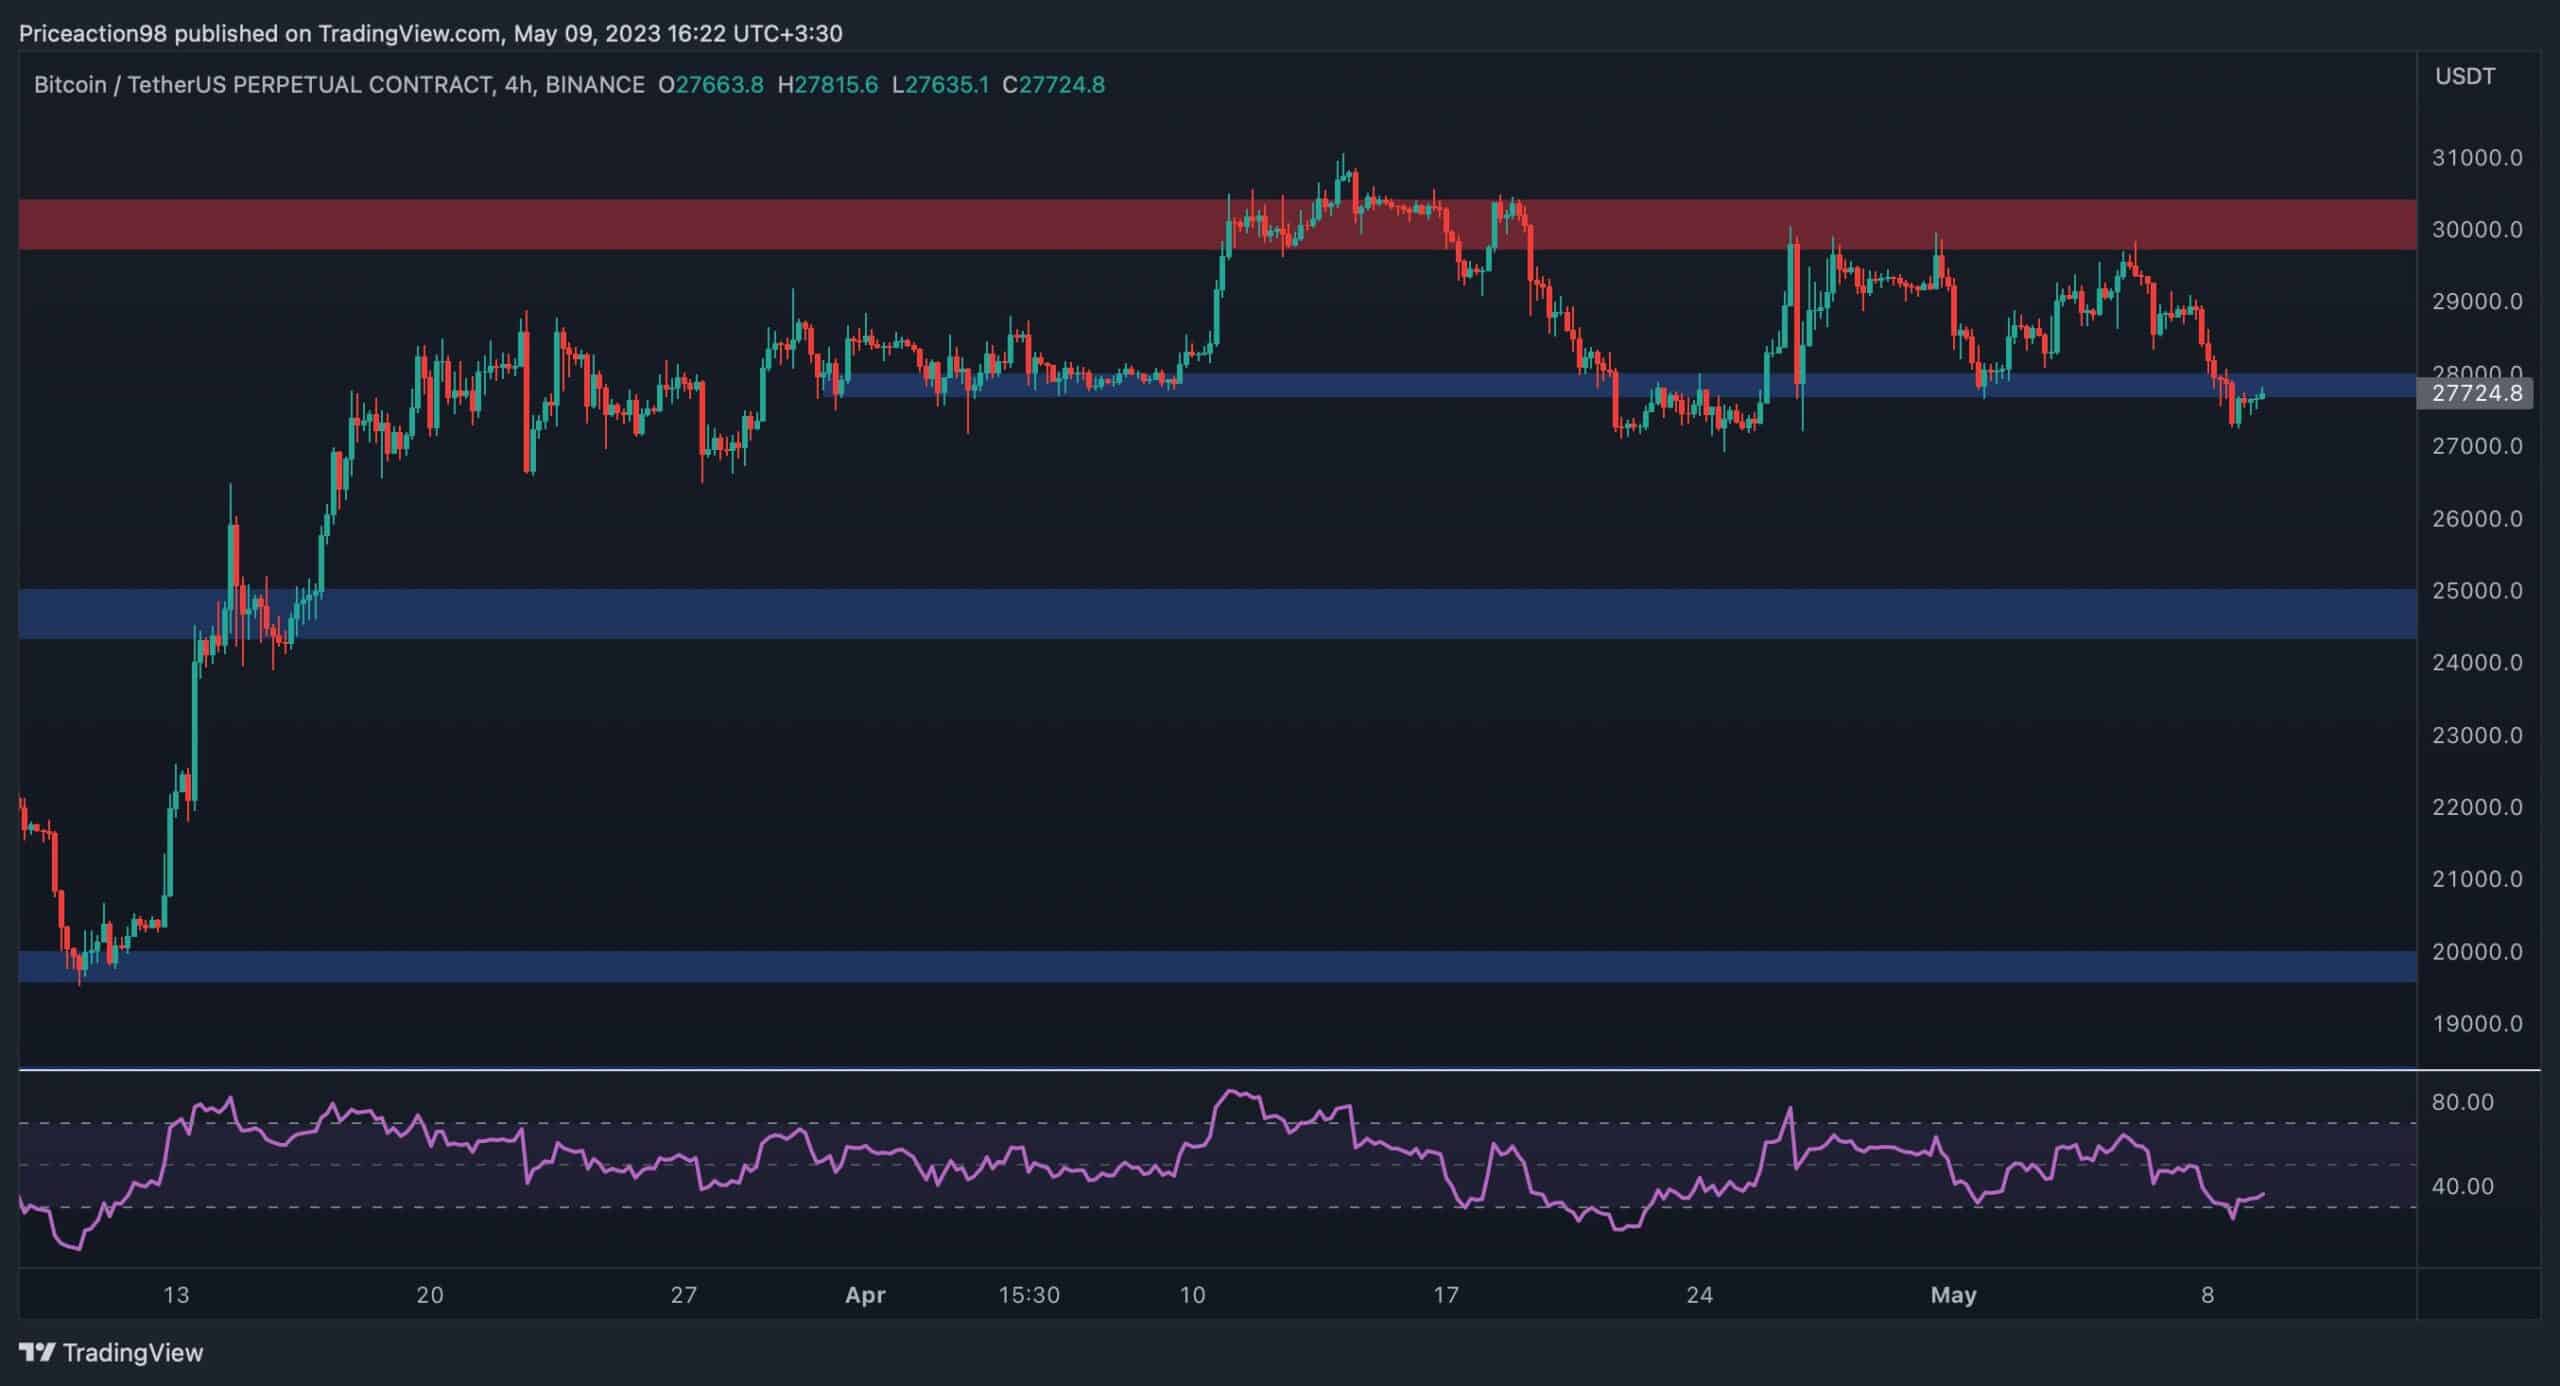
The 4-Hour Chart
On the 4-hour chart, it is evident that the price has been bouncing in a tight range between the $30K and $28K levels and is testing the latter at the moment. If a breakdown were to occur, a rapid plunge toward the $25K zone could be expected in the near term.
Even so, the RSI is approaching the oversold area, increasing the probability for the price to rebound from the $28K level and push towards the $30K resistance once more. However, all things considered, the bearish scenario seems more likely from a classical price action point of view on both the daily and the 4-hour timeframes.
Onchain Analysis
By Shayan
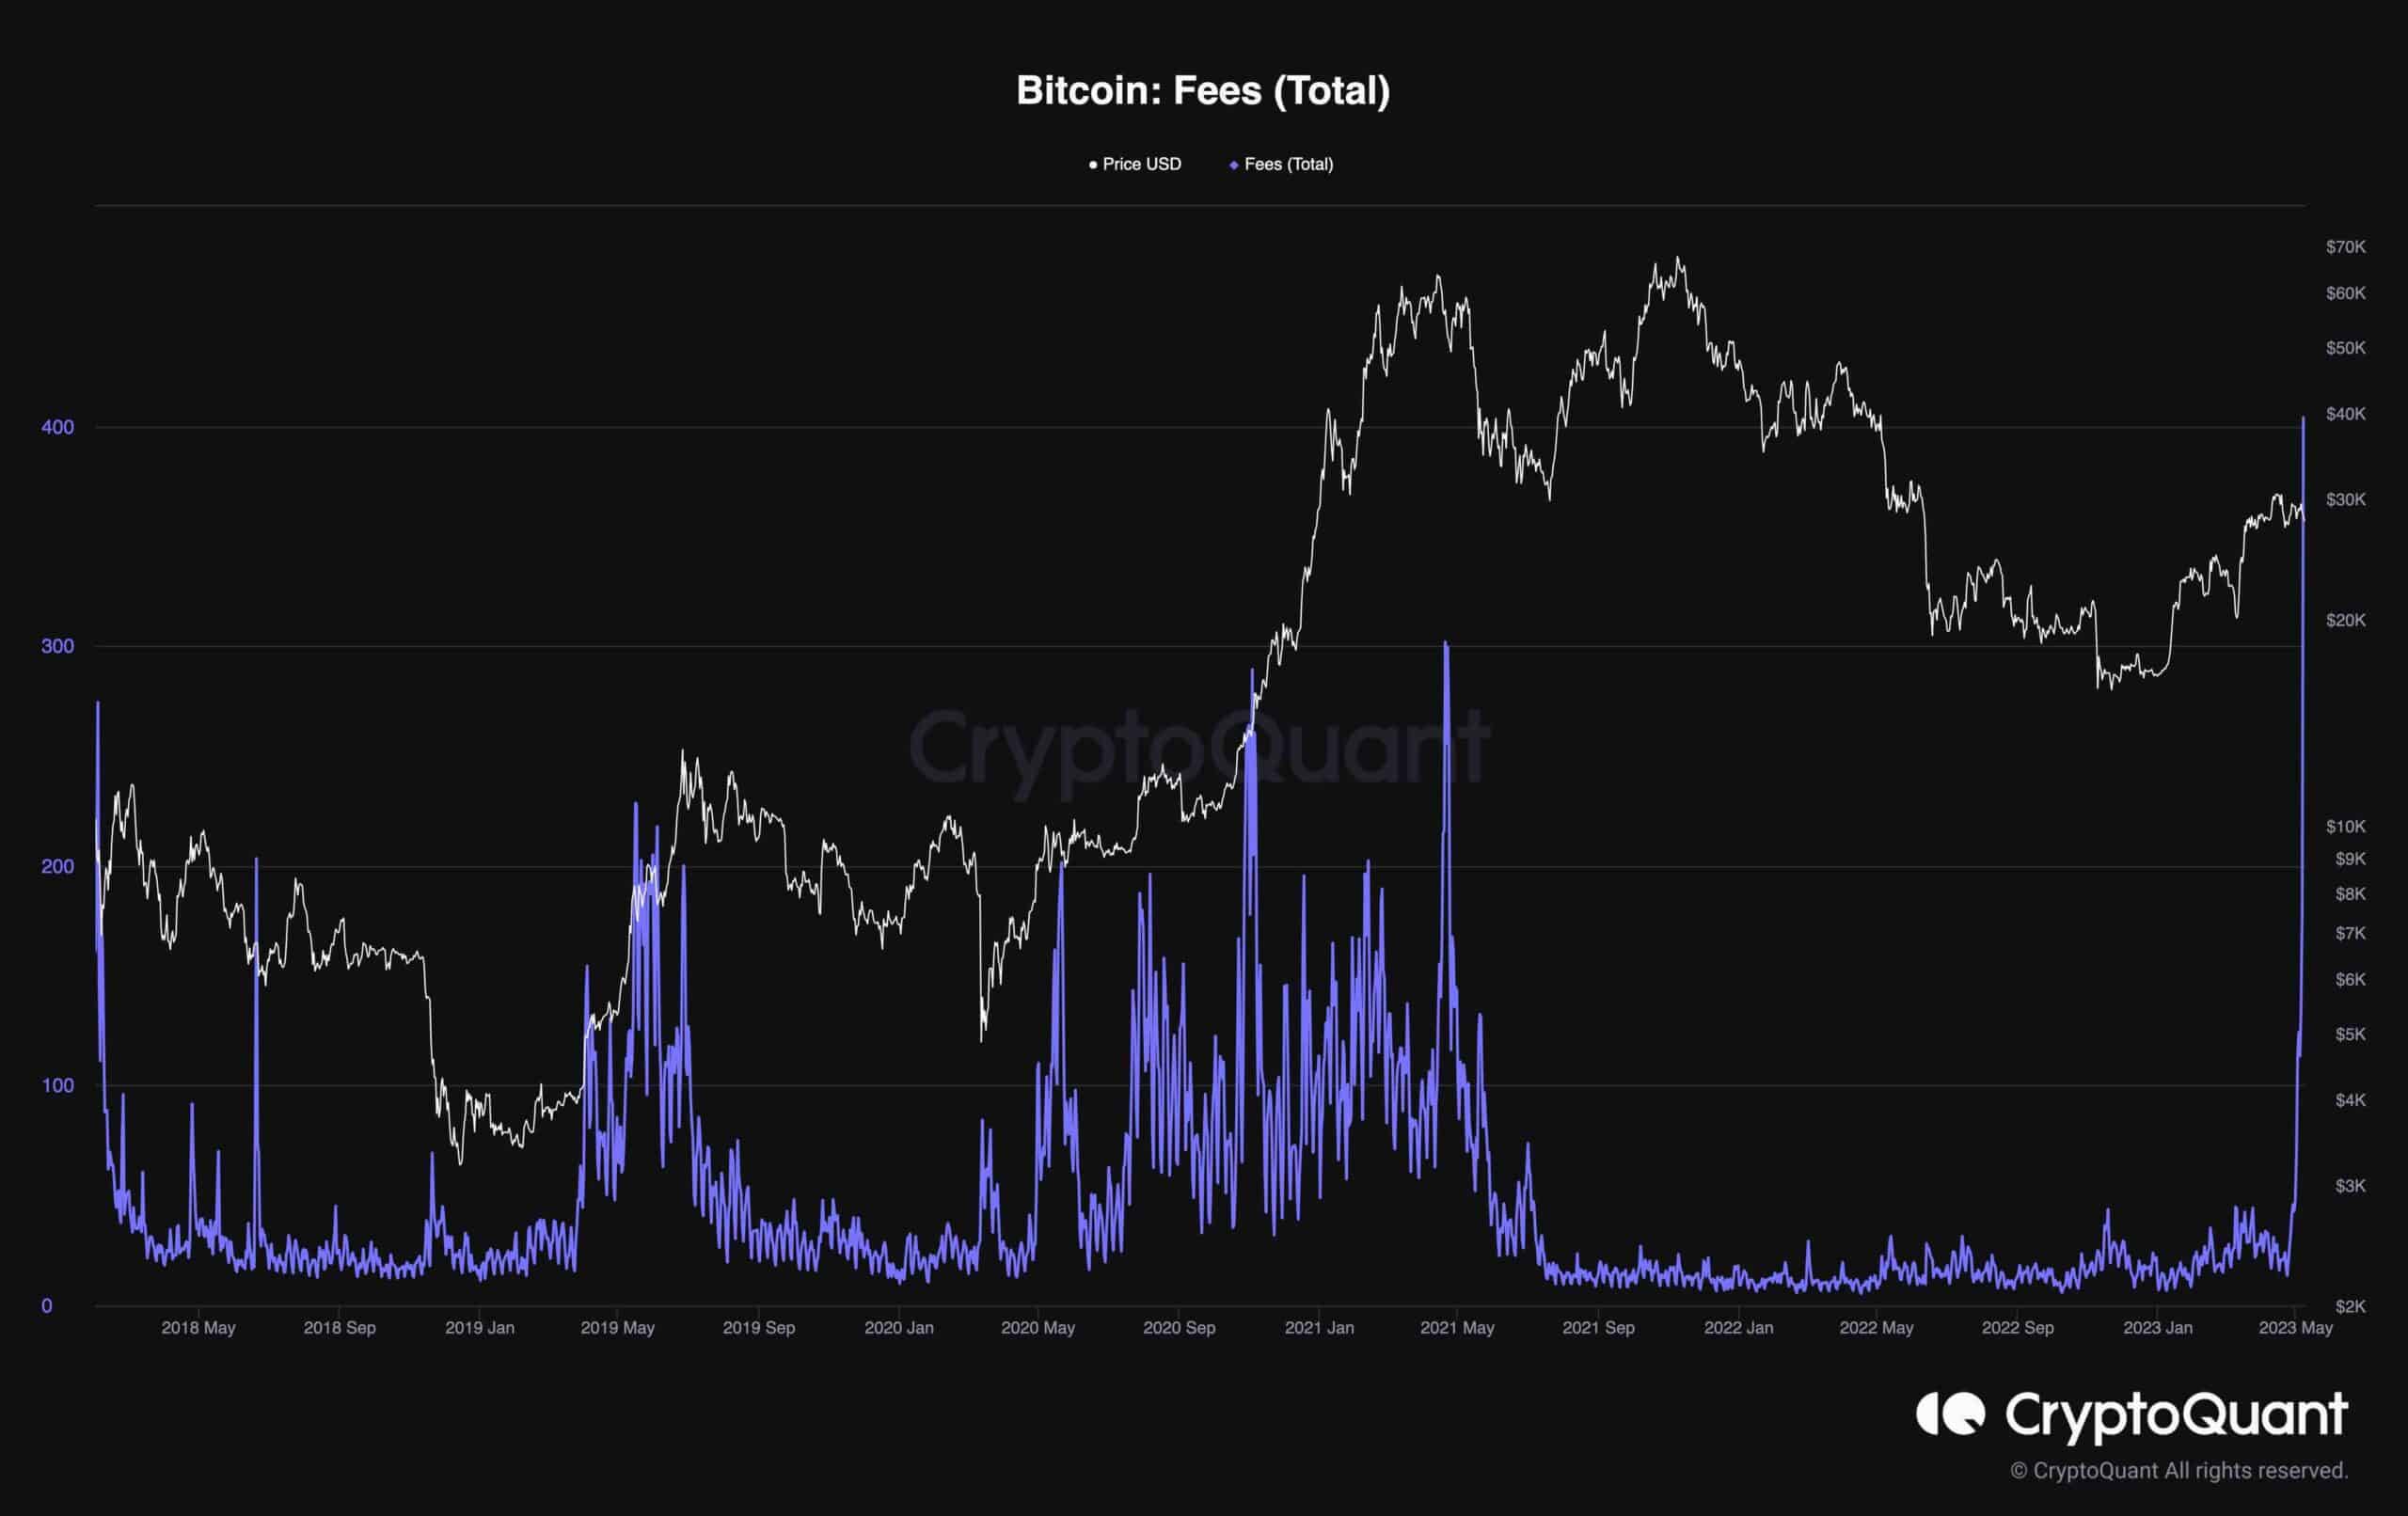
Due to the rise in Bitcoin transactions on Sunday, the fees paid to miners increased significantly. This pattern is uncommon for bear markets but is frequent during bull market tops.
The growing use of the Taproot update, which allows for the inclusion of NFTs and the BRC-20 token on the Bitcoin blockchain, can be related to the increase in transaction fees. While this may be a drawback for routine transactions, it is advantageous for mining earnings.
Furthermore, this shift has caused changes in other on-chain metrics, such as a significant increase in the number of active addresses and transactions. This could be seen as a positive sign, marking the beginning of a bull market.