A prolonged struggle has been ongoing between buyers and sellers centered around the 100-day moving average. The price has been exhibiting remarkably low volatility, which suggests a state of indecision in the market. The price action within this pivotal price range could potentially indicate Bitcoin’s future price movement. Technical Analysis By Shayan The Daily Chart The daily chart depicts a corrective movement following the rejection at K. This movement is characterized by a gradual retracement towards the 100-day moving average, which is positioned at .5K. This level has effectively acted as a strong support, preventing further declines for several months. Currently, after a phase of subdued activity above the 100-day MA, the price has made a modest recovery,
Topics:
CryptoVizArt considers the following as important: Bitcoin (BTC) Price, BTC Analysis, BTCEUR, BTCGBP, btcusd, btcusdt
This could be interesting, too:
Chayanika Deka writes XRP, SOL, and ADA Inclusion in US Crypto Reserve Pushes Traders on Edge
Chayanika Deka writes Why Arthur Hayes Is Bullish on Bitcoin Under Trump’s Economic Strategy
Mandy Williams writes Why the Bitcoin Market Is Stuck—and the Key Metric That Could Change It: CryptoQuant CEO
Wayne Jones writes Metaplanet Acquires 156 BTC, Bringing Total Holdings to 2,391
A prolonged struggle has been ongoing between buyers and sellers centered around the 100-day moving average.
The price has been exhibiting remarkably low volatility, which suggests a state of indecision in the market. The price action within this pivotal price range could potentially indicate Bitcoin’s future price movement.
Technical Analysis
By Shayan
The Daily Chart
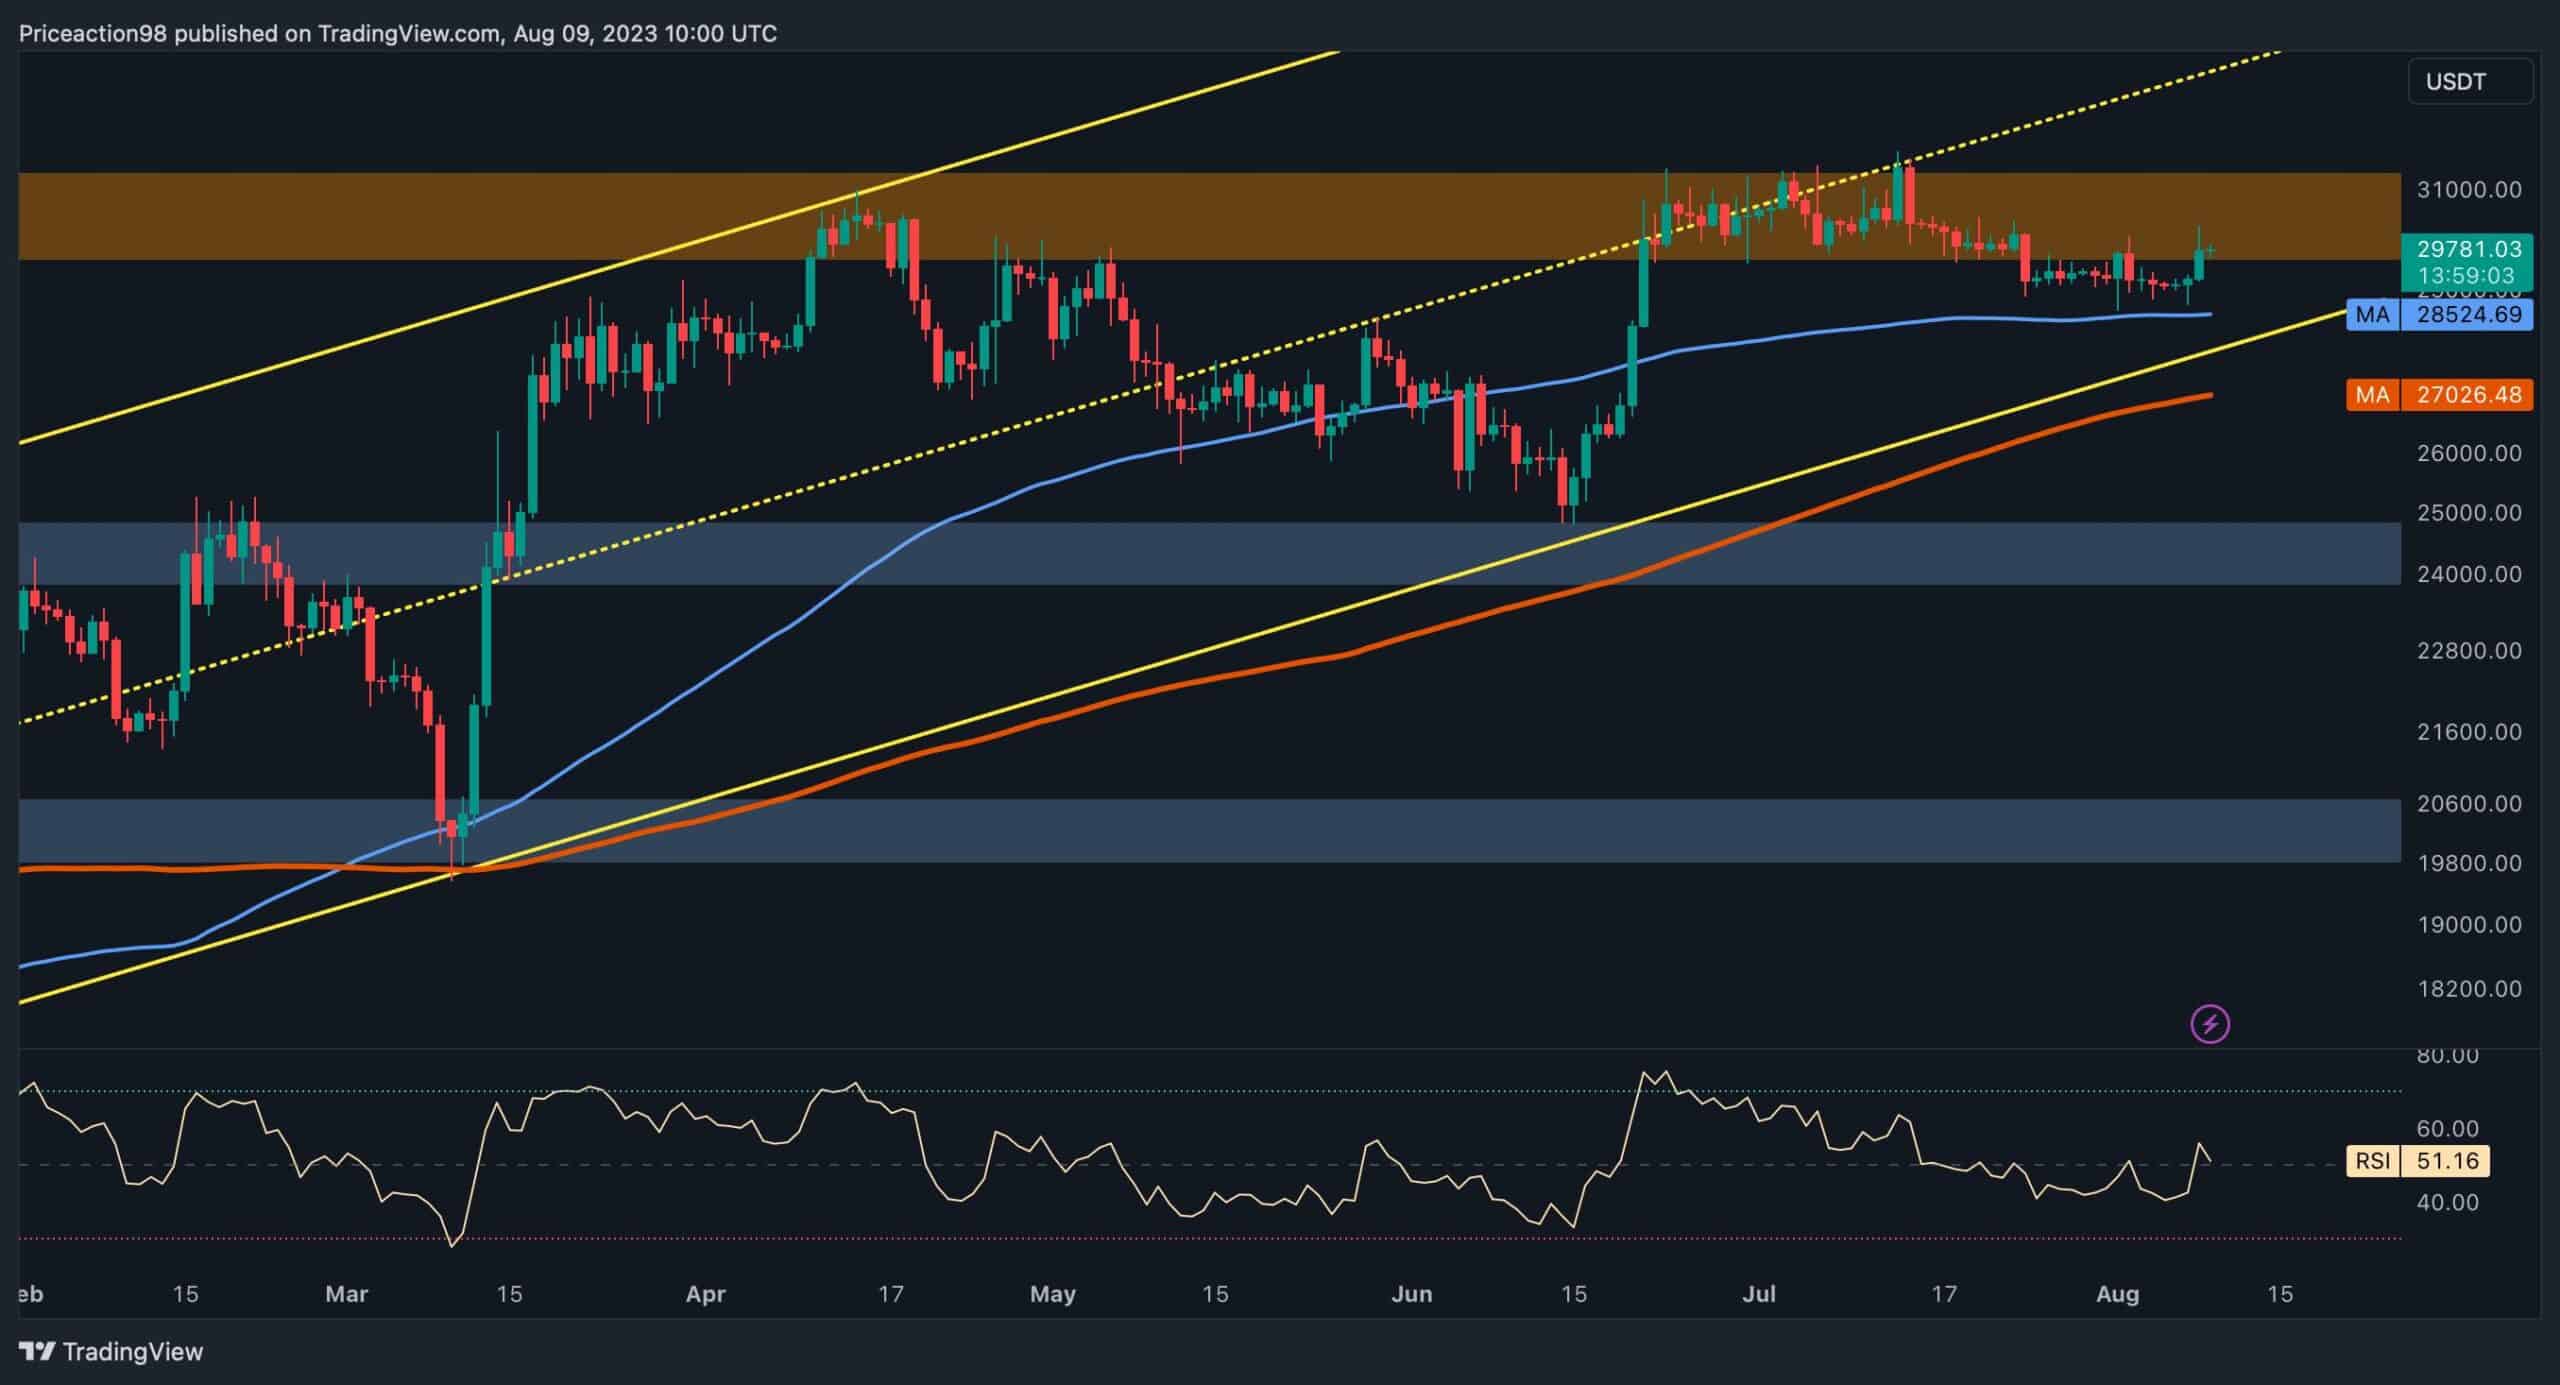
The daily chart depicts a corrective movement following the rejection at $30K. This movement is characterized by a gradual retracement towards the 100-day moving average, which is positioned at $28.5K. This level has effectively acted as a strong support, preventing further declines for several months.
Currently, after a phase of subdued activity above the 100-day MA, the price has made a modest recovery, marked by a relatively sizeable bullish candle. Nonetheless, the possibility of a drop below the 100-day MA still remains, which might trigger a cascading effect toward the 200-day moving average. This level also aligns with the lower boundary of the multi-month channel, making it a robust barrier in Bitcoin’s downward path.
The 200-day MA holds significant importance as it could potentially serve as a support and put a stop to further downward movements. However, should the price find support at the 100-day MA, it could potentially set off a rally towards the $30K resistance zone with the aim of reclaiming it.
The 4-Hour Chart
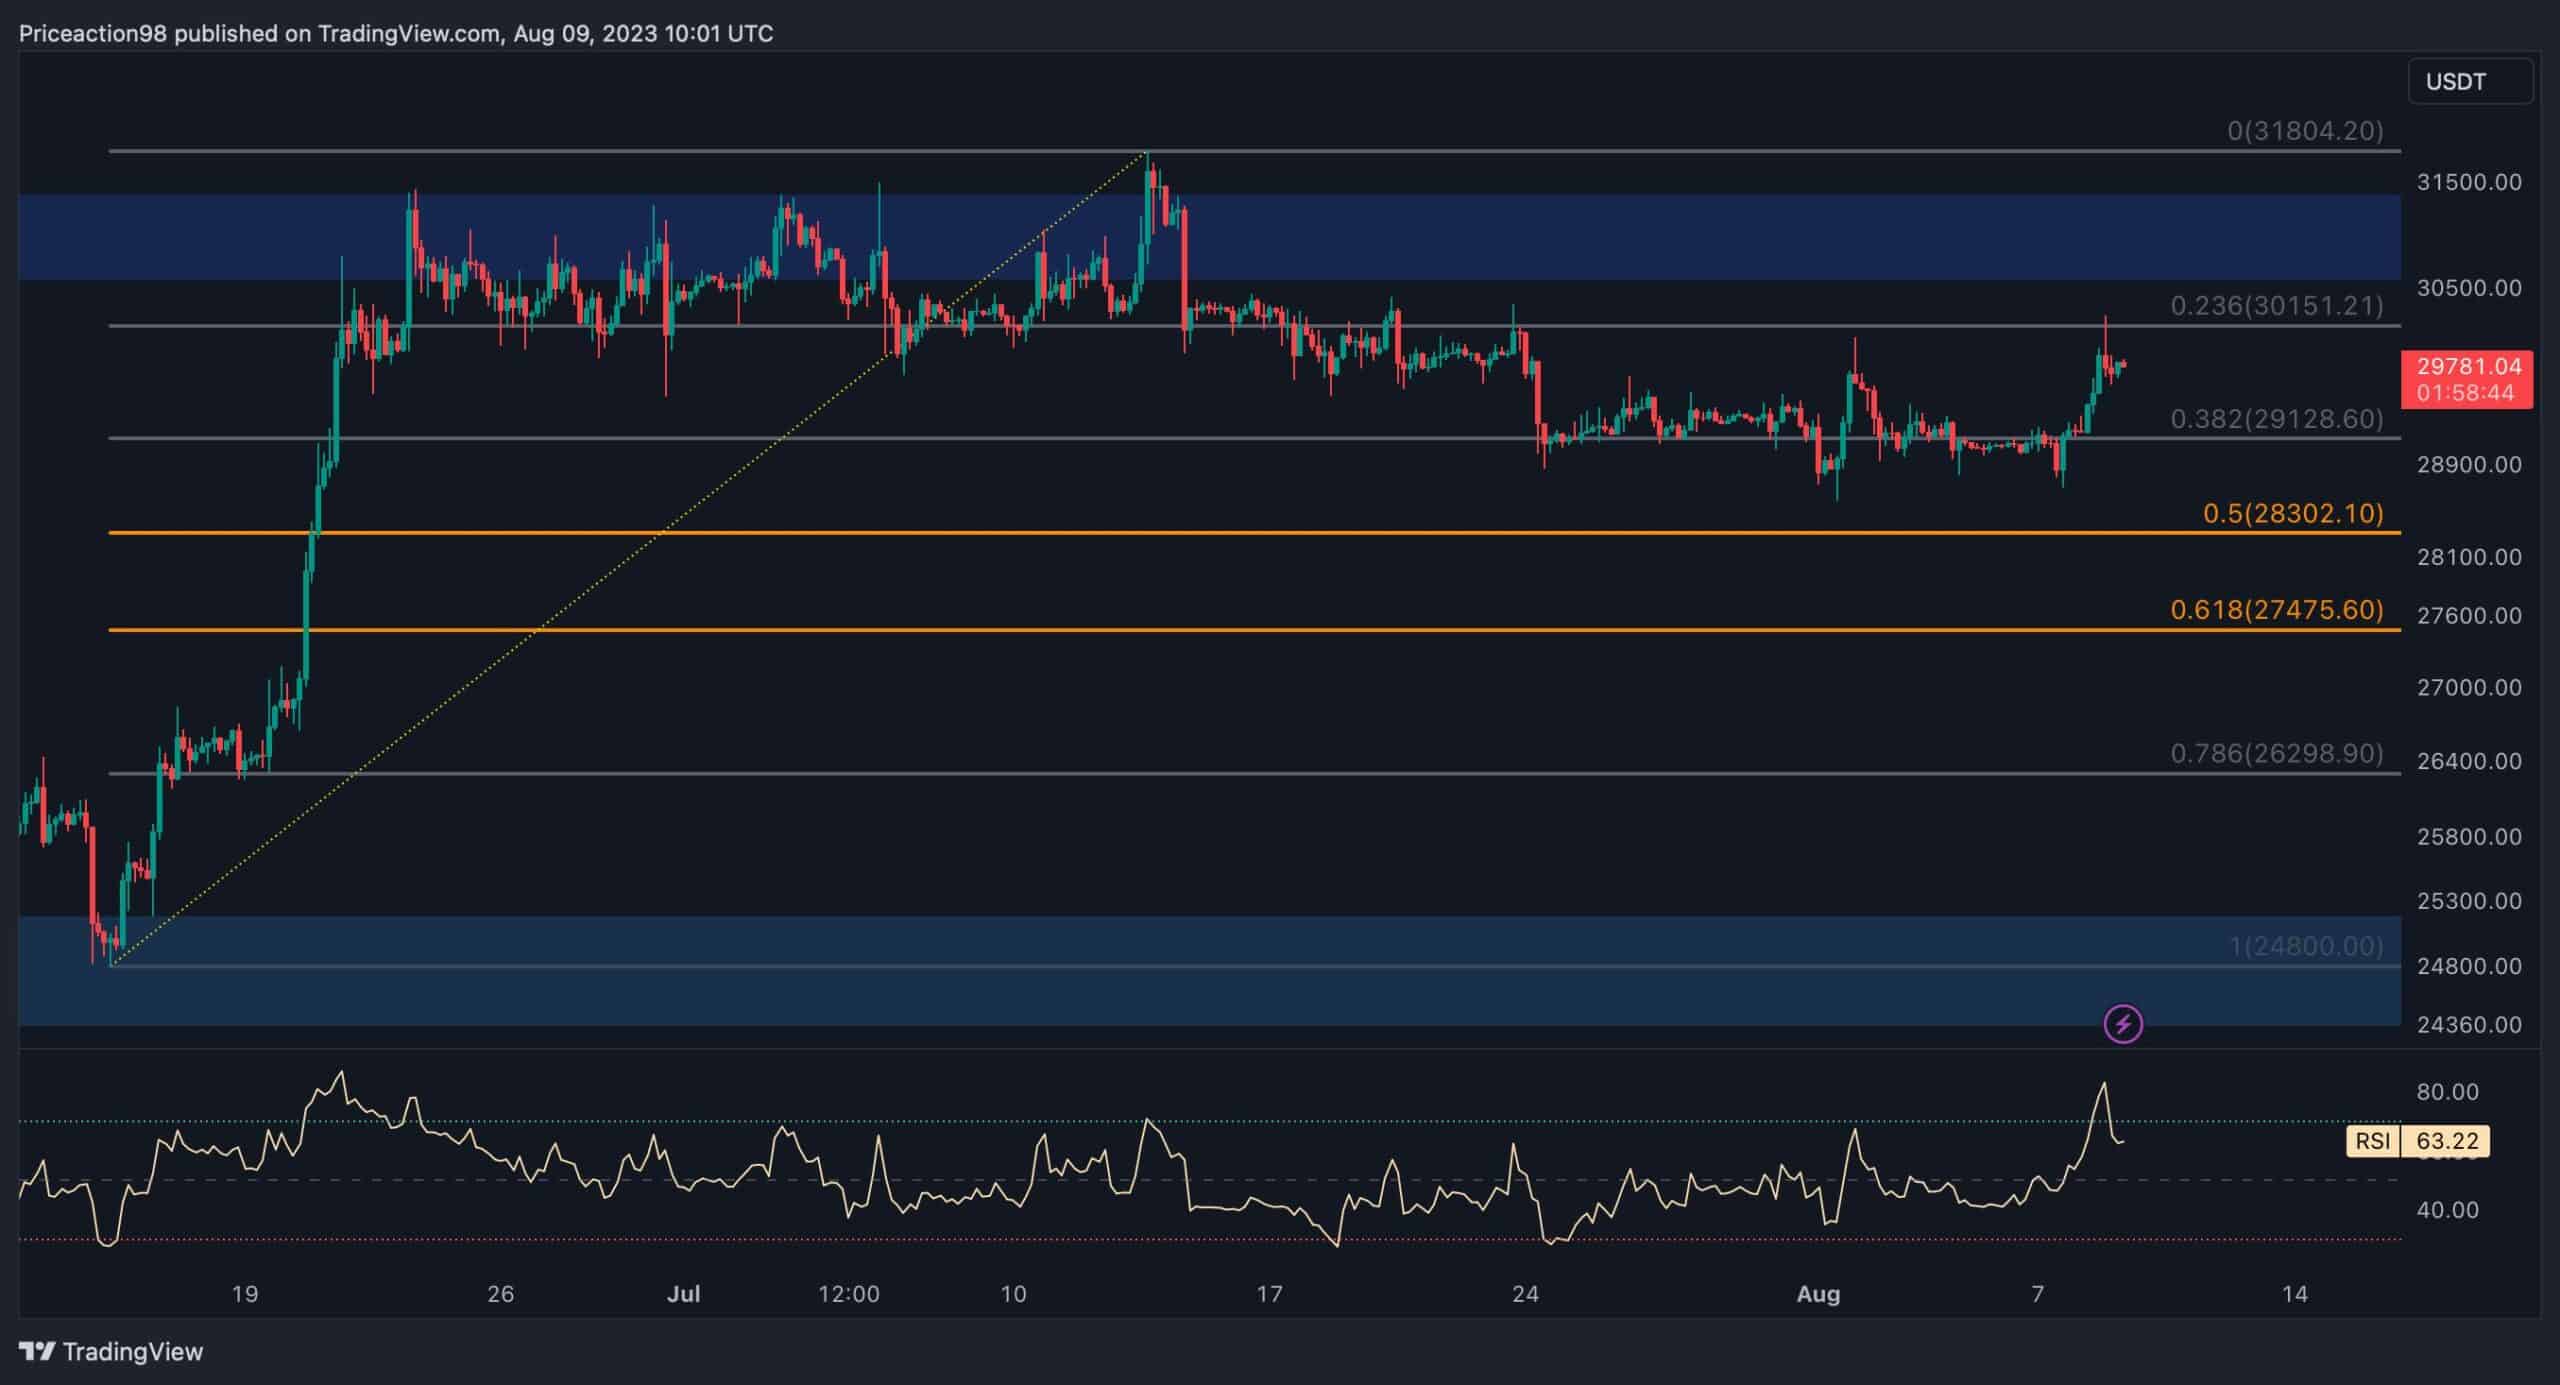
On the 4-hour chart, the price seems to be confined within a static range, fluctuating between resistance at $30K and support at $25K. Nonetheless, BTC came close to the critical 0.382 Fibonacci retracement level and received support, resulting in a slight upswing toward the minor resistance at $29K.
A positive response in this region might pave the way for a fresh bullish phase, propelling the price toward the significant $30K resistance.
However, if the price breaks below the range delineated by the 0.5 and 0.618 Fibonacci levels – a probable target during the ongoing corrective phase – it could lead to a swift descent towards the lower threshold of the range, around $25K.
On-chain Analysis
By Shayan
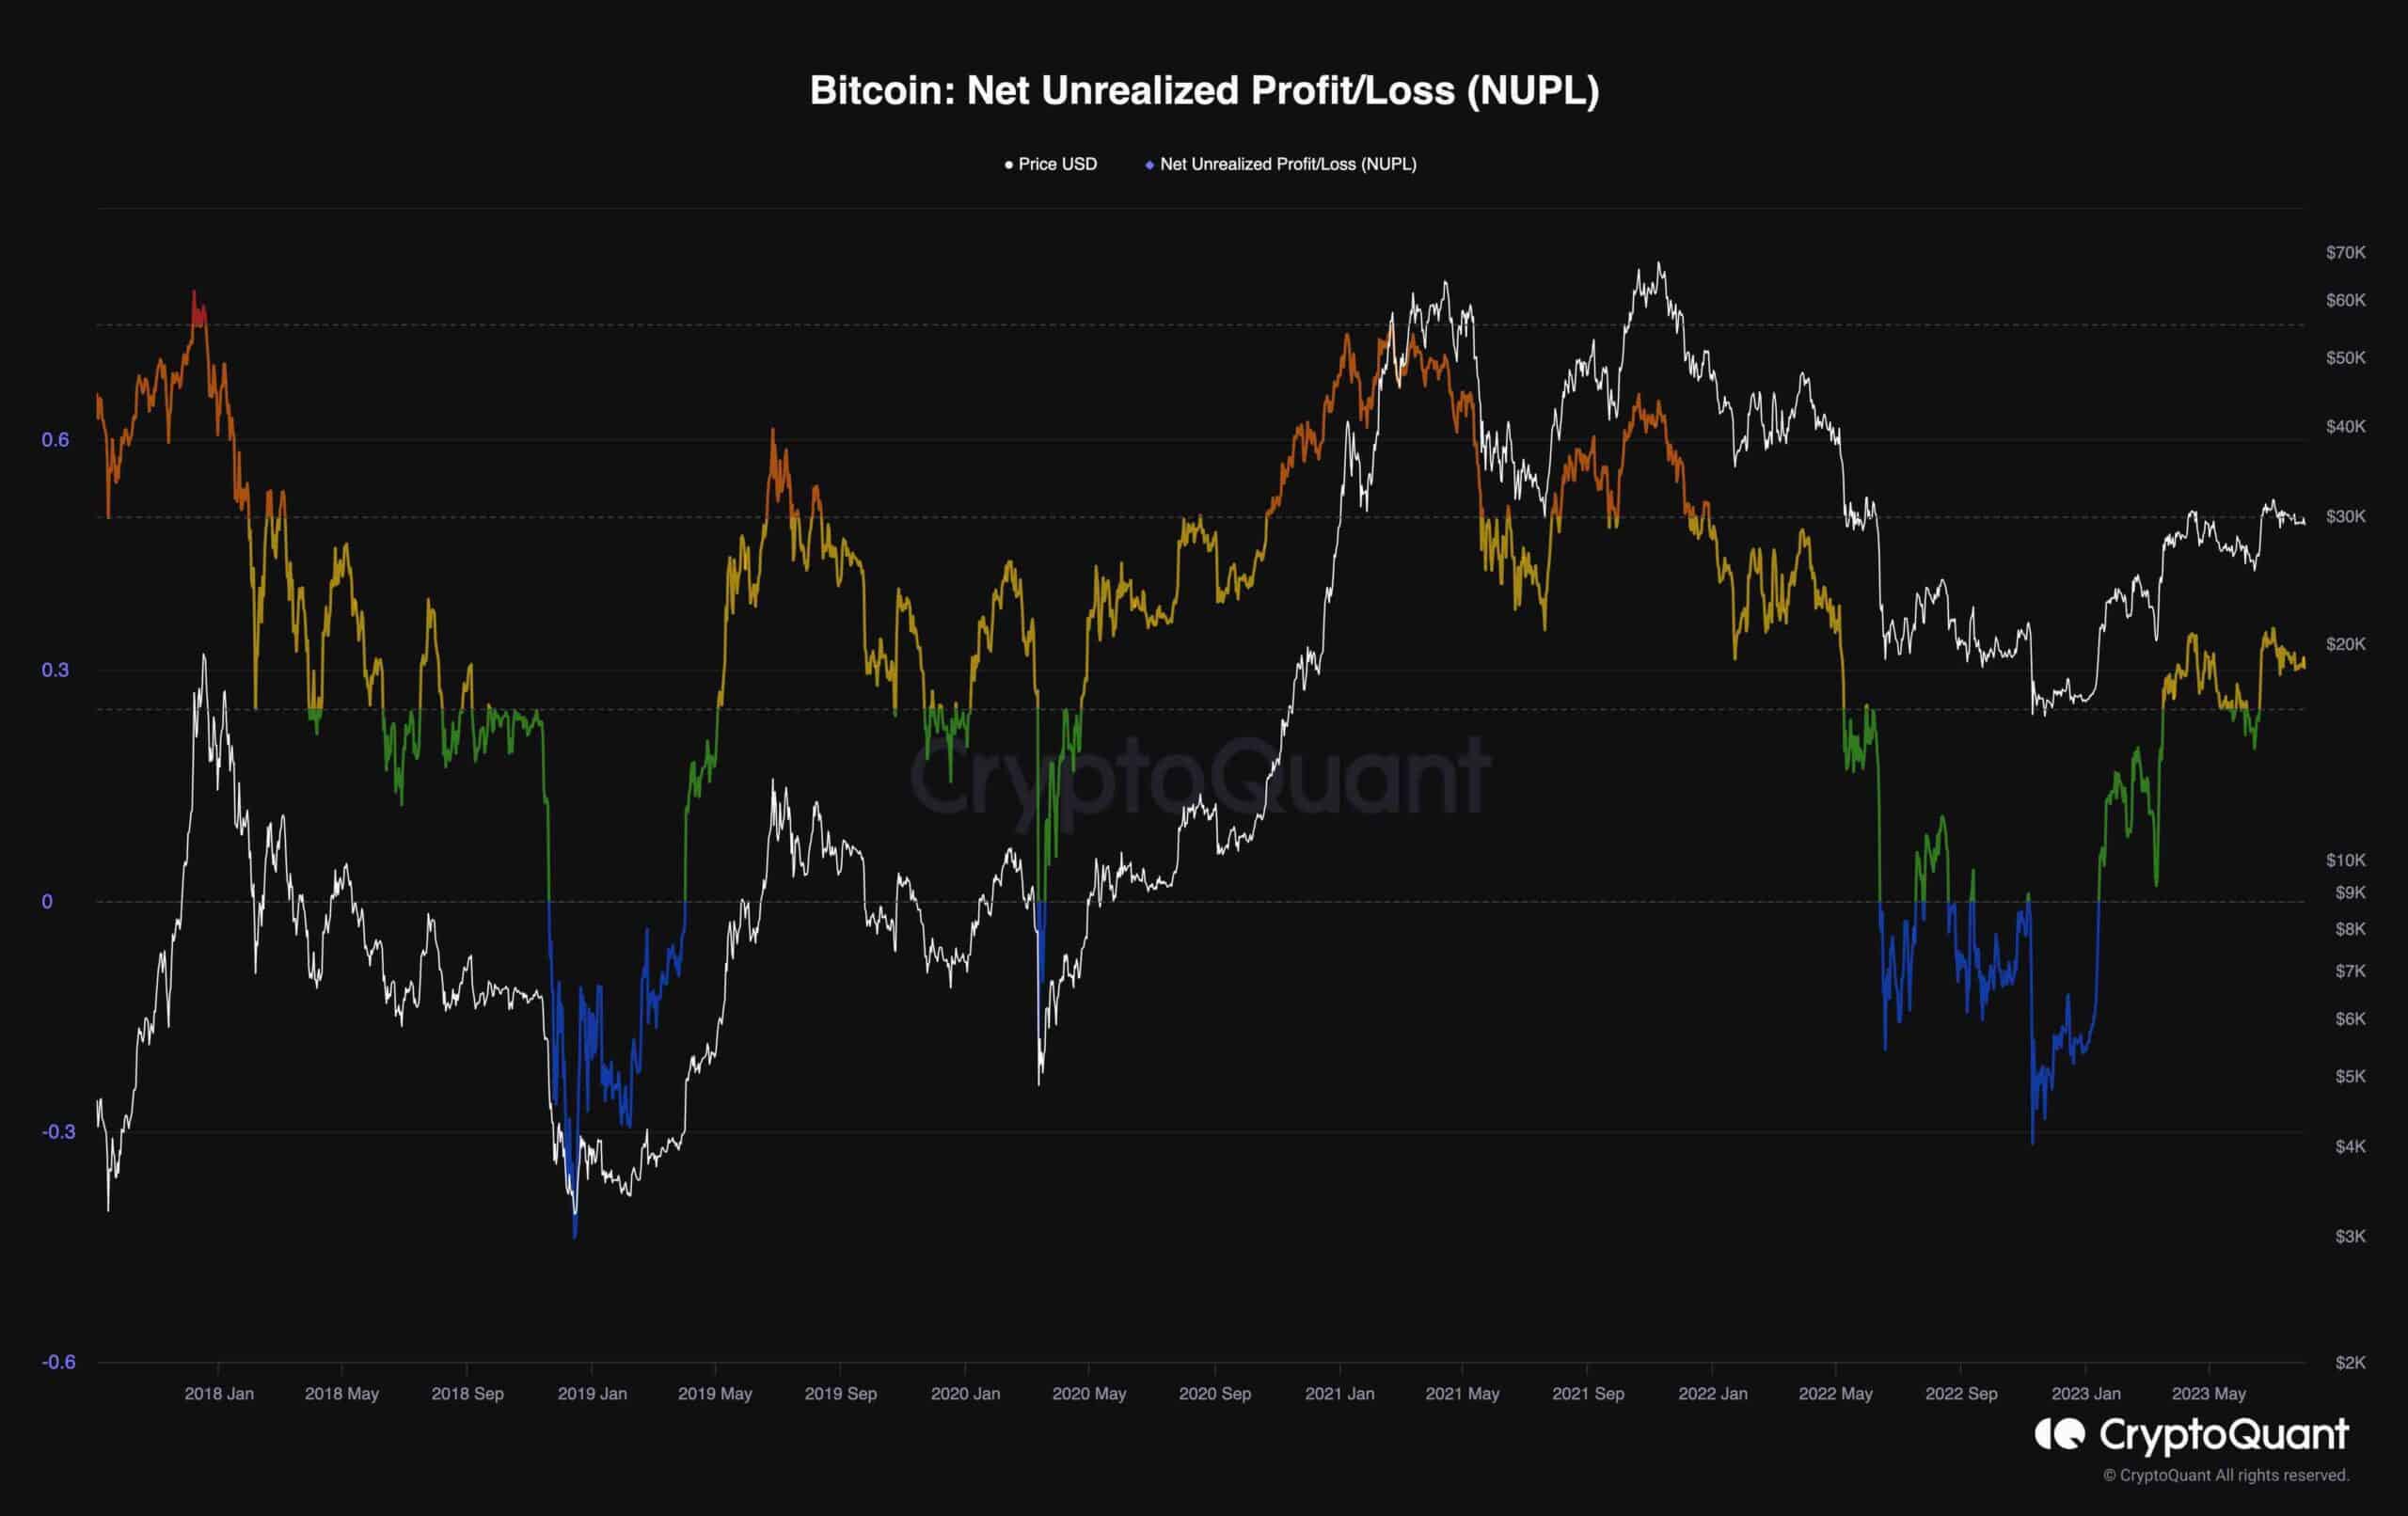
Bitcoin’s price has been on a strong upward trajectory since the beginning of 2023, resulting in optimism among market participants. Displayed on the chart, the NUPL metric illustrates the difference between market capitalization and realized capitalization divided by market capitalization. It functions as a gauge for the proportion of investors currently in a profitable position.
Values above 0 indicate that investors are reaping profits, and a growing trend shows an increasing number of investors entering this profitable state. Given the recent upward movement in the NUPL metric, which has now reached its previous peak from April, this suggests that a larger group of investors is presently enjoying returns. This stands as a notable signal of the predominant optimistic sentiment in the market.
Consequently, if the metric surpasses its previous high concurrently with further appreciation in price, it would trigger heightened buying pressure and firmly establish a distinctly bullish market condition.