Bitcoin’s price has gained significant bullish momentum and recovered from the drop caused by the FTX fallout. Yet, it has reached a robust resistance, and if the bulls push the price above it, a mid-term uptrend will become possible. Technical Analysis By Shayan The Daily Chart Bitcoin’s price continued its rally after overtaking the 50 and 100-day moving averages. It has also surpassed the wedge’s upper trendline reaching a decisive resistance level with considerable momentum. Currently, the market faces the prior major pivot, a critical resistance level of roughly .5K. If Bitcoin successfully surpasses the .5K level, the demand will be more likely to return to the market, and a new rally toward higher price levels may take place. In case of a breakout, the K
Topics:
CryptoVizArt considers the following as important: Bitcoin (BTC) Price, BTC Analysis, BTCEUR, BTCGBP, btcusd, btcusdt
This could be interesting, too:
Chayanika Deka writes XRP, SOL, and ADA Inclusion in US Crypto Reserve Pushes Traders on Edge
Chayanika Deka writes Why Arthur Hayes Is Bullish on Bitcoin Under Trump’s Economic Strategy
Mandy Williams writes Why the Bitcoin Market Is Stuck—and the Key Metric That Could Change It: CryptoQuant CEO
Wayne Jones writes Metaplanet Acquires 156 BTC, Bringing Total Holdings to 2,391
Bitcoin’s price has gained significant bullish momentum and recovered from the drop caused by the FTX fallout. Yet, it has reached a robust resistance, and if the bulls push the price above it, a mid-term uptrend will become possible.
Technical Analysis
By Shayan
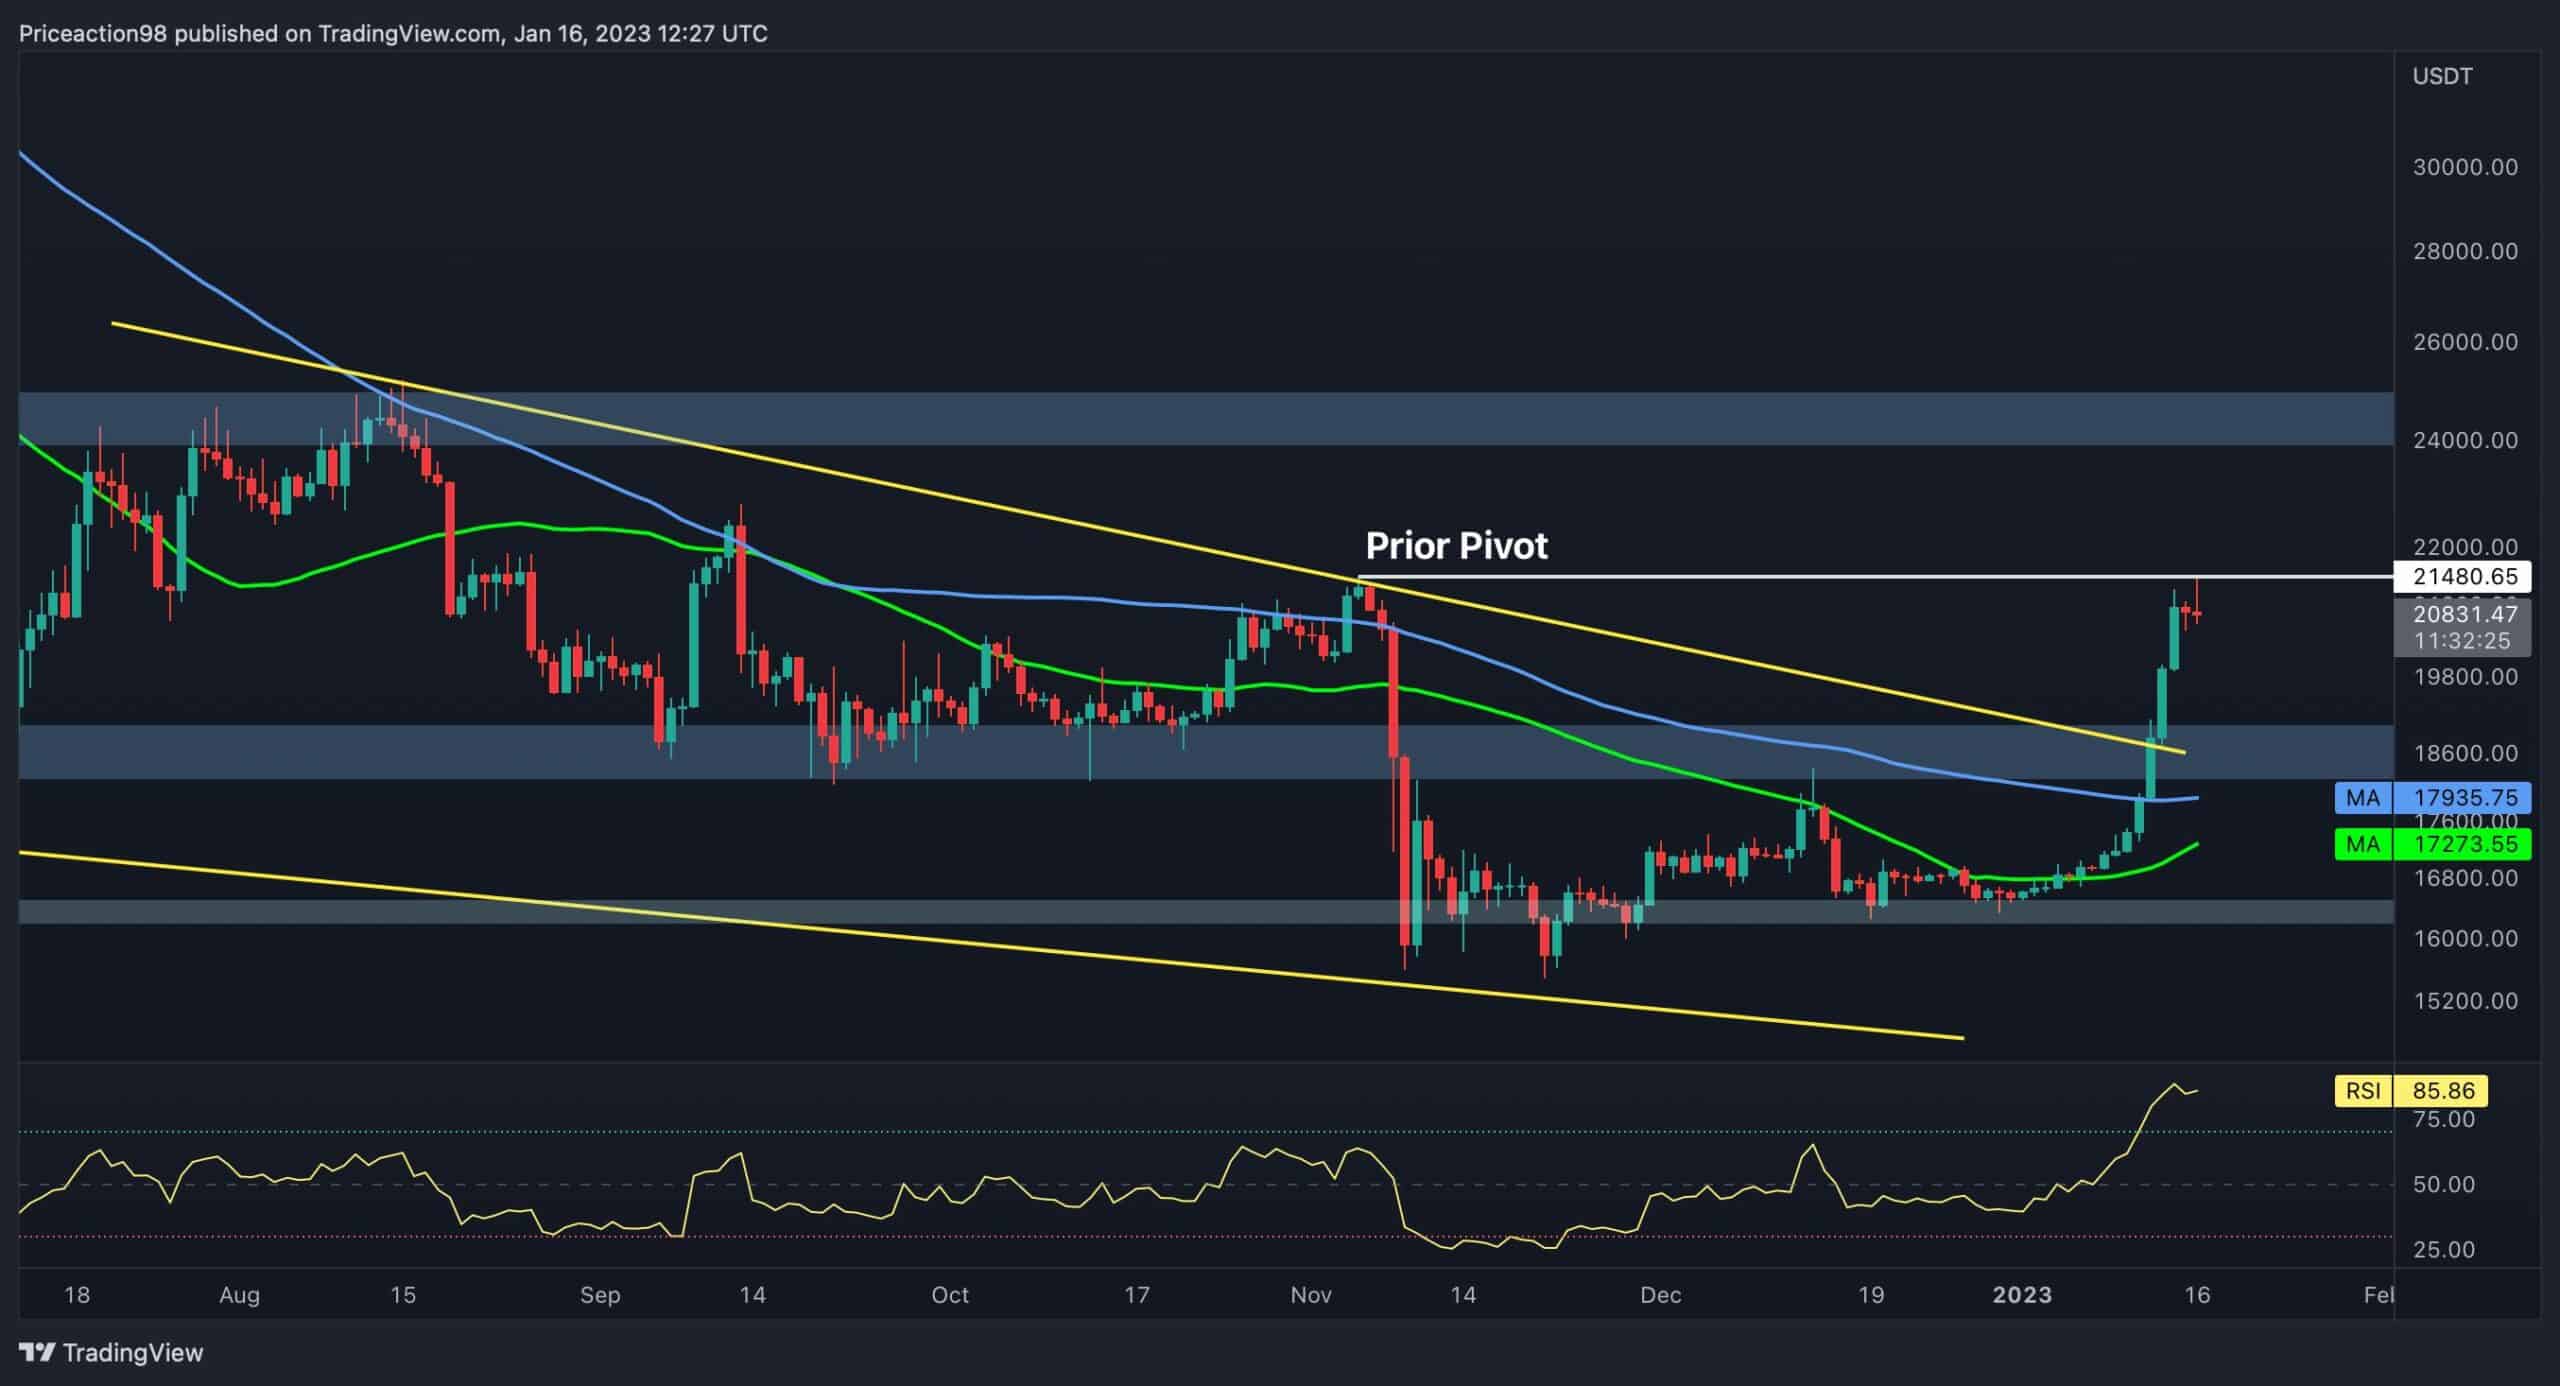
The Daily Chart
Bitcoin’s price continued its rally after overtaking the 50 and 100-day moving averages. It has also surpassed the wedge’s upper trendline reaching a decisive resistance level with considerable momentum. Currently, the market faces the prior major pivot, a critical resistance level of roughly $21.5K.
If Bitcoin successfully surpasses the $21.5K level, the demand will be more likely to return to the market, and a new rally toward higher price levels may take place. In case of a breakout, the $25K price level will be the next barrier on Bitcoin’s path. Yet, the price has been surging impulsively, and it could enter a consolidation stage before the next impulsive rally.
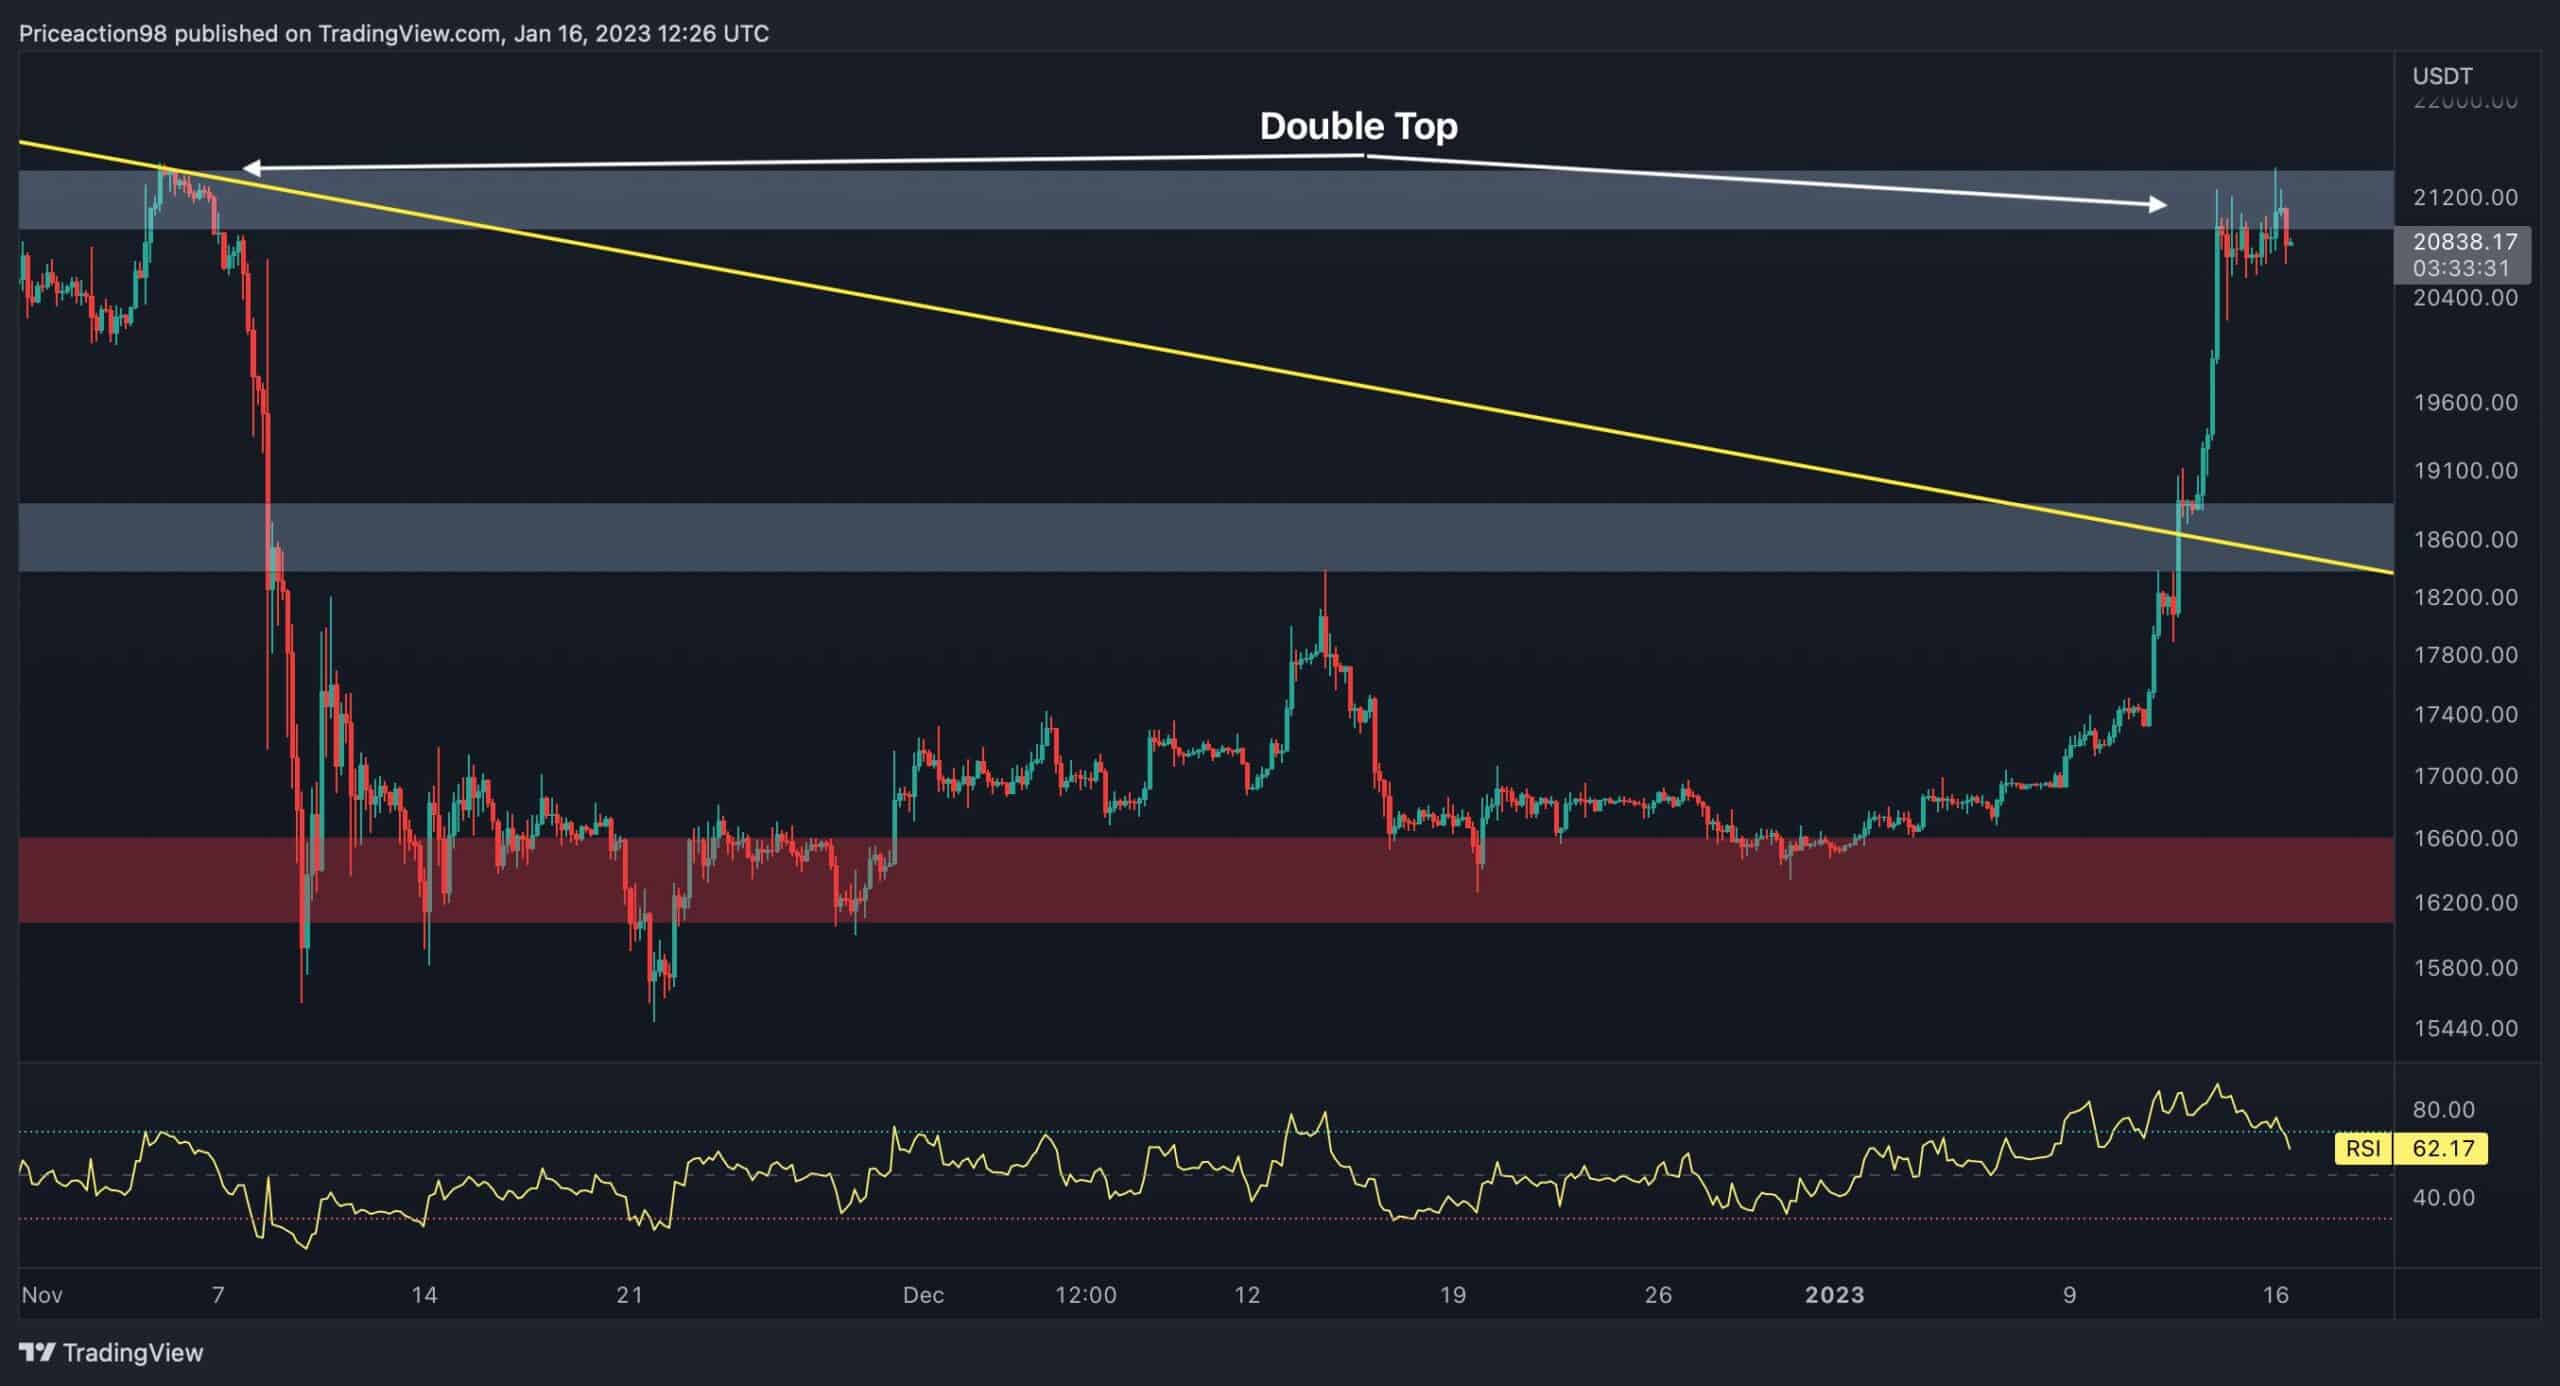
The 4-Hour Chart
In the 4-hour timeframe, it is evident that the price has fully recovered from the FTX crash and reached its prior major daily pivot at $21.5K. Major pivots are crucial levels in classic price action patterns, and moving above them could be a bullish sign of an uptrend.
Meanwhile, the price has formed a double-top reversal pattern, a well-known bearish signal, and if it gets rejected, a leg down will be possible. Hence, considering the importance of this region, the upcoming price action should decide Bitcoin’s path in the mid-term.
On-Chain Analysis
By: Edris
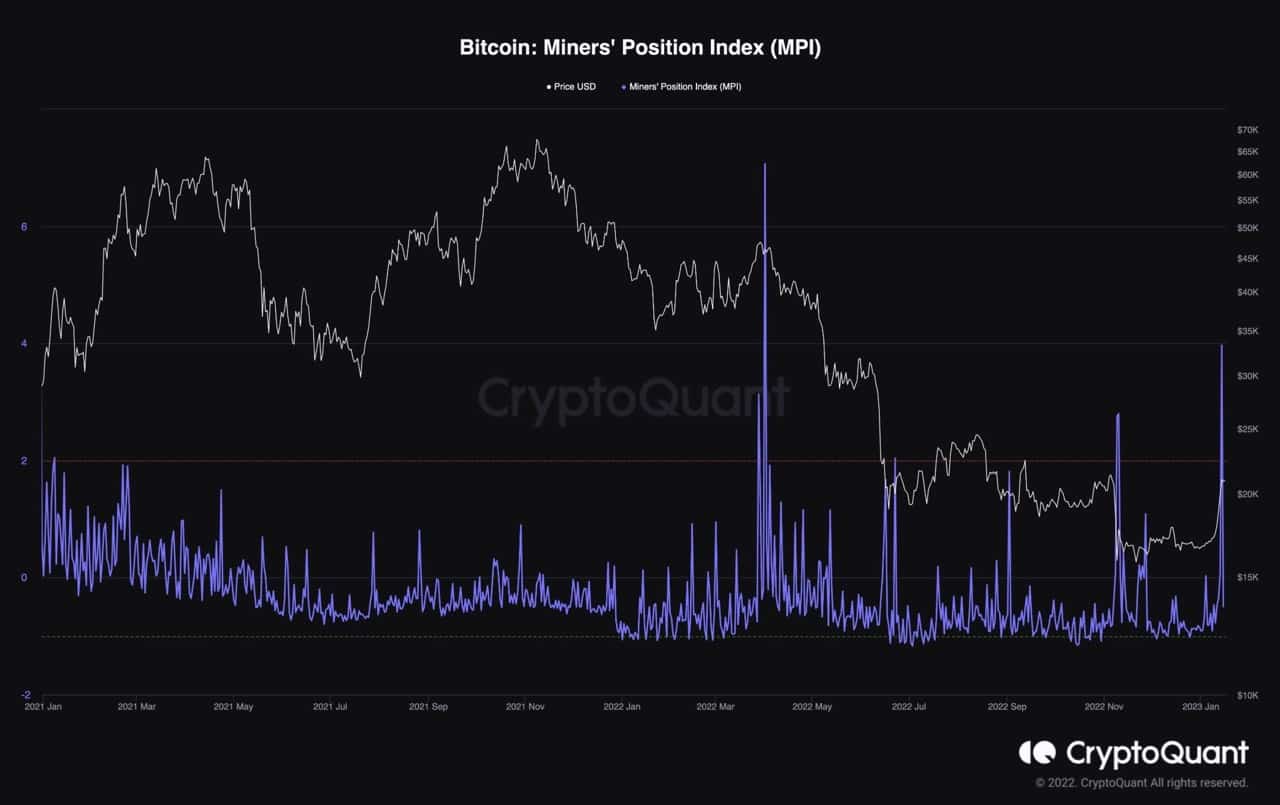
Bitcoin Miners Position Index
Bitcoin’s miners, who may be the most critical players in the network as they provide security and validate transactions, also play a crucial part in the market when it comes to supply and demand. Miners have large bags of BTC, and their selling or hodling affects the asset’s price.
Over the last few months, miners have been distributing rather than accumulating or hodling, as the Bitcoin plunge has put pressure on most of them, forcing their hand to sell their coins to cover their costs of operation and with the recent surge in price, they chose to sell to the strength again.
This behavior is clearly visible on the Miners Position Index with a considerable spike and is very similar to April 2022, when Bitcoin was trading around the $46K mark and then began to fall rapidly. So, investors should be cautious as the bear market may still continue since the recent selling pressure could also lead to another crash in the short term.