Bitcoin’s price has continued trending downward for several weeks, making lower highs and lows. Even so, hope remains that the potential for a bullish rally is not yet over. Technical Analysis By: Edris The Daily Chart On the daily chart, the price has been dropping recently after failing to break through the key K resistance level. The 50-day moving average, located around the K mark, has also been broken to the downside and would act as resistance until the price trades below it. K seems the most likely target in the short term, as it is a strong support level that the bulls could count on. The 200-day moving average, trending around the K level, could also be tested if K were to break down. It’s important to note that while the price is still above the
Topics:
CryptoVizArt considers the following as important: Bitcoin (BTC) Price, BTC Analysis, btcusd, btcusdt
This could be interesting, too:
Chayanika Deka writes XRP, SOL, and ADA Inclusion in US Crypto Reserve Pushes Traders on Edge
Chayanika Deka writes Why Arthur Hayes Is Bullish on Bitcoin Under Trump’s Economic Strategy
Mandy Williams writes Why the Bitcoin Market Is Stuck—and the Key Metric That Could Change It: CryptoQuant CEO
Wayne Jones writes Metaplanet Acquires 156 BTC, Bringing Total Holdings to 2,391
Bitcoin’s price has continued trending downward for several weeks, making lower highs and lows. Even so, hope remains that the potential for a bullish rally is not yet over.
Technical Analysis
By: Edris
The Daily Chart
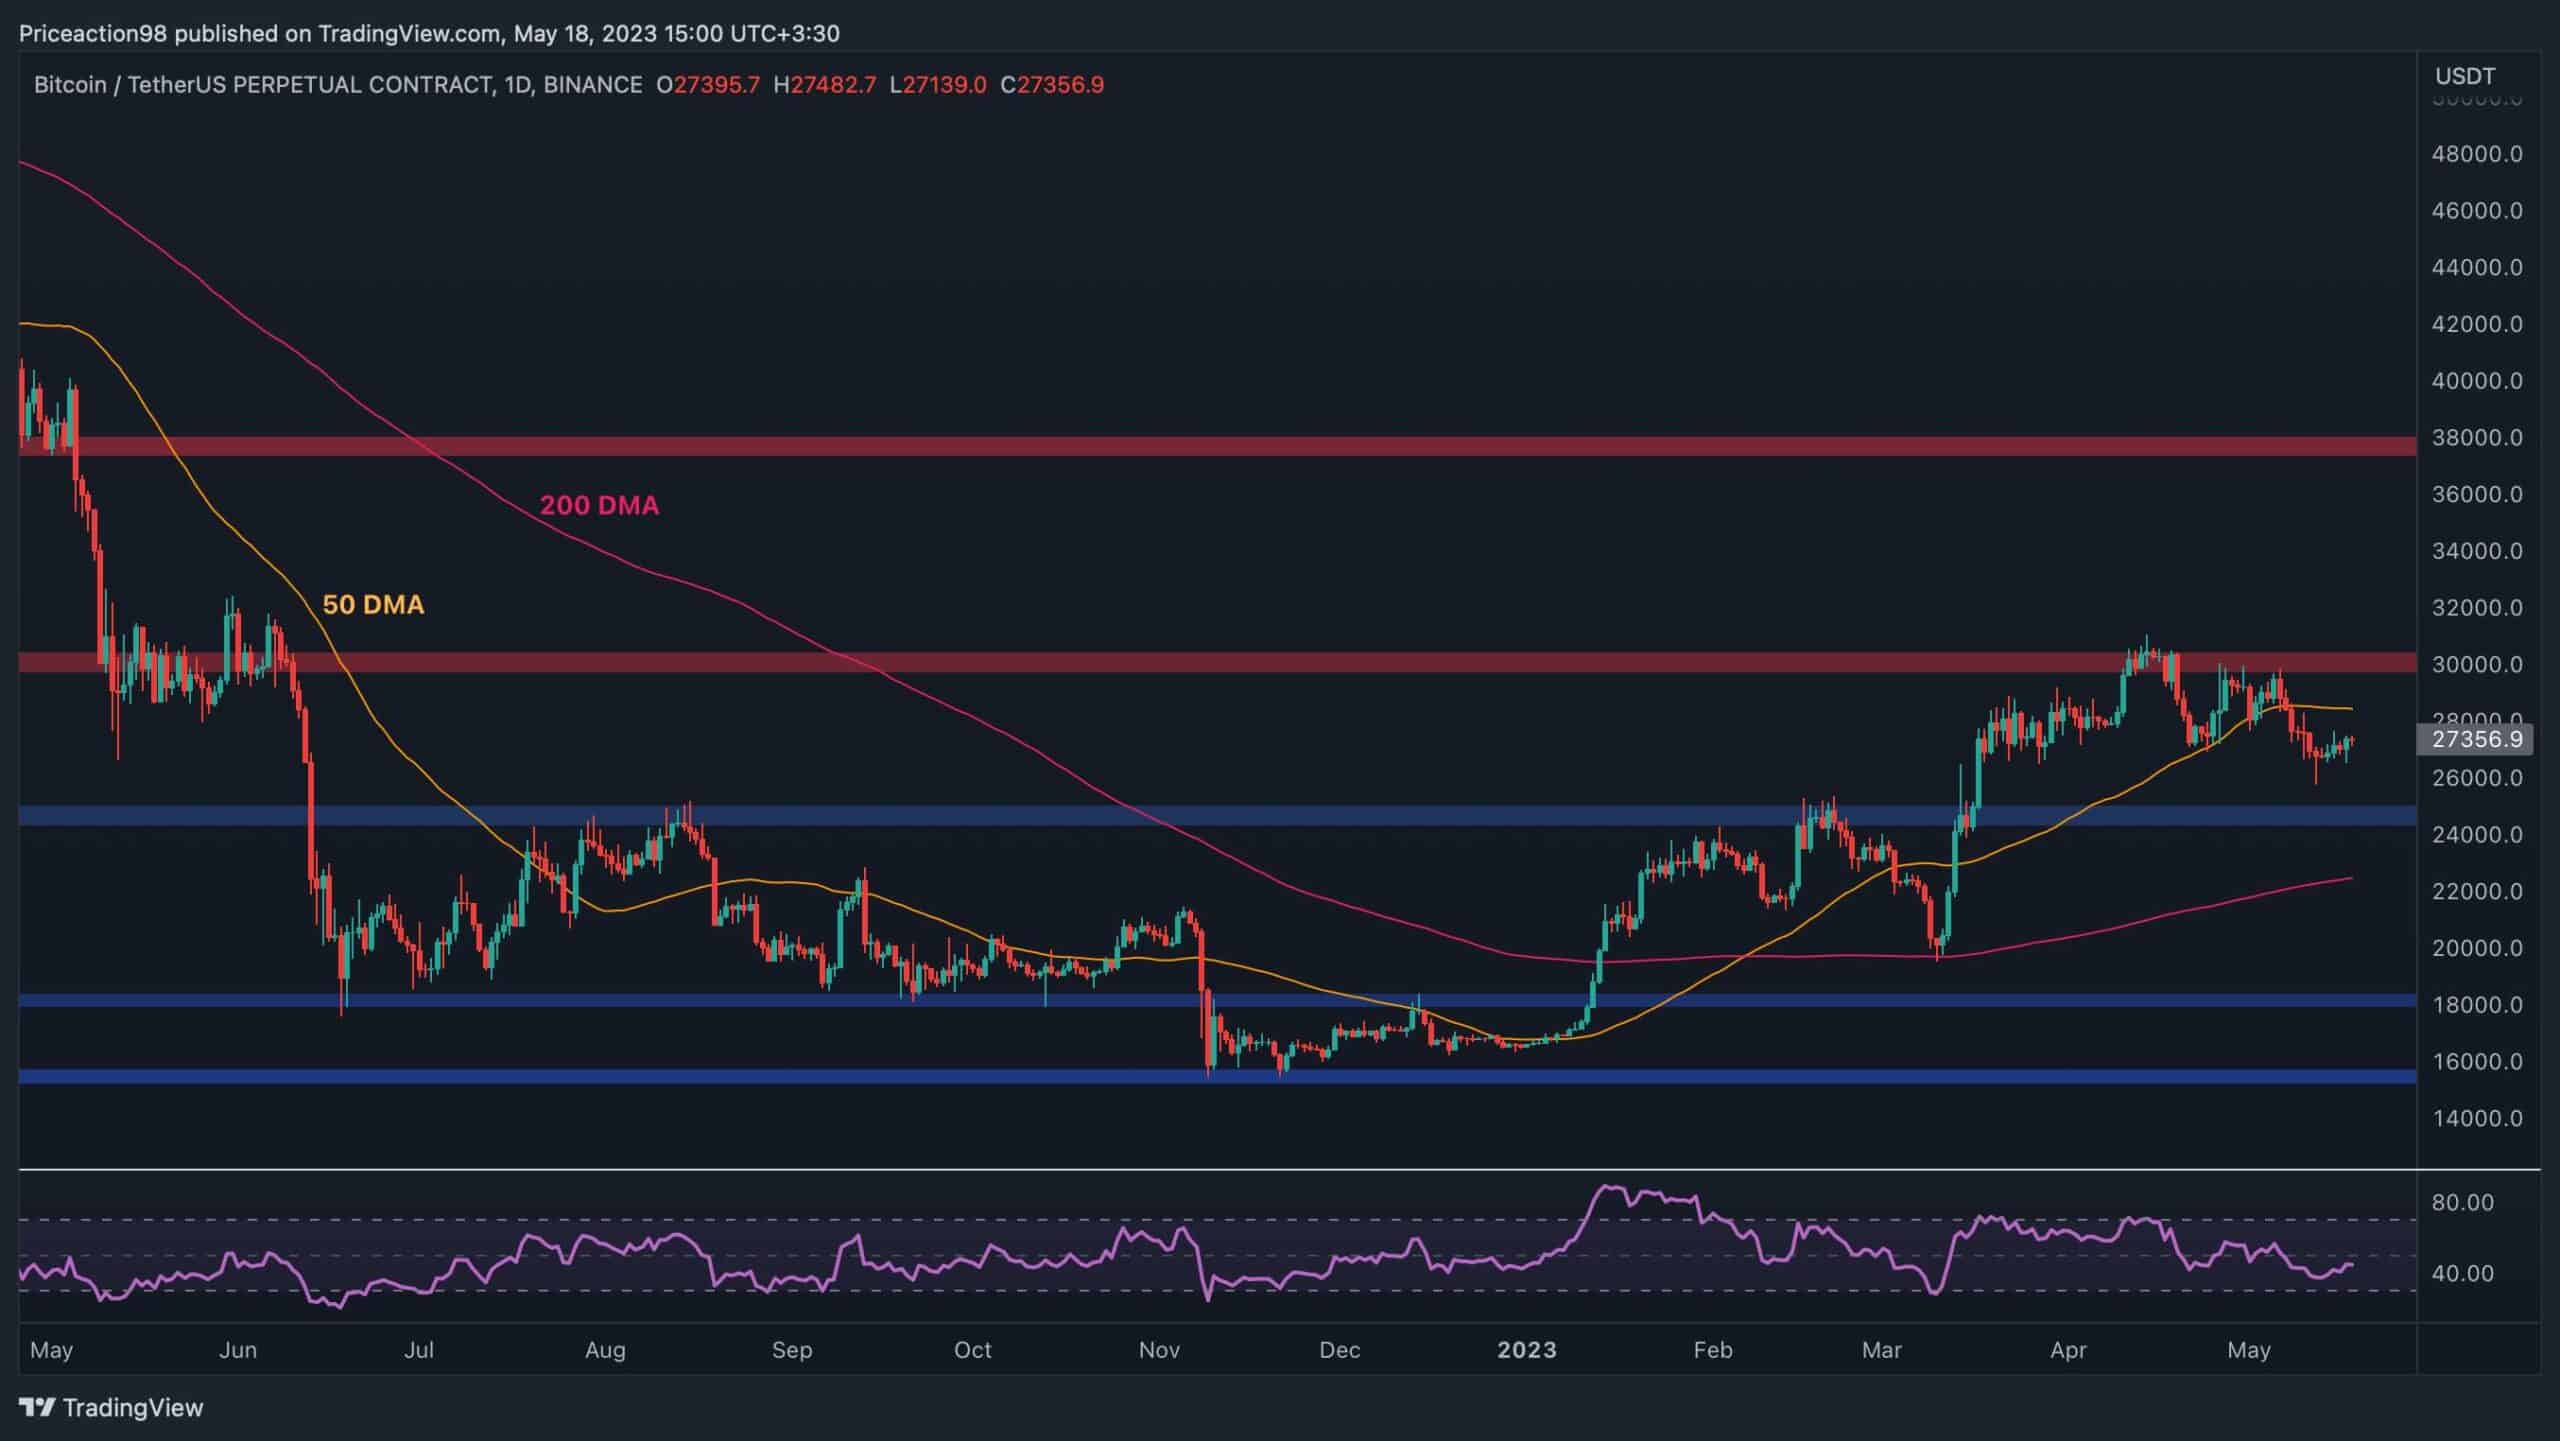
On the daily chart, the price has been dropping recently after failing to break through the key $30K resistance level. The 50-day moving average, located around the $28K mark, has also been broken to the downside and would act as resistance until the price trades below it.
$25K seems the most likely target in the short term, as it is a strong support level that the bulls could count on. The 200-day moving average, trending around the $23K level, could also be tested if $25K were to break down.
It’s important to note that while the price is still above the 200-day moving average, it is technically considered a bull market.
The 4-Hour Chart
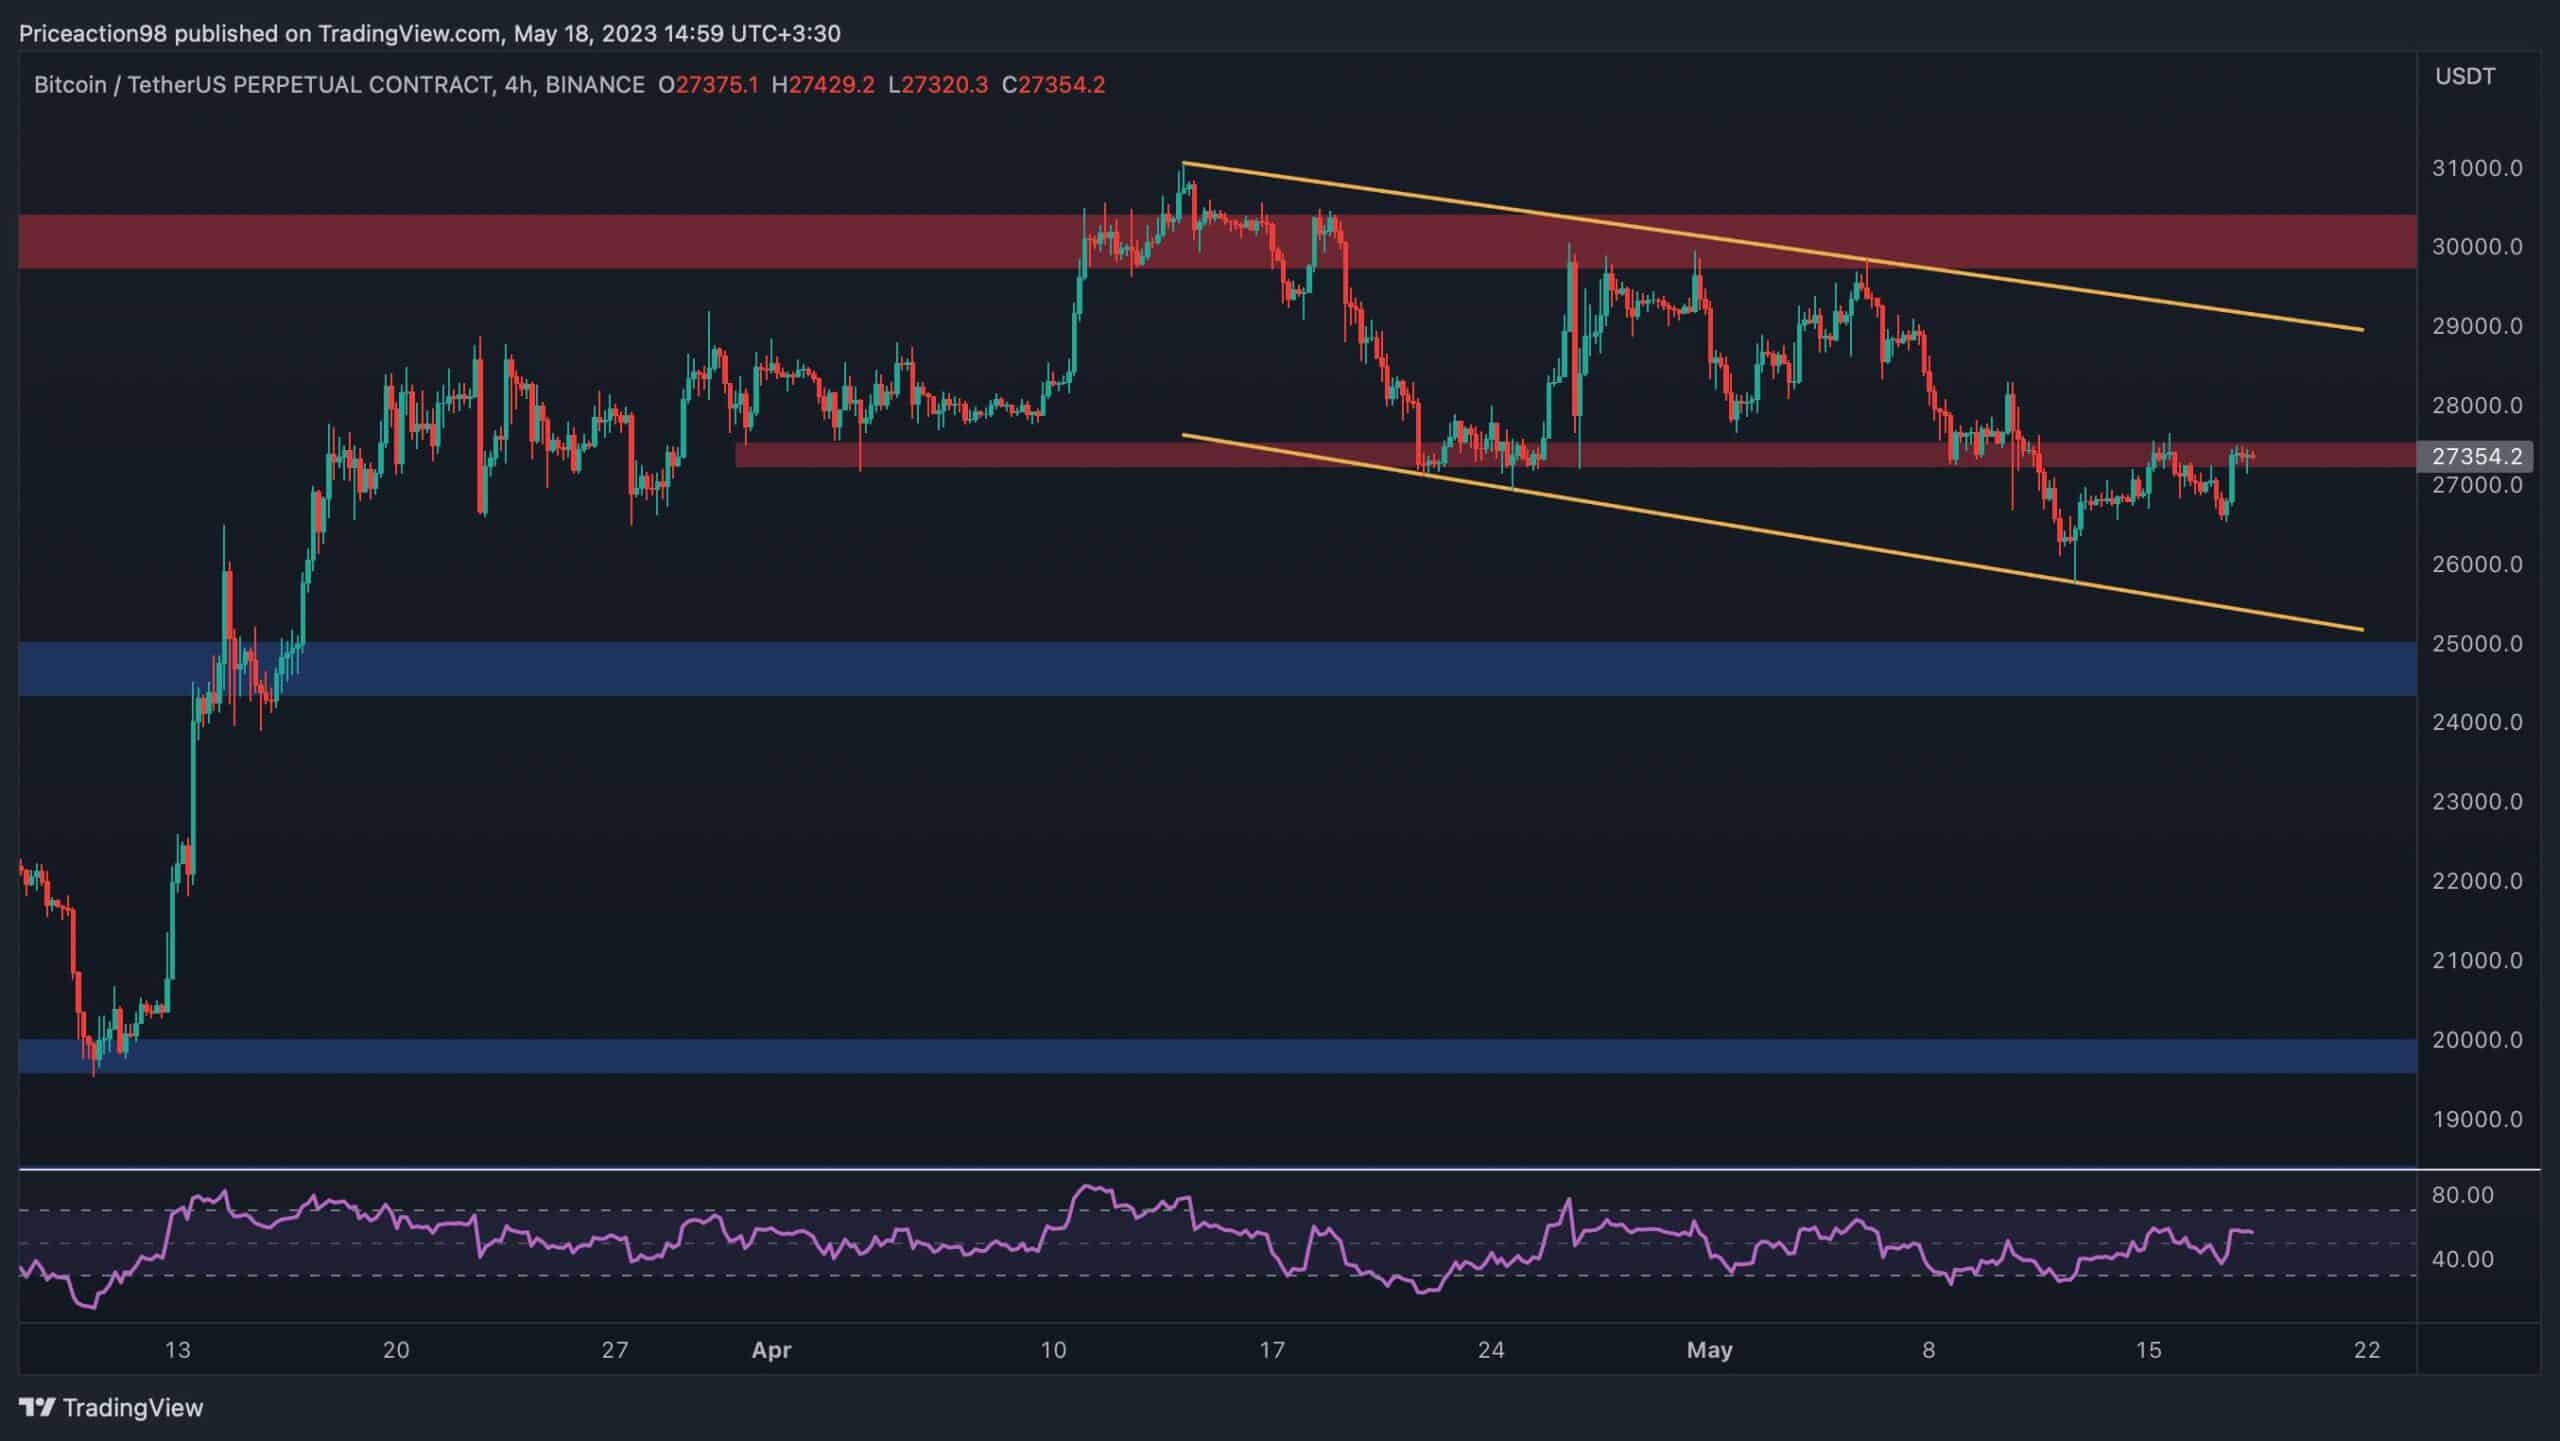
Looking at the 4-hour chart, the price has been gradually declining, forming a large bullish flag below the $30K mark. These patterns are generally known as bullish continuation patterns if the price breaks them to the upside.
Bitcoin is currently testing the $27,500 resistance level. However, due to the recent rejection from this same level, it is likely that the lower boundary of the pattern could be tested once more in the coming weeks.
A bearish breakout from this channel and the $25K support level would be disastrous for BTC holders, as the market could free-fall toward the $20K mark in a short amount of time.
Onchain Analysis
By Shayan
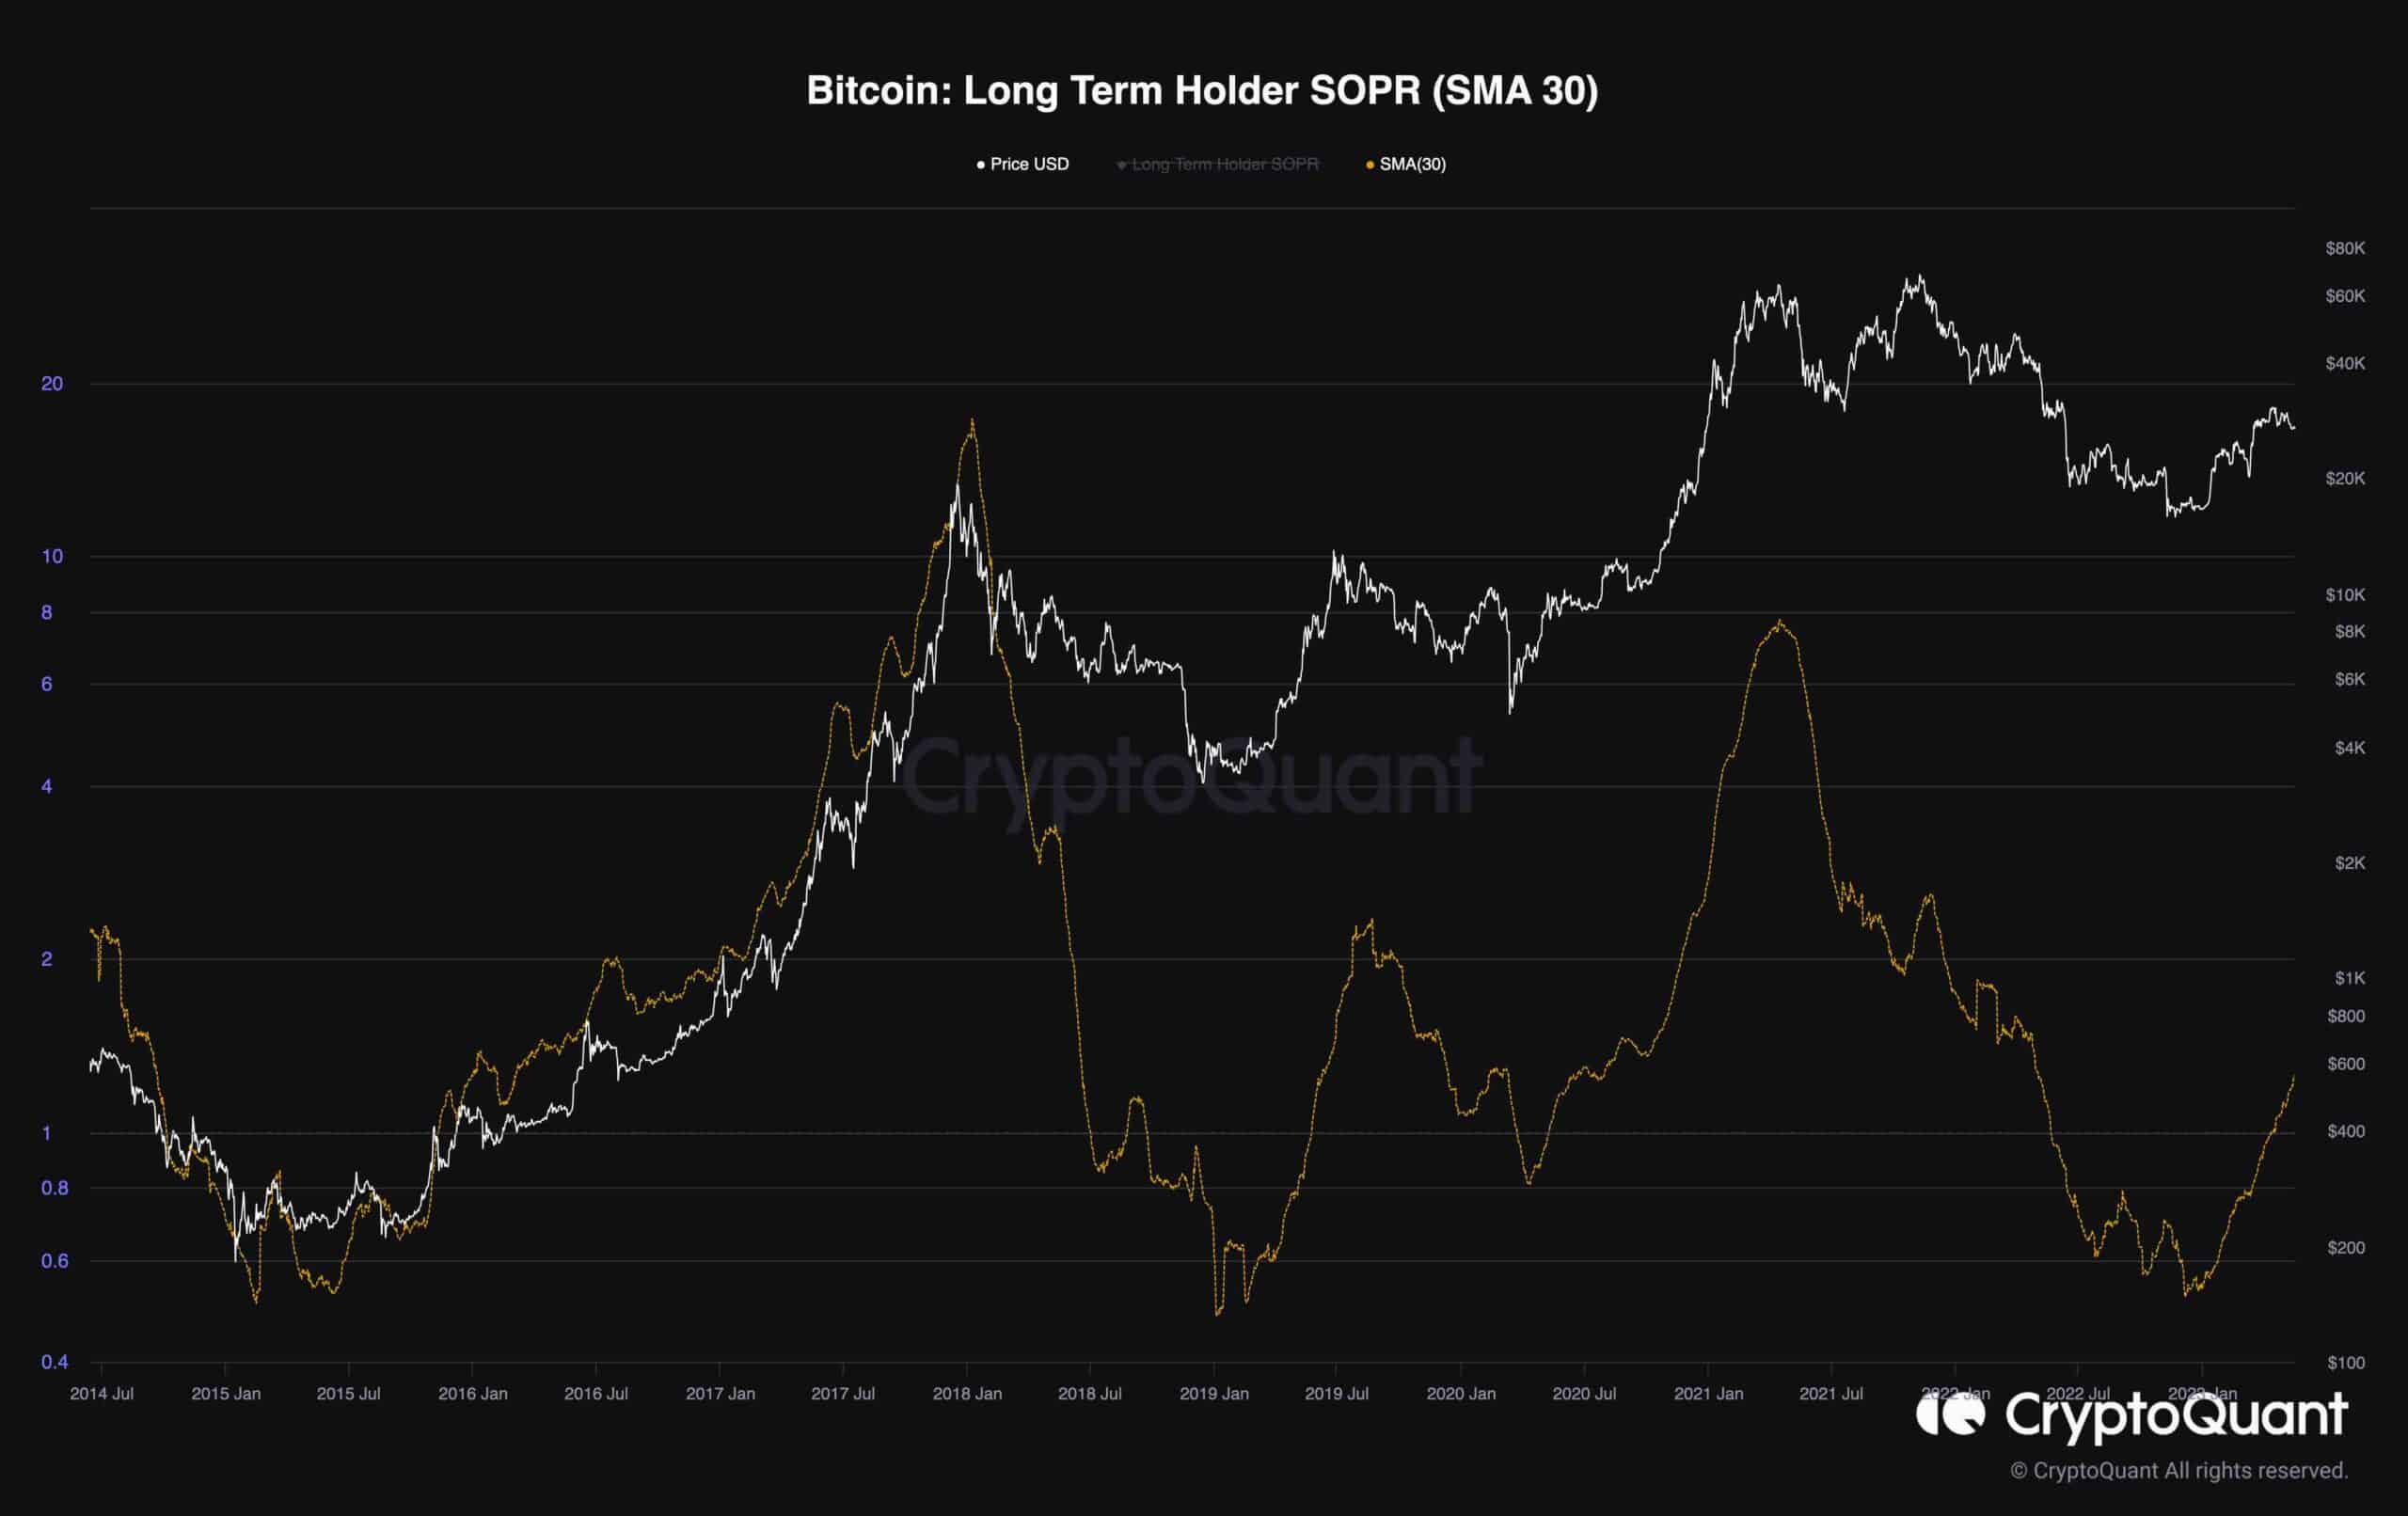
The spending patterns of inactive coins that have been dormant for over 155 days often reveal significant trends in Bitcoin’s long-term prospects. By examining the Long-Term Holder Spent Output Profit Ratio (SOPR) through monthly averages, we can identify extreme spending points that coincide with the initial phases of a bullish market.
The accompanying chart clearly illustrates how the metric has surpassed a value of one, indicating that long-term holders are realizing profits. Such events typically transpire during the early stages of Bitcoin’s bull runs.
It’s important to emphasize that this indicator primarily reflects long-term cycles, which typically take over months or even years before reaching extremes, and does not capture short-term fluctuations.