Bitcoin’s price surge has come to a halt following a consistent rally over the last couple of months. Investors and traders are uncertain whether the trend is about to reverse or is only going through a short-term consolidation. Technical Analysis By TradingRage Bitcoin Price Analysis: The Daily Chart On the daily chart, the price has been making higher highs and lows since the rebound from the K level back in March. Several resistance levels have been broken to the upside. Meanwhile, BTC is struggling to reach the critical K level and is demonstrating range-bound movement. It is also trending way above the 200-day moving average, located around the K mark. Therefore, a consolidation or even a correction seems probable for the 200-day moving average to catch up.
Topics:
CryptoVizArt considers the following as important: Bitcoin (BTC) Price, BTC Analysis, BTCEUR, BTCGBP, btcusd, btcusdt
This could be interesting, too:
Chayanika Deka writes XRP, SOL, and ADA Inclusion in US Crypto Reserve Pushes Traders on Edge
Chayanika Deka writes Why Arthur Hayes Is Bullish on Bitcoin Under Trump’s Economic Strategy
Mandy Williams writes Why the Bitcoin Market Is Stuck—and the Key Metric That Could Change It: CryptoQuant CEO
Wayne Jones writes Metaplanet Acquires 156 BTC, Bringing Total Holdings to 2,391
Bitcoin’s price surge has come to a halt following a consistent rally over the last couple of months. Investors and traders are uncertain whether the trend is about to reverse or is only going through a short-term consolidation.
Technical Analysis
By TradingRage
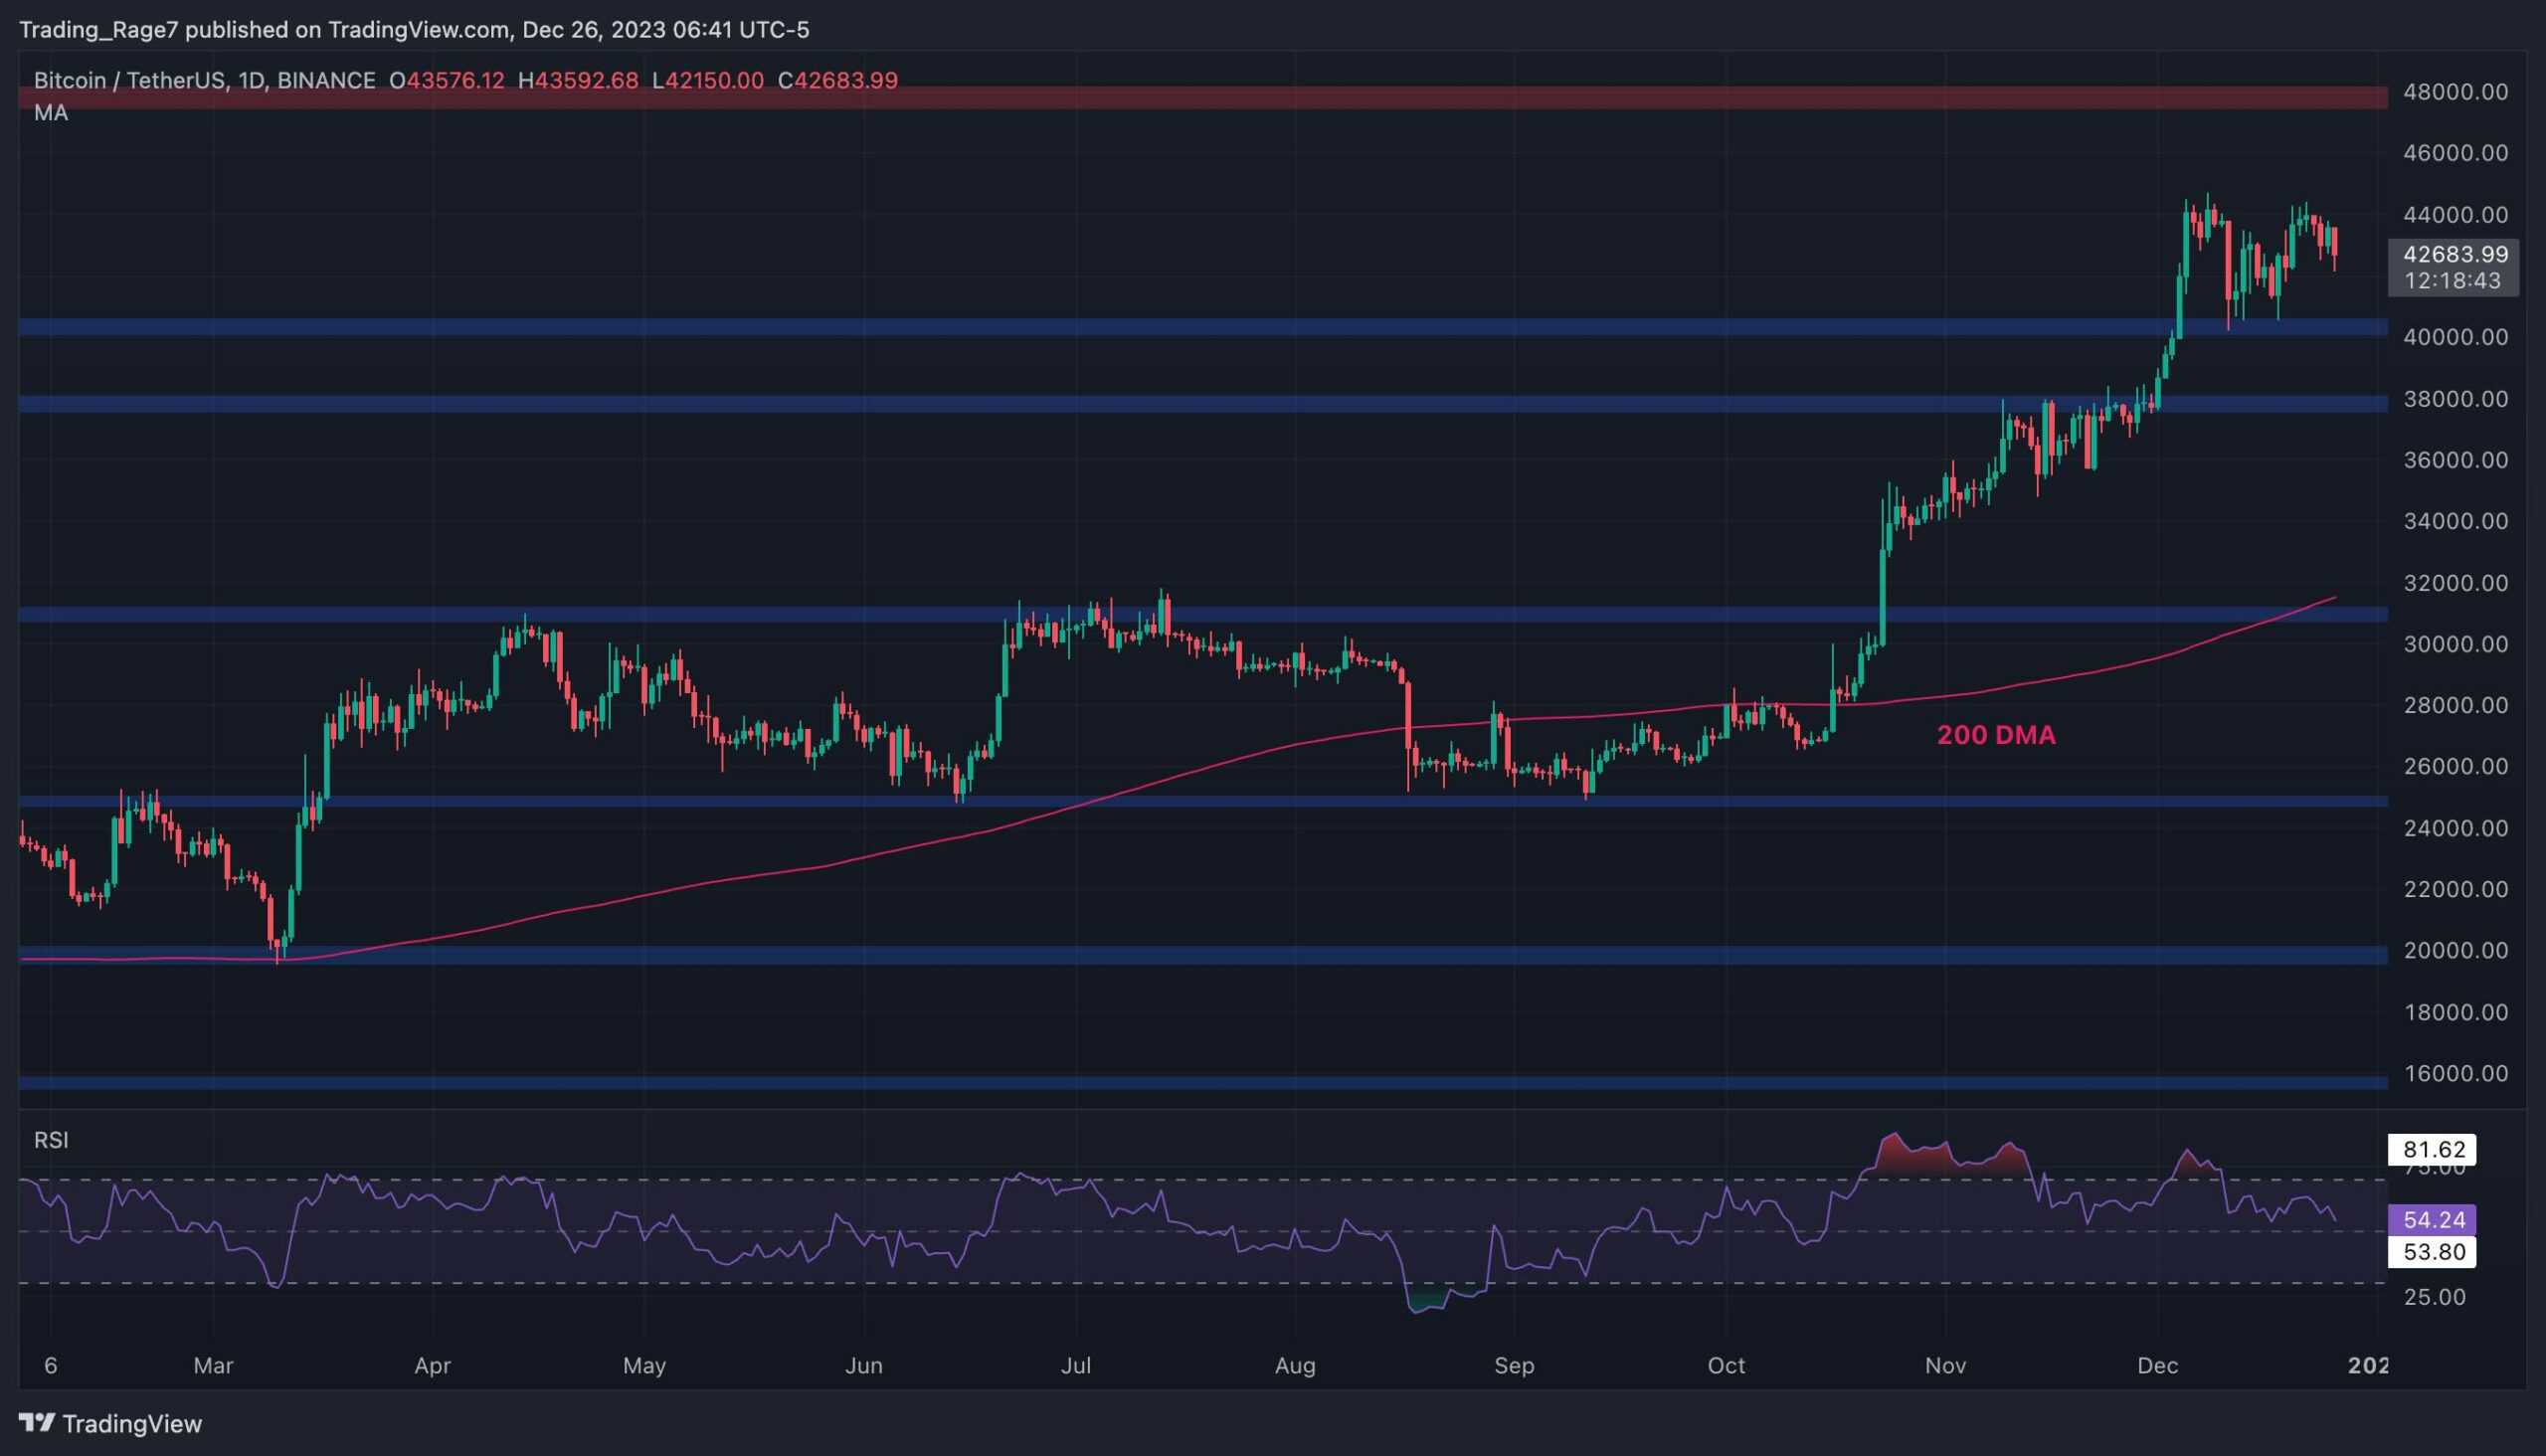
Bitcoin Price Analysis: The Daily Chart
On the daily chart, the price has been making higher highs and lows since the rebound from the $20K level back in March. Several resistance levels have been broken to the upside. Meanwhile, BTC is struggling to reach the critical $48K level and is demonstrating range-bound movement.
It is also trending way above the 200-day moving average, located around the $32K mark. Therefore, a consolidation or even a correction seems probable for the 200-day moving average to catch up.
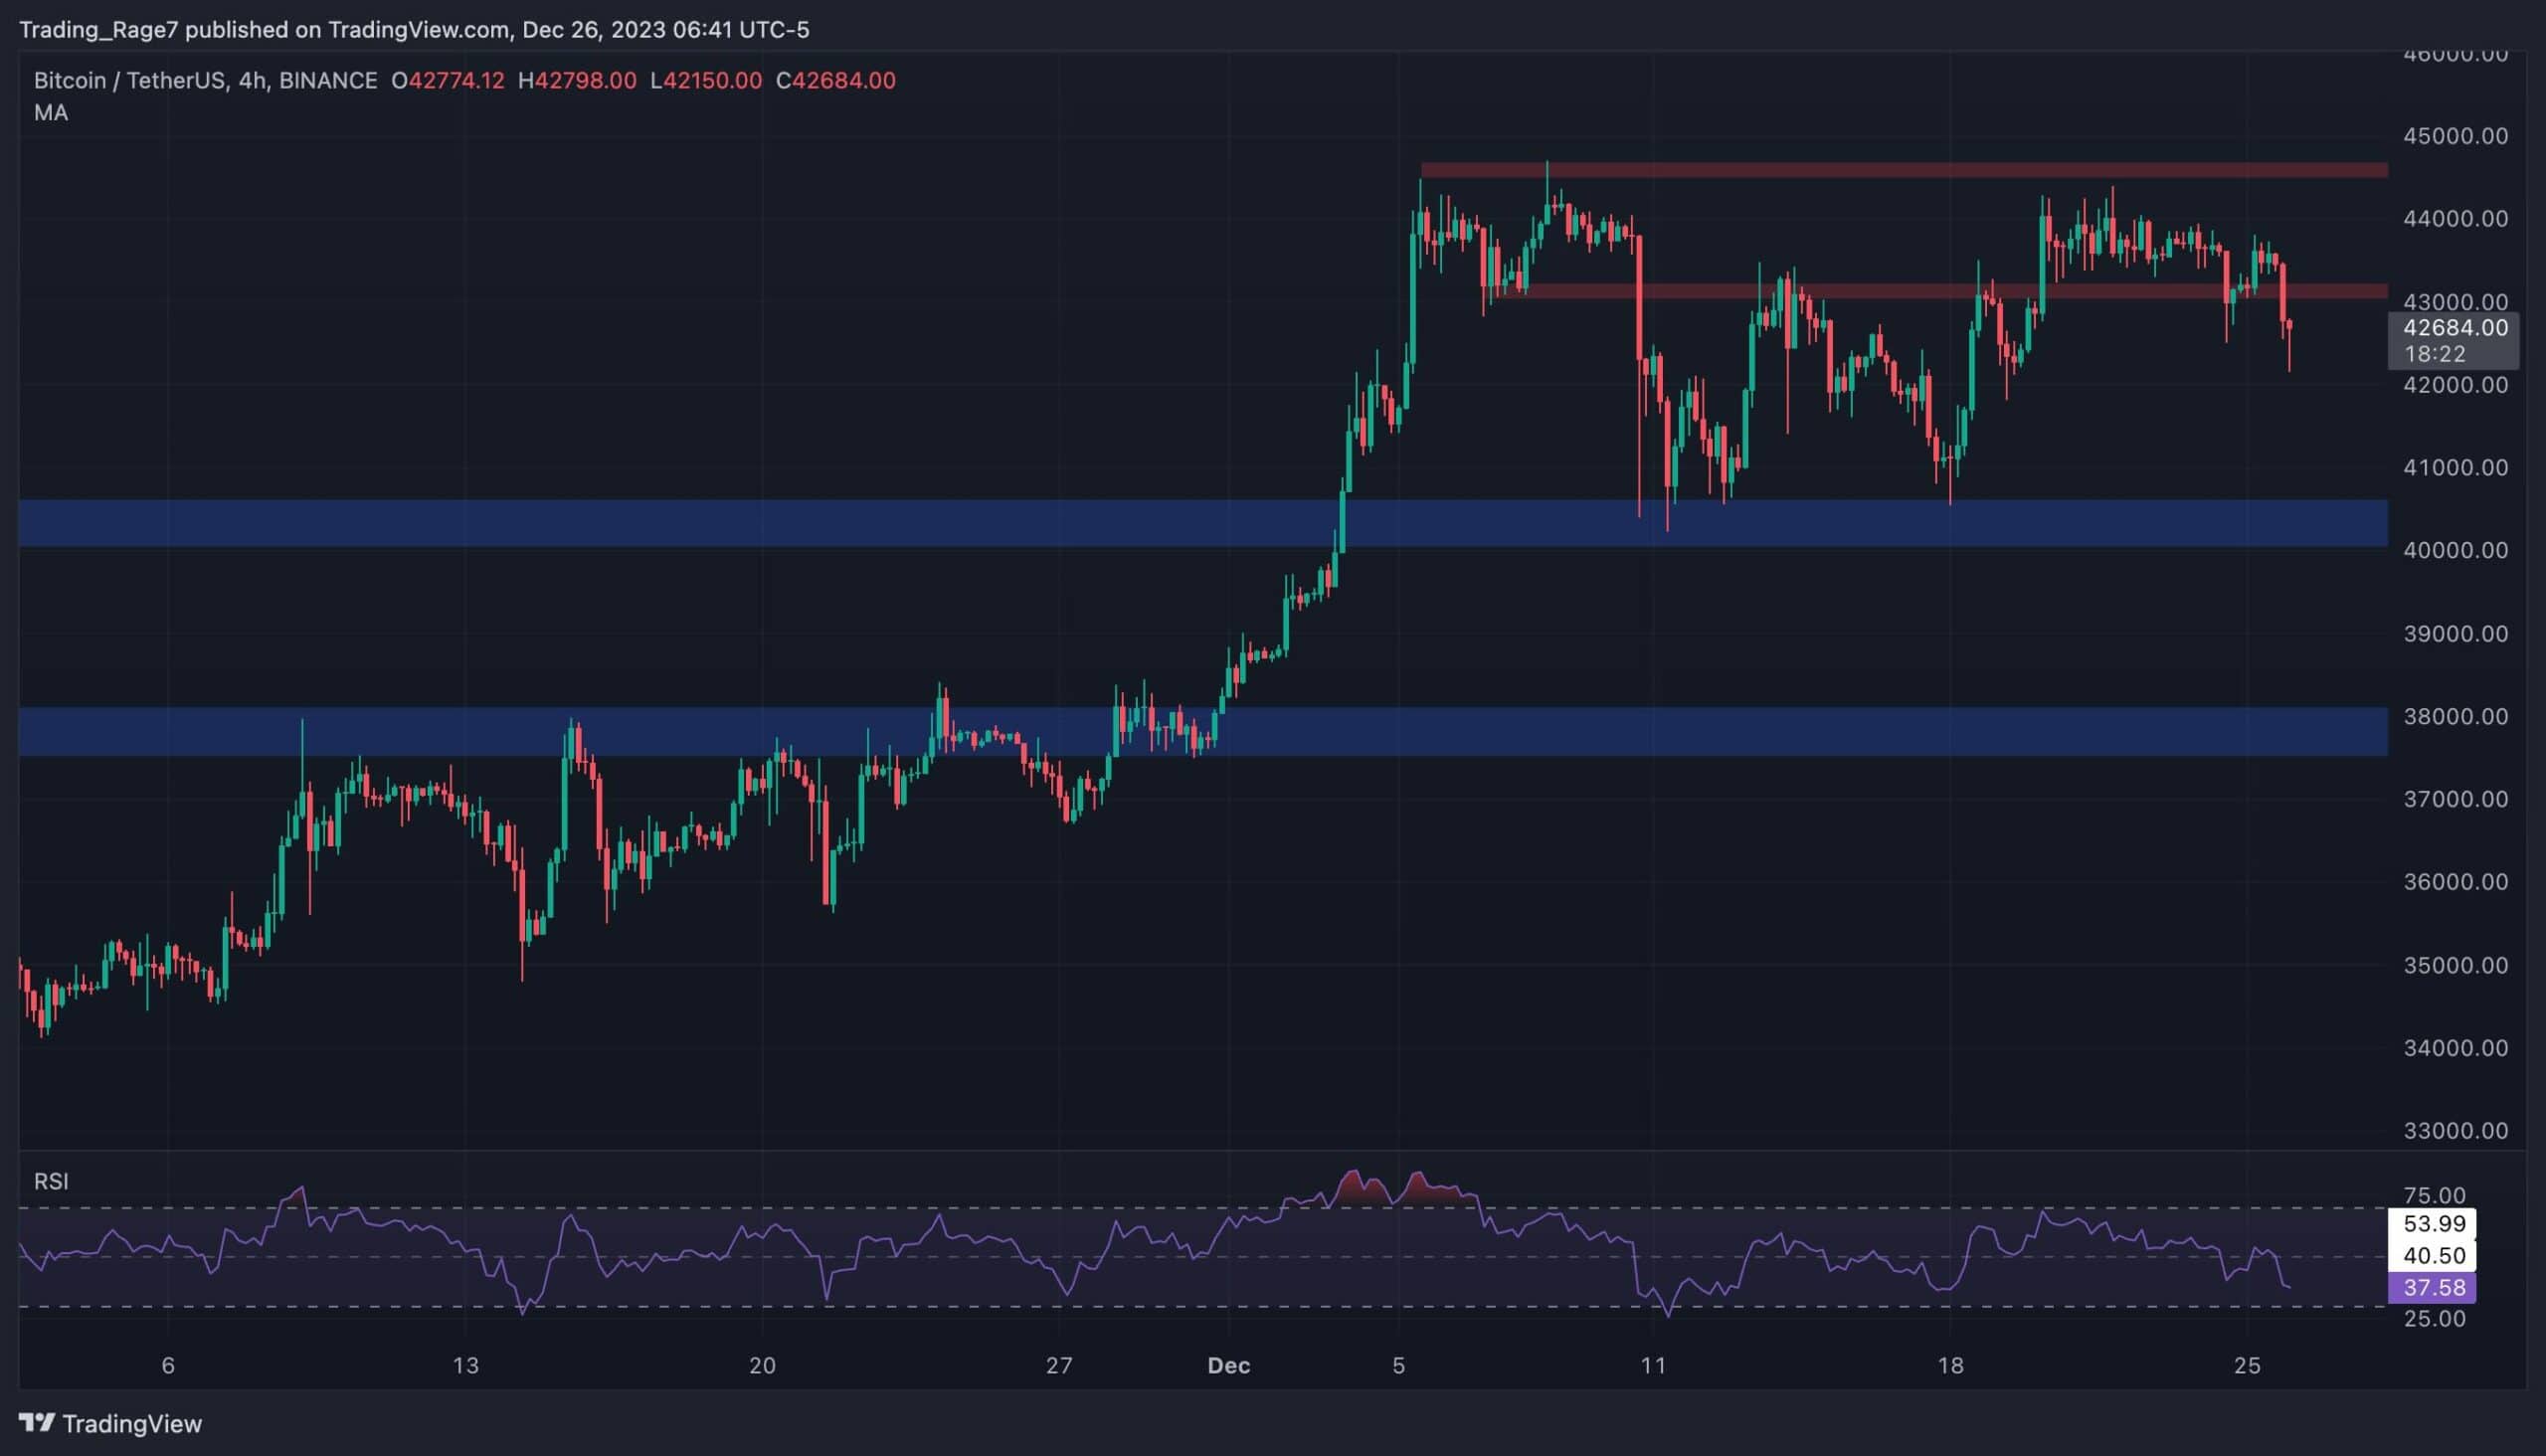
The 4-Hour Chart
The 4-hour chart depicts a more clear picture of recent price action. The market has formed two short-term resistance levels at $45K and $43K price marks and is trading below both, respectively.
If it fails to quickly recover above the $43K level, a short-term drop toward the $40K zone could be expected. With the relative strength index showing values lower than 50%, the momentum is in favor of a bearish movement, and a decline is more likely.
Bitcoin On-Chain Analysis
By TradingRage
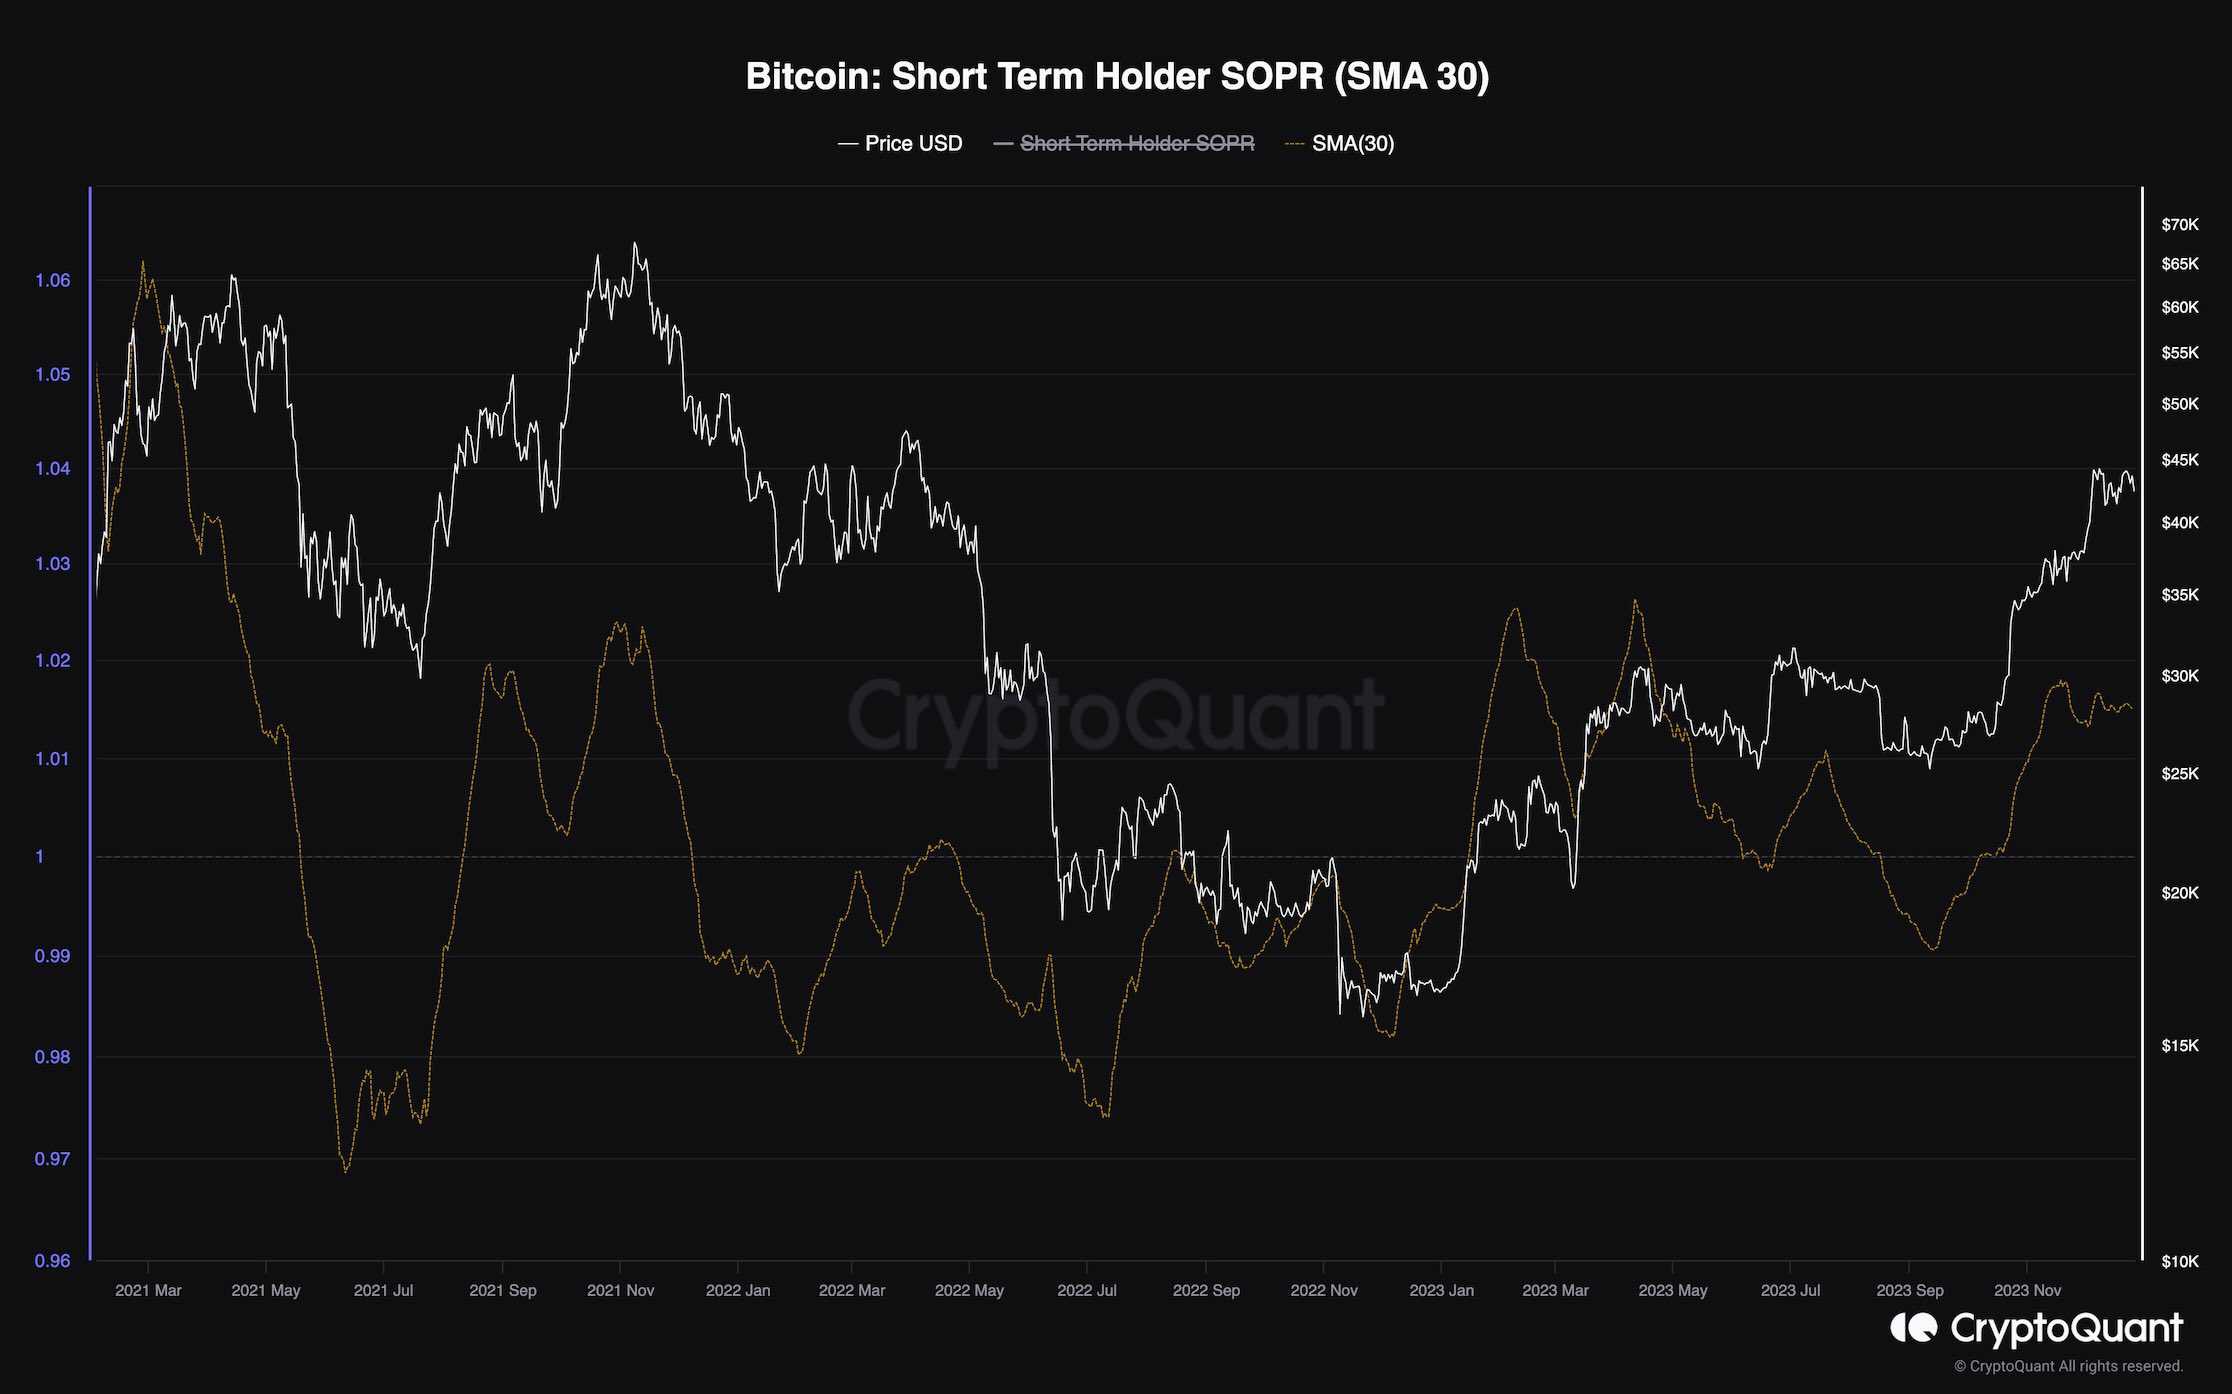
Bitcoin Short-Term Holder SOPR (SMA 30)
Bitcoin’s price has been rallying over the last few months, recovering from the depths of the bear market. Yet, market participants are wondering whether a correction is due or not. Analyzing the investors’ behavior might answer this question.
This chart represents the short-term holder Spent Output Profit Ratio (SOPR). It measures the ratio of profits (or losses) that short-term investors (holding period below 155 days) realize when they sell their Bitcoin. Values above one indicate aggregate profit realization by short-term holders, while values below one are associated with losses being realized.
Looking at the chart, it is evident that with the recent uptrend in price, the STH SOPR has recovered above one. This demonstrates that these holders have been realizing profits consistently. While it might be a positive signal, it could also be considered a bearish one because it could result in excess supply overturning the trend or, at least, lead to a correction.