After a period of consolidation, Bitcoin has shown positive signs by reaching its previous swing high amidst market uncertainty. However, as the price approaches a critical resistance zone, there is a possibility of a rejection. Technical Analysis By Shayan The Daily Chart Examining the daily chart, Bitcoin appeared to be stuck around the K mark, providing little indication of its future direction. Nevertheless, a bullish divergence between the price and the RSI indicator, along with strong buying activity near the K support level, created the necessary momentum. This resulted in a surge, with the goal of reclaiming the 200-day moving average, which is hovering around K. If buyers successfully surpass the converging 200-day and 100-day moving averages at K and
Topics:
CryptoVizArt considers the following as important: Bitcoin (BTC) Price, BTC Analysis, BTCEUR, BTCGBP, btcusd, btcusdt
This could be interesting, too:
Chayanika Deka writes XRP, SOL, and ADA Inclusion in US Crypto Reserve Pushes Traders on Edge
Chayanika Deka writes Why Arthur Hayes Is Bullish on Bitcoin Under Trump’s Economic Strategy
Mandy Williams writes Why the Bitcoin Market Is Stuck—and the Key Metric That Could Change It: CryptoQuant CEO
Wayne Jones writes Metaplanet Acquires 156 BTC, Bringing Total Holdings to 2,391
After a period of consolidation, Bitcoin has shown positive signs by reaching its previous swing high amidst market uncertainty.
However, as the price approaches a critical resistance zone, there is a possibility of a rejection.
Technical Analysis
By Shayan
The Daily Chart
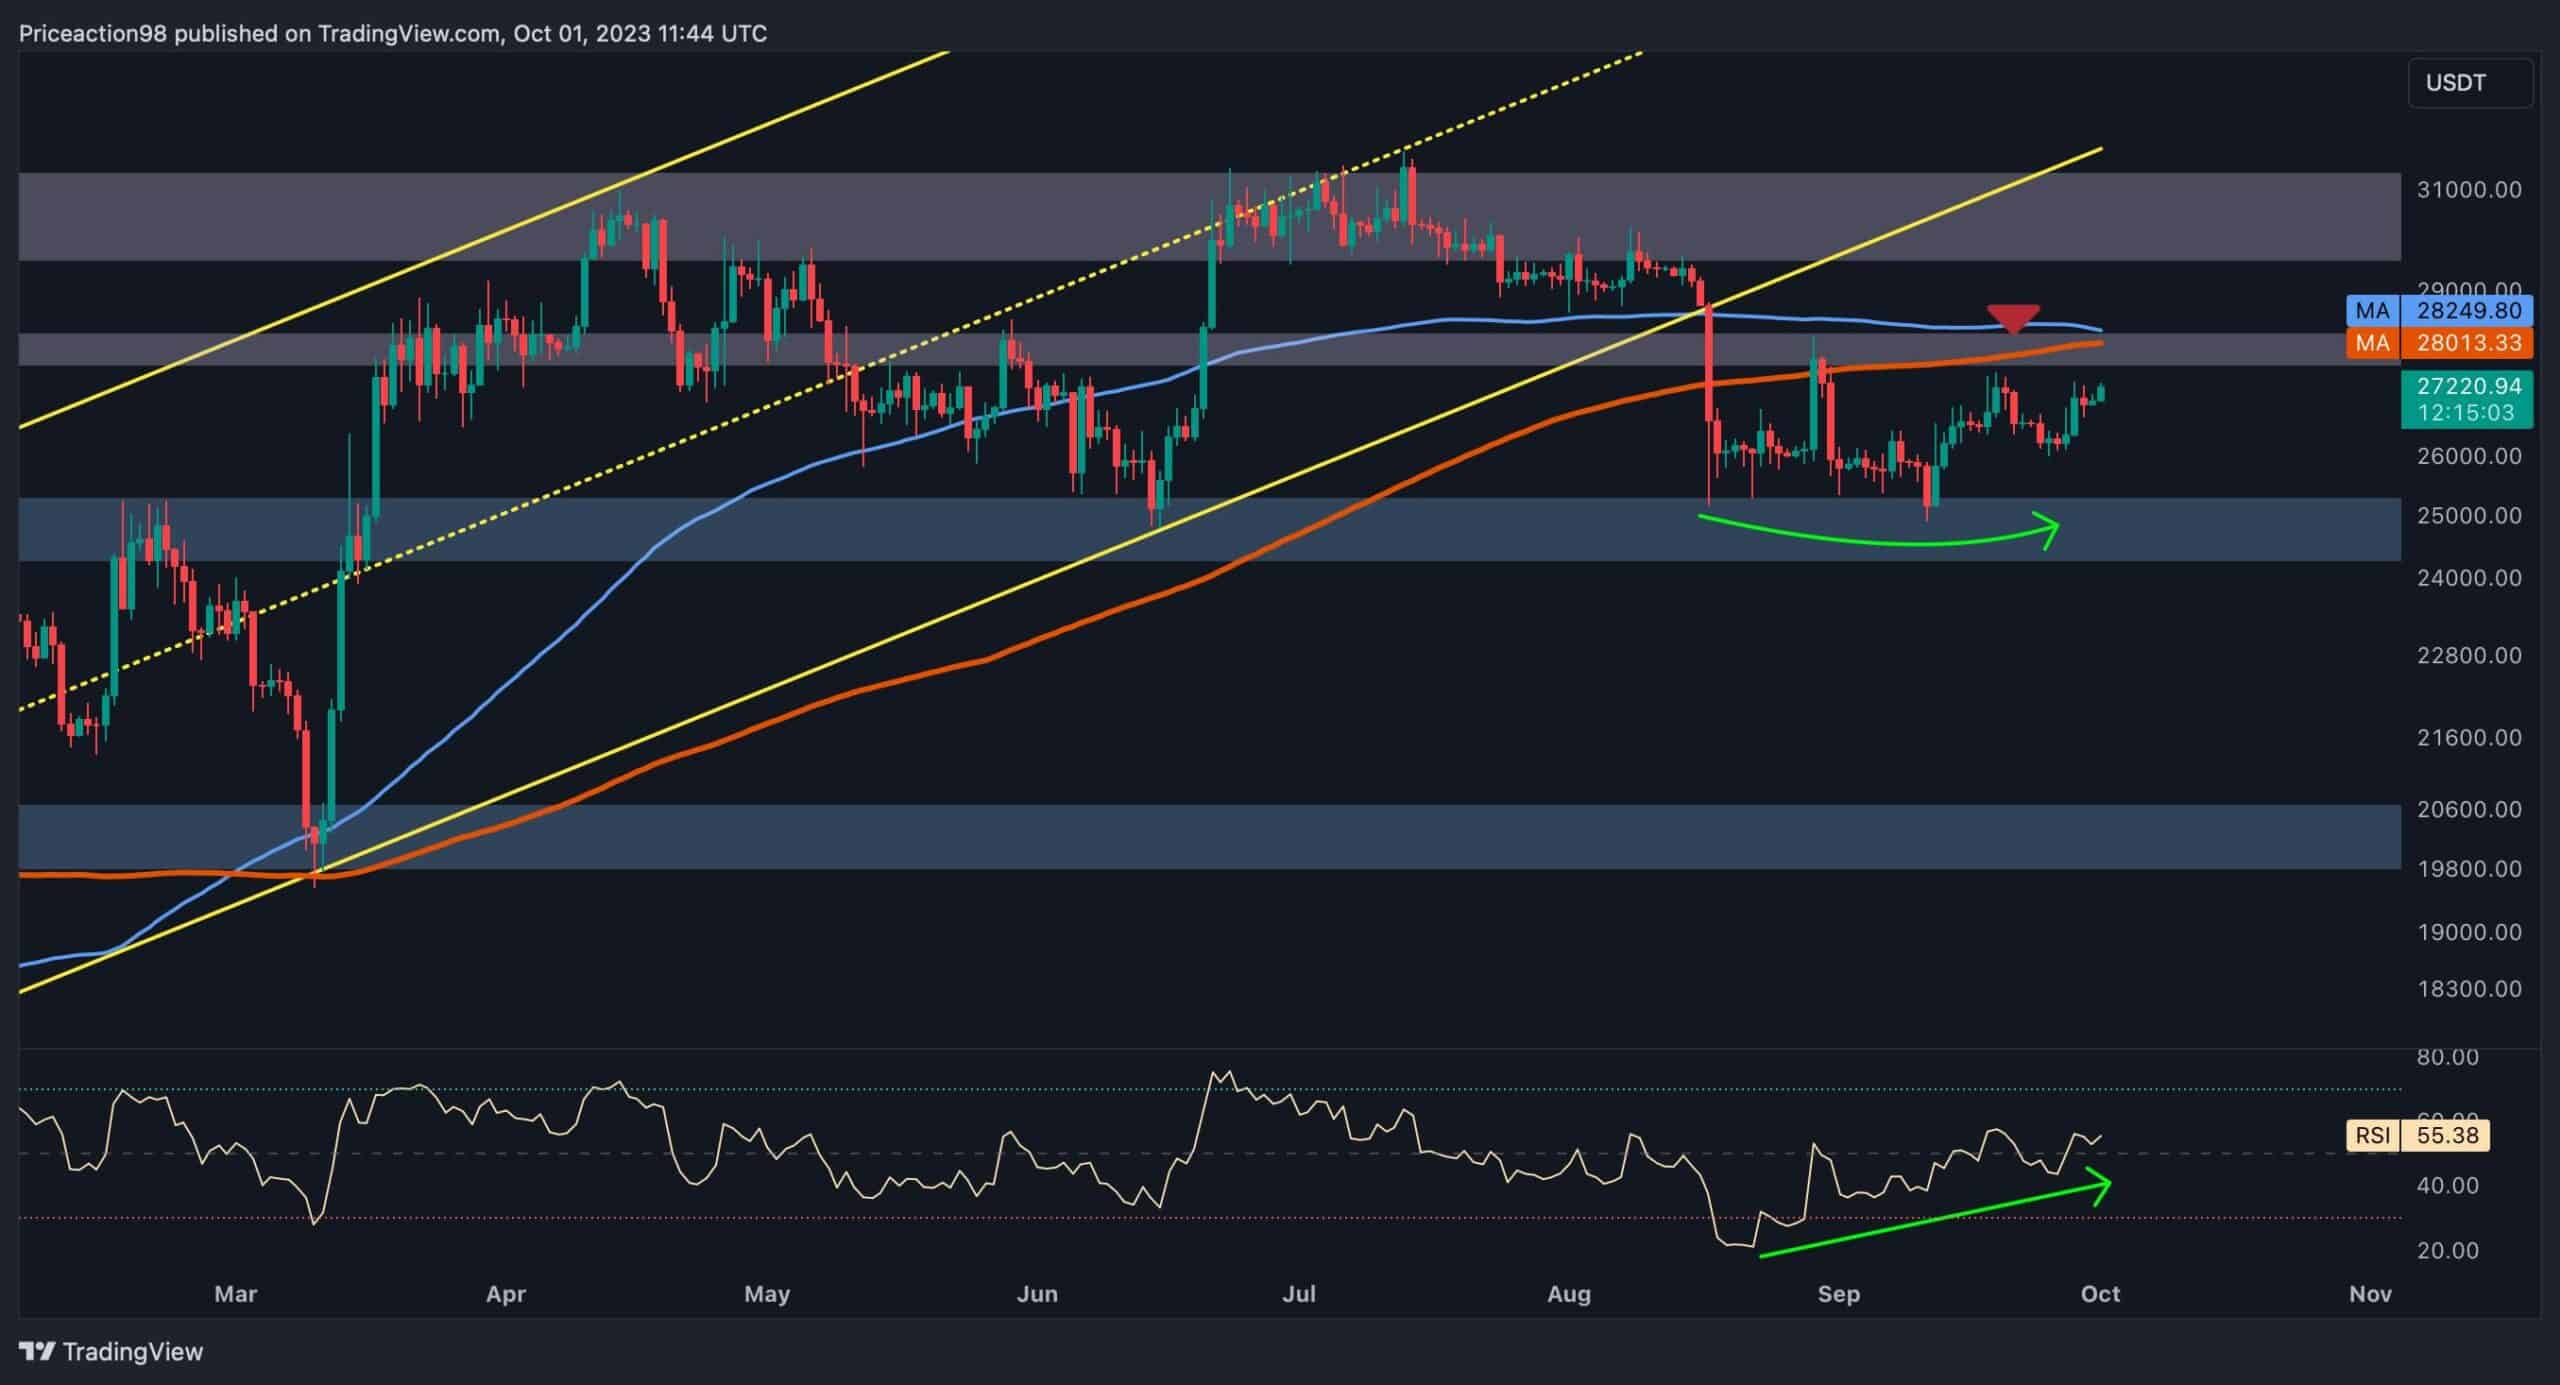
Examining the daily chart, Bitcoin appeared to be stuck around the $25K mark, providing little indication of its future direction. Nevertheless, a bullish divergence between the price and the RSI indicator, along with strong buying activity near the $25K support level, created the necessary momentum. This resulted in a surge, with the goal of reclaiming the 200-day moving average, which is hovering around $28K.
If buyers successfully surpass the converging 200-day and 100-day moving averages at $28K and experience a pullback to these levels, Bitcoin’s price may surge further, aiming to break through the substantial resistance at $30K.
However, considering the significance of the 200-day moving average and the strong resistance at $28K, another rejection is likely, potentially driving the price back towards $25K.
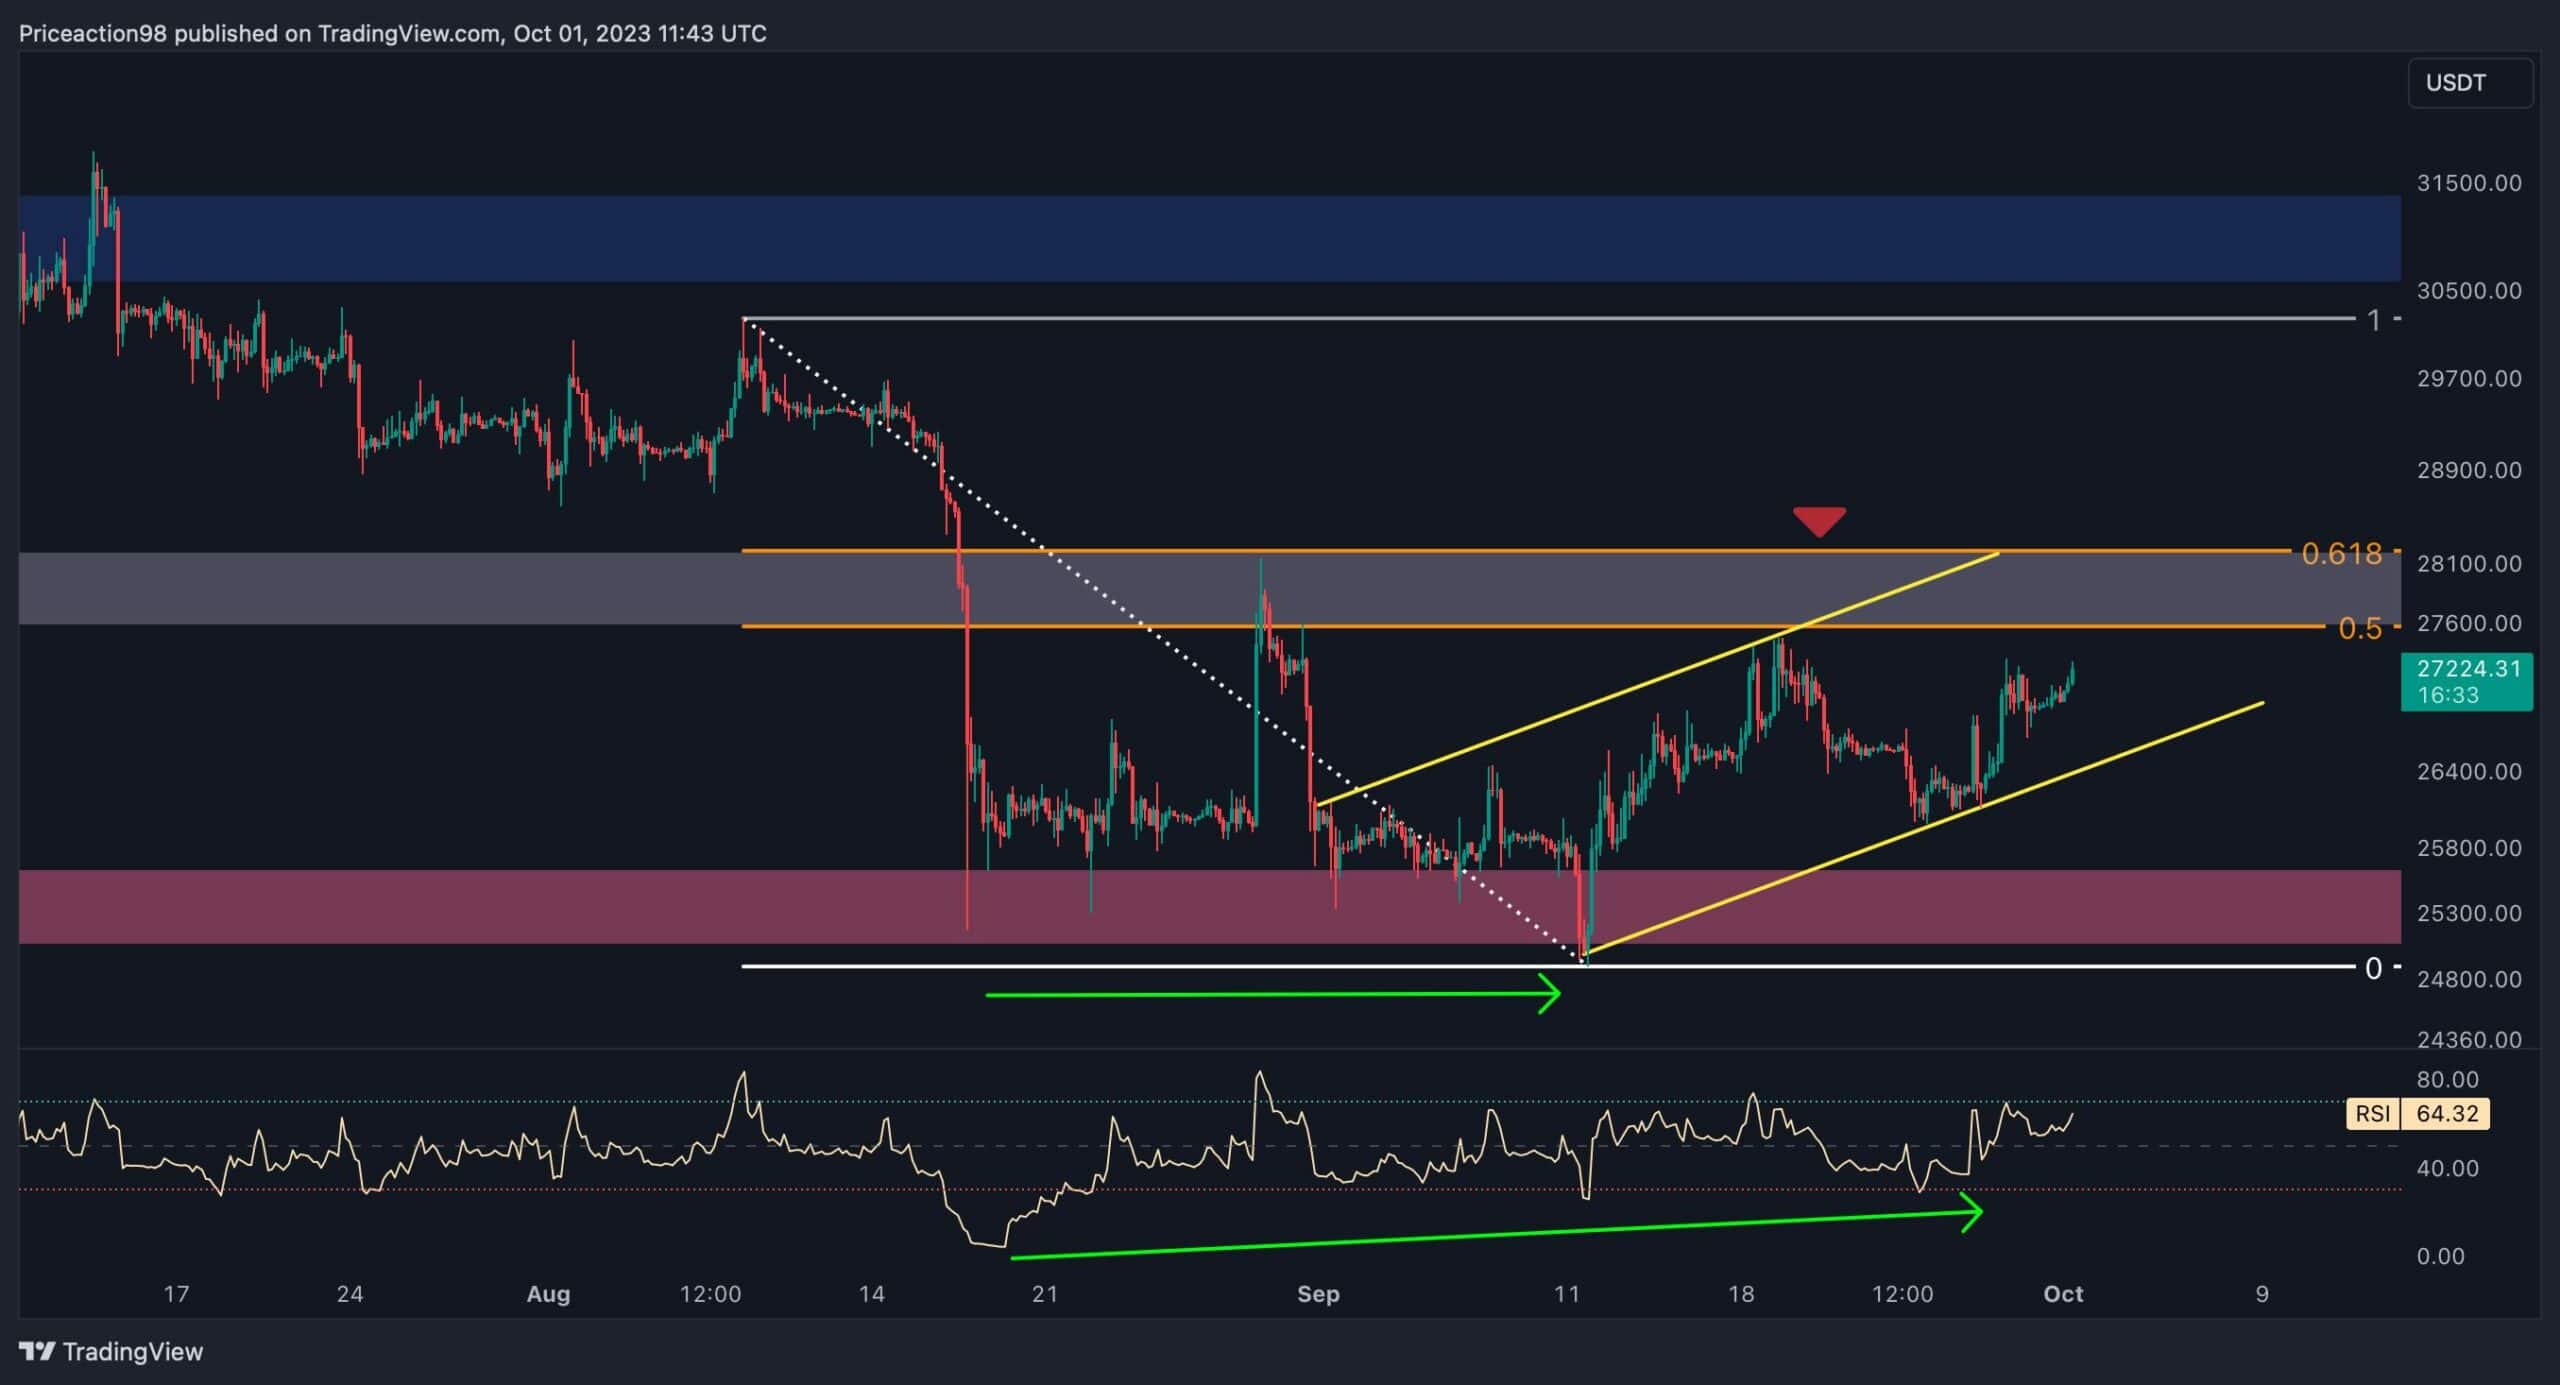
The 4-Hour Chart
Shifting our focus to the 4-hour timeframe, it becomes evident that Bitcoin found substantial support at $25K after a sharp decline. Increased buying interest prevented further declines, resulting in an upward trend. During this period, the price consistently surpassed previous highs, indicating growing interest among market participants.
However, the price is currently in an ascending channel, receiving support whenever it approaches the lower threshold. Bitcoin is now approaching a crucial resistance zone at the $28K region. This zone is marked by its previous major swing high and the 50%-61.8% Fibonacci retracement levels.
Considering the strength of this resistance area, a consolidation phase seems likely. This phase will likely be characterized by minor rejections towards the lower boundary of the channel.
On-chain Analysis
By Shayan
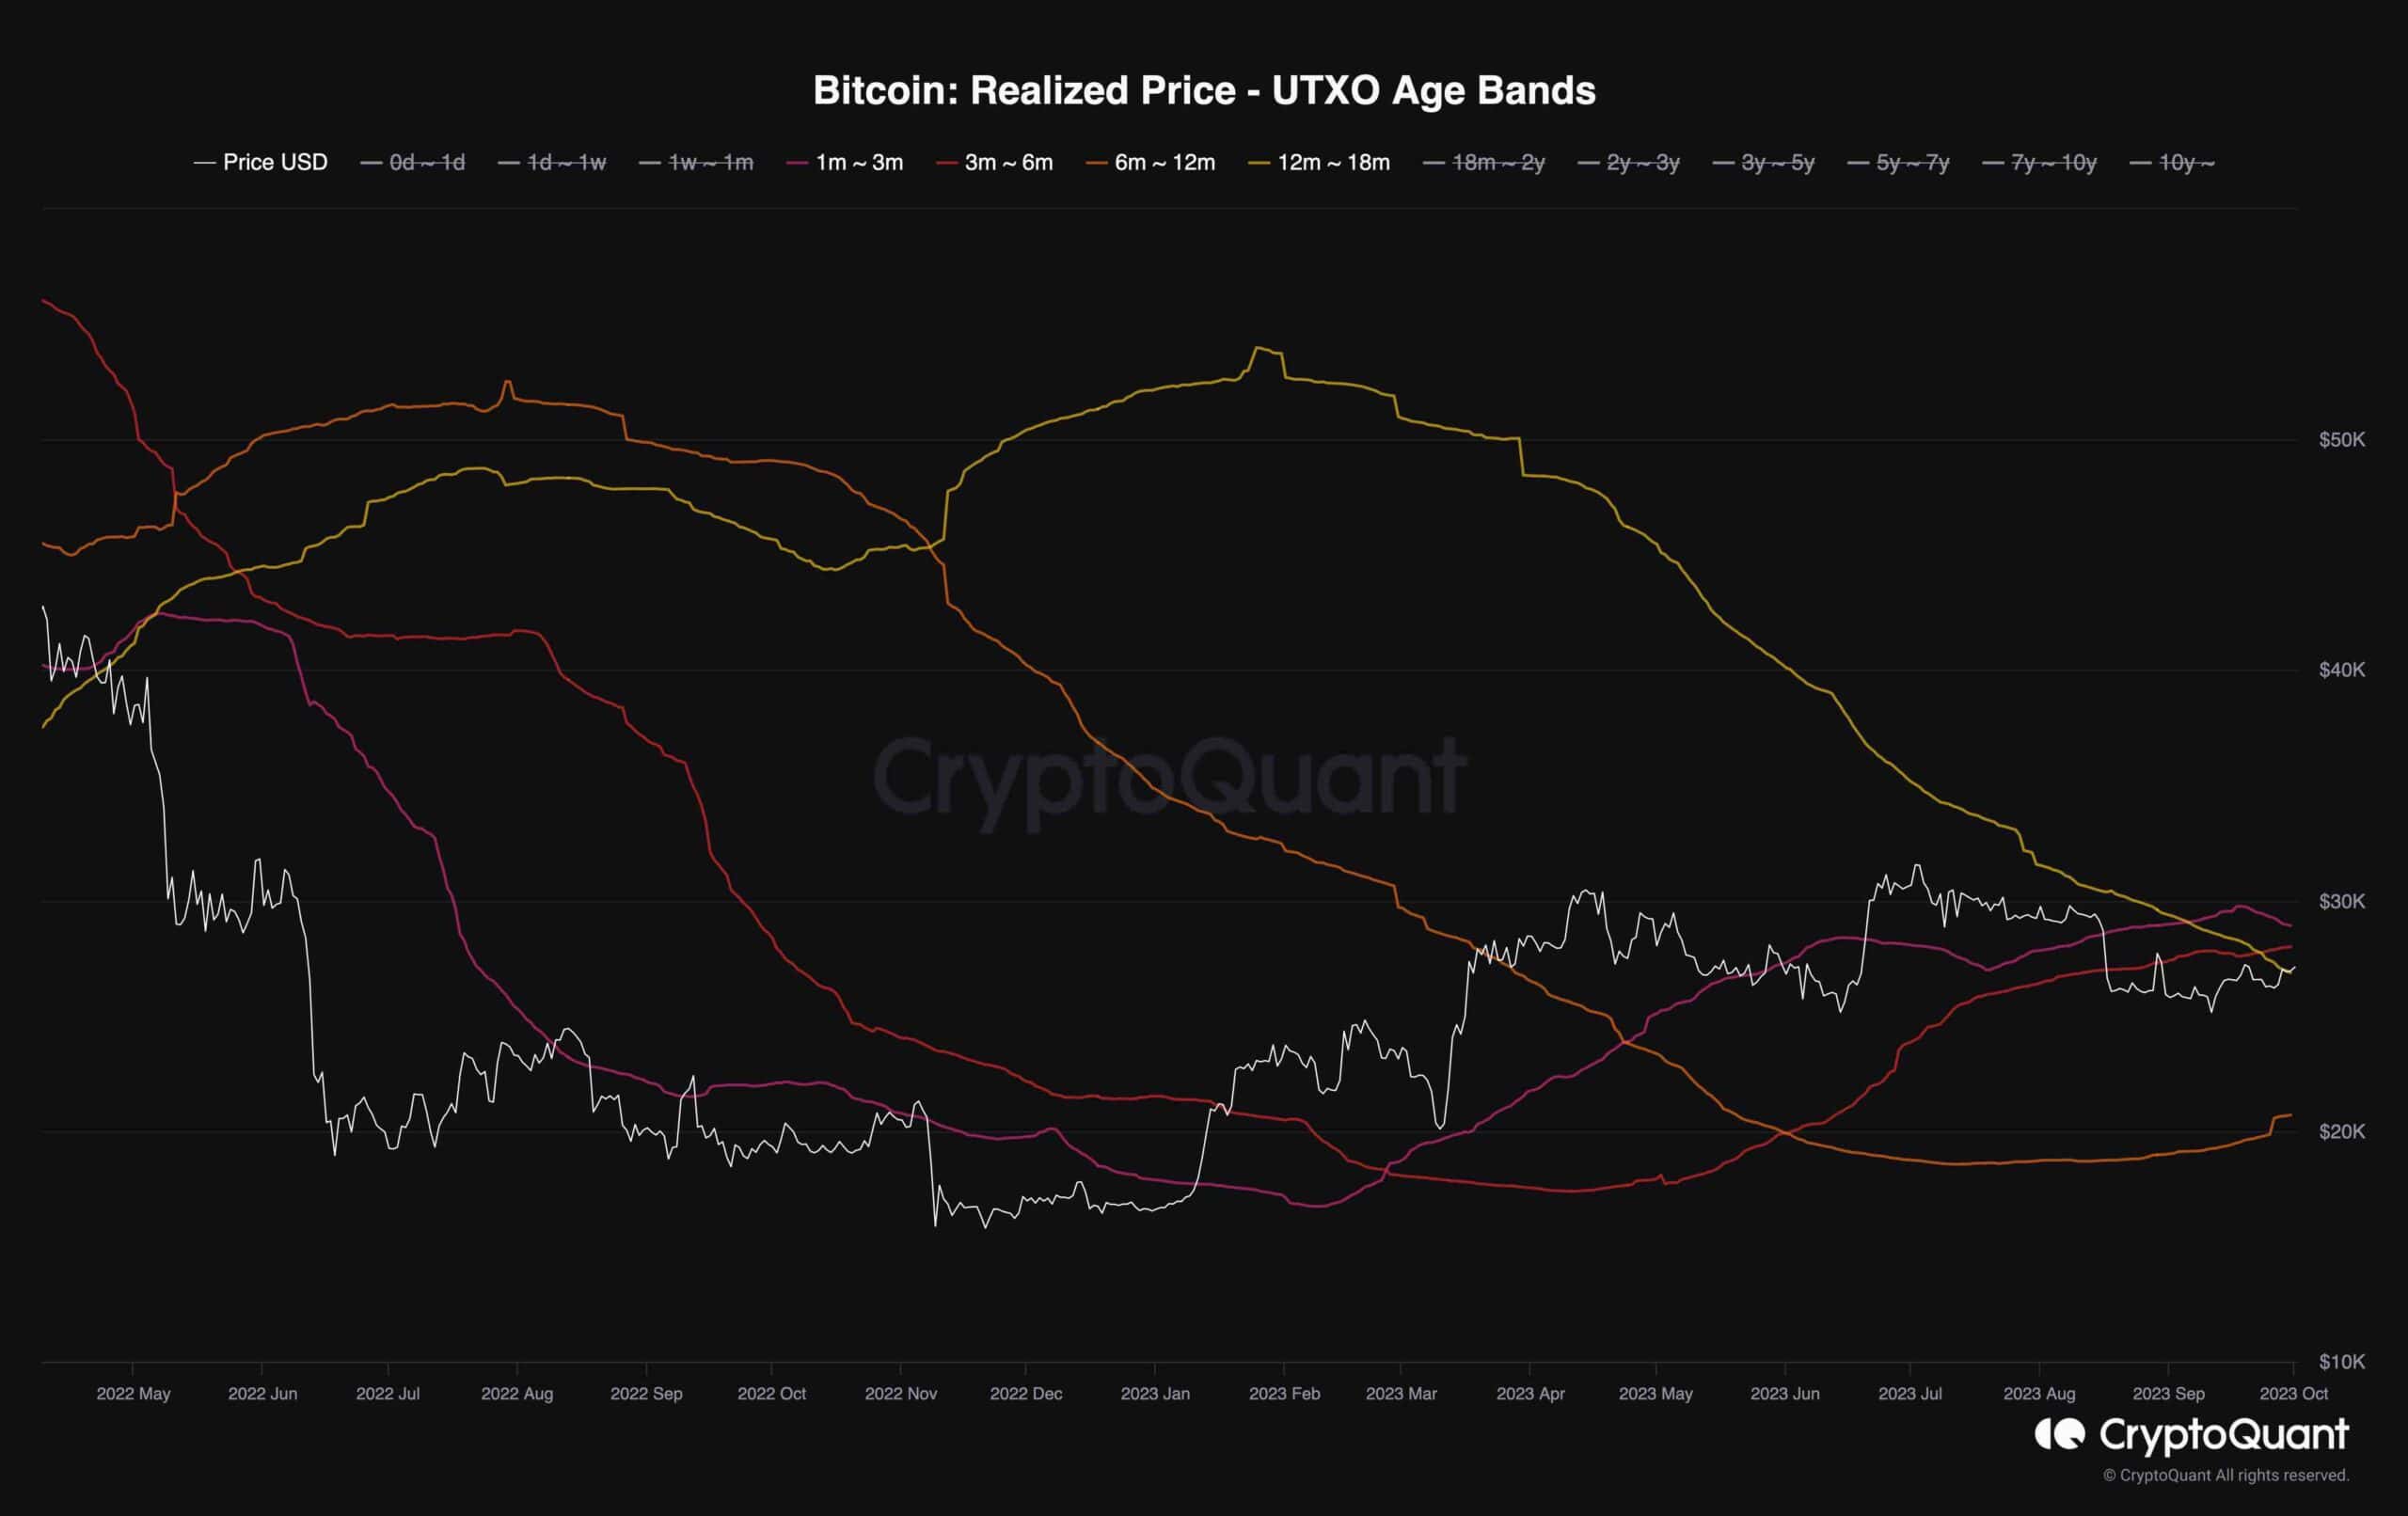
The current state of the Bitcoin market reveals an intriguing relationship between investor actions and price movements. Currently, BTC is trading at around $27,000, while the 12-18 Months UTXO Realized Price stands at $26,950. This indicates that investors who purchased Bitcoin within this timeframe have essentially broken even, reaching the average price at which they acquired it. However, the 6-12 Months UTXO Realized Price is lower than the market price, suggesting profitability for this particular group.
A more detailed analysis of the Exchange Inflow UTXO Age Bands data provides insights into investor sentiment. Despite experiencing extended periods of unrealized losses, the 12-18-month UTXO group demonstrates resilience by holding onto their investments instead of hastily selling.
This is indicative of a high level of confidence in Bitcoin’s long-term potential. On the other hand, the 6-12-month UTXO cohort, currently enjoying profits, is actively participating in selling on exchanges.
This difference in behavior highlights the varying levels of confidence among investors regarding the future direction of Bitcoin. Those who have held Bitcoin for 12-18 months appear to have faith in its long-term prospects, refraining from selling even after reaching the break-even point. The limited influx of Bitcoin from the 12-18-month UTXO cohort into exchanges indicates low selling pressure, suggesting that their realized price may not act as a significant resistance level for Bitcoin’s price.