Bitcoin price started a fresh decline from the ,500 zone against the US Dollar. The price is now trading below ,700 and the 55 simple moving average (4 hours). There was a break below a key contracting triangle with support near ,750 on the 4-hour chart of the BTC/USD pair (data feed from Coinbase). The pair could start a fresh increase if it stays above the ,500 support zone. Bitcoin price is declining below ,500 against the US Dollar. BTC might eye another increase if the bulls remain active above the ,500 zone. Bitcoin Price Analysis Bitcoin price started a fresh decline from the ,500 resistance zone. A high was formed near ,614 before the price started a downside correction. There was a clear move below the ,000 and ,800
Topics:
Aayush Jindal considers the following as important: Bitcoin News, BTC, News, Trading
This could be interesting, too:
Bilal Hassan writes Ripple Launches RLUSD, a Stablecoin Backed by U.S. Dollar Reserves
Bilal Hassan writes MicroStrategy Increases Bitcoin Holdings with New .5B Purchase
Emily John writes Trump Confirms Bitcoin Reserve Plans Spark Trillion Boom
Bilal Hassan writes Bitpanda Receives VARA Approval for UAE Launch
- Bitcoin price started a fresh decline from the $28,500 zone against the US Dollar.
- The price is now trading below $27,700 and the 55 simple moving average (4 hours).
- There was a break below a key contracting triangle with support near $27,750 on the 4-hour chart of the BTC/USD pair (data feed from Coinbase).
- The pair could start a fresh increase if it stays above the $26,500 support zone.
Bitcoin price is declining below $28,500 against the US Dollar. BTC might eye another increase if the bulls remain active above the $26,500 zone.
Bitcoin Price Analysis
Bitcoin price started a fresh decline from the $28,500 resistance zone. A high was formed near $28,614 before the price started a downside correction. There was a clear move below the $28,000 and $27,800 levels.
Besides, there was a break below a key contracting triangle with support near $27,750 on the 4-hour chart of the BTC/USD pair. The bears were able to push the price below the 50% Fib retracement level of the upward move from the $25,982 swing low to the $28,614 high.
It is now trading below $27,700 and the 55 simple moving average (4 hours). However, the bulls are now active near the $27,000 support. They are protecting the 61.8% Fib retracement level of the upward move from the $25,982 swing low to the $28,614 high.
Immediate resistance on the upside is near the $27,300 level. The next major resistance might be near the $27,800 zone and the 55 simple moving average (4 hours).
A clear move above the $27,800 level might send the price toward $28,500, above which the price might rise toward the $29,500 level. Any more gains might push the price toward the $30,000 zone. If there is no upside break, the price might continue to decline below the $27,000 level.
The first major support is $26,600. The next key support is near the $26,500 level, below which the price might accelerate lower. In the stated case, the price could decline toward the $26,000 level. Any more losses might send the price toward the $25,500 level.
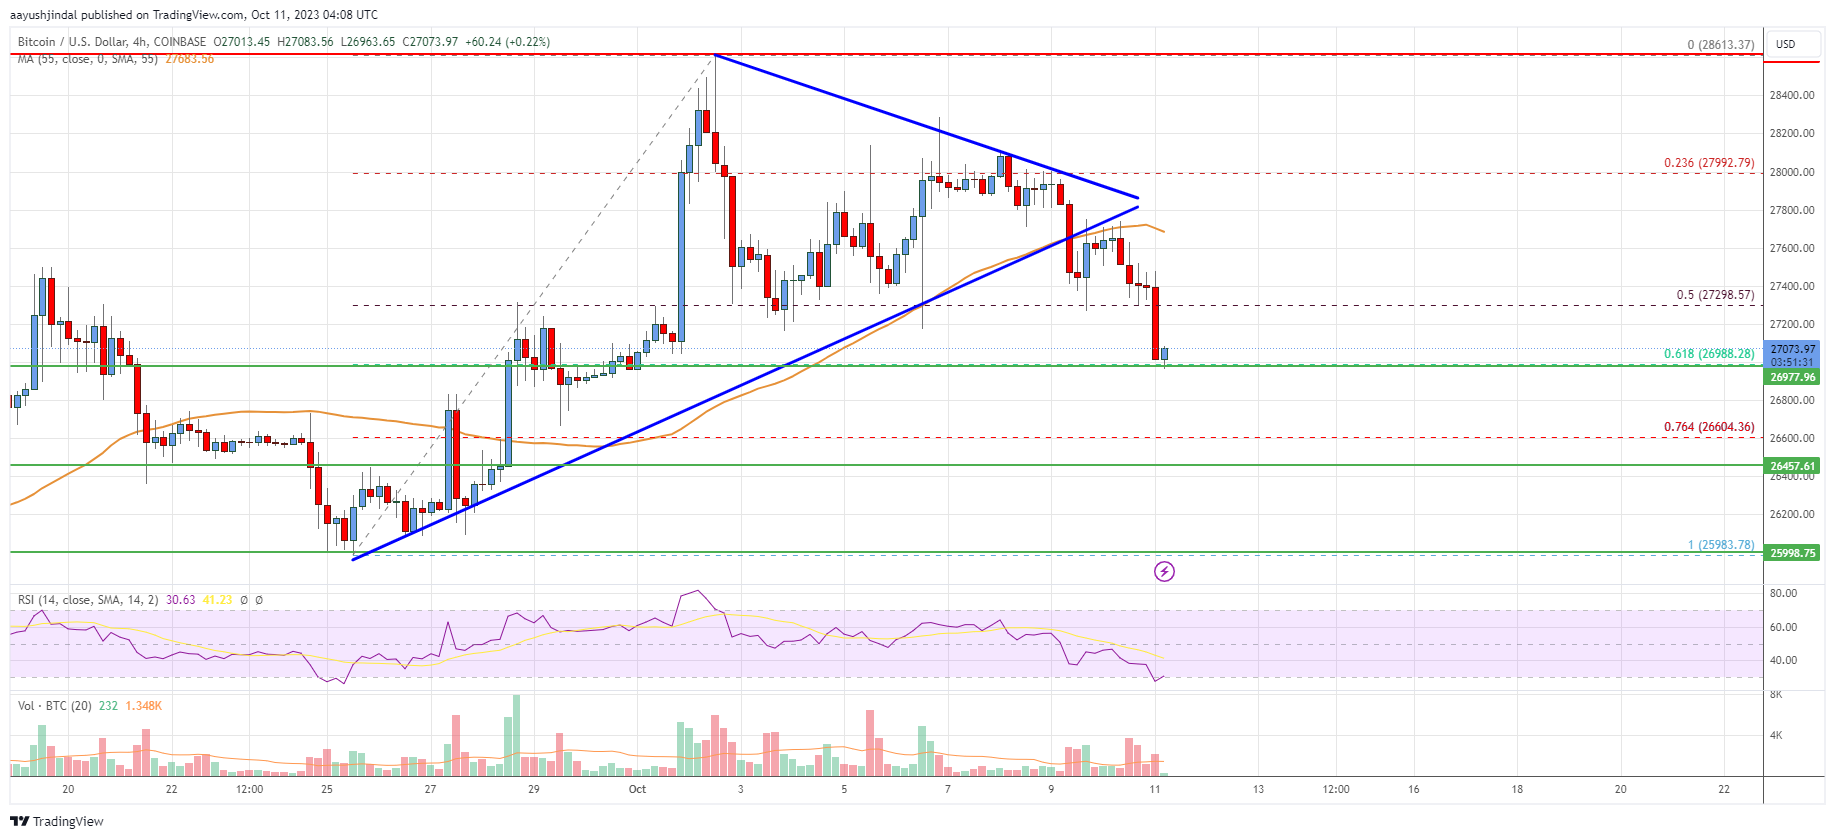
Looking at the chart, Bitcoin price is clearly trading below $27,500 and the 55 simple moving average (4 hours). Overall, the price could start a fresh increase if it stays above the $26,500 support zone.
Technical Indicators
4 hours MACD – The MACD is now gaining momentum in the bearish zone.
4 hours RSI (Relative Strength Index) – The RSI is now below the 50 level.
Key Support Levels – $27,000 and $26,500.
Key Resistance Levels – $27,300, $27,800, and $28,500.