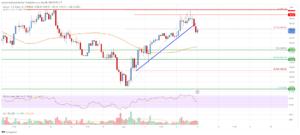
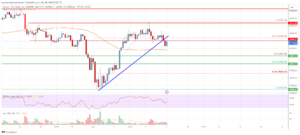
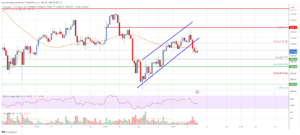
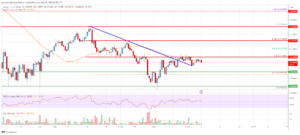
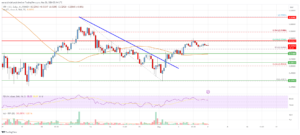
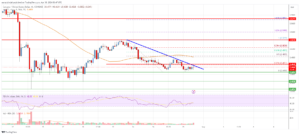
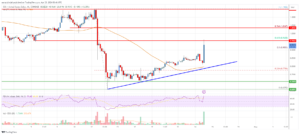
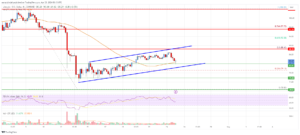
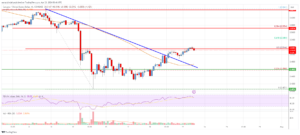
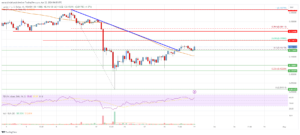
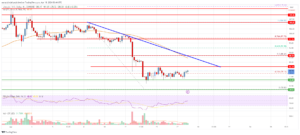
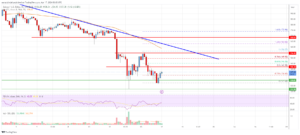
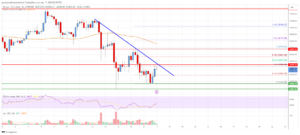
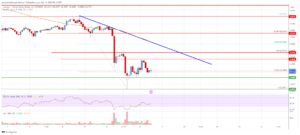
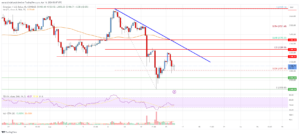
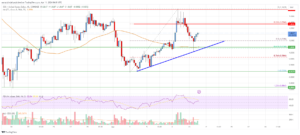
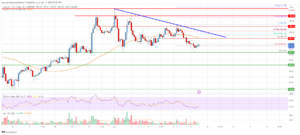
Solana price started a downside correction from the $160 zone against the US Dollar.
The price is now trading above $140 and the 55 simple moving average (4 hours).
There was a break below a key bullish trend line with support at $152 on the 4-hour chart of the SOL/USD pair (data feed from Coinbase).
The pair must stay above the $138 and $135 support levels to start another increase.
Solana price is correcting gains from $160 against the US Dollar, like Bitcoin. SOL could start another increase if the bulls remain active above $135.
Solana (SOL) Price Analysis
SOL price attempted more upsides above the $150 resistance zone. The price climbed above the $155 zone, but the bears were active near the $160 zone.
A high was formed near $159.38 before there was a
Articles by Aayush Jindal
Bitcoin Price Analysis: BTC Could Rally Unless This Support Gives Way
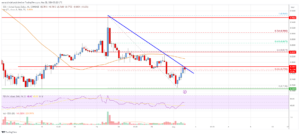
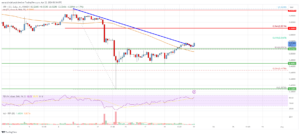
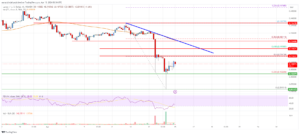
May 8, 2024Bitcoin price started a downside correction from the $65,500 zone against the US Dollar.
The price is now trading above $62,000 and the 55 simple moving average (4 hours).
There was a break below a key bullish trend line with support at $63,000 on the 4-hour chart of the BTC/USD pair (data feed from Coinbase).
The pair could start a fresh increase if it stays above the $61,000 support zone.
Bitcoin price is correcting lower below $63,000 against the US Dollar. BTC might eye another increase if the bulls remain active above the $61,000 zone.
Bitcoin Price Analysis
Bitcoin price extended its increase above the $63,500 level and rallied toward the $65,500 resistance zone. However, the bears remained active near the $65,500 zone.
A high was formed near $65,523
Cardano (ADA) Price Analysis: Can Bulls Clear This Hurdle?
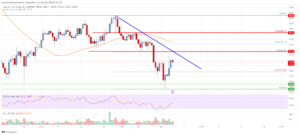
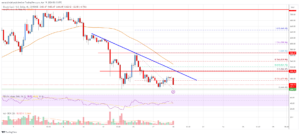
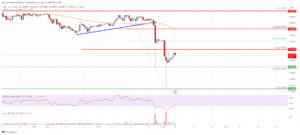
May 7, 2024ADA price is attempting a fresh increase from the $0.4180 zone against the US Dollar.
The price is now trading below $0.500 and the 55 simple moving average (4 hours).
There was a break above a major bearish trend line with resistance at $0.4420 on the 4-hour chart (data feed via Coinbase).
The price could gain bullish momentum if it clears the $0.4600 and $0.480 levels.
Cardano price is holding the $0.4420 support against the US Dollar, like Bitcoin. ADA price could gain bullish momentum if it clears the $0.4800 resistance.
Cardano Price (ADA) Analysis
Earlier this month, Cardano price started a fresh decline from well above the $0.50 zone against the US Dollar. The ADA/USD pair declined below the $0.480 and $0.450 support levels.
It tested the $0.4180 zone. A
Ethereum Price Analysis: ETH Faces Key Uptrend Resistance
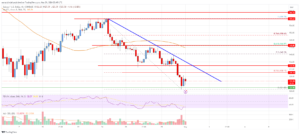
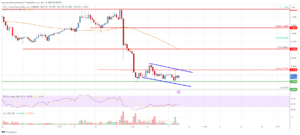
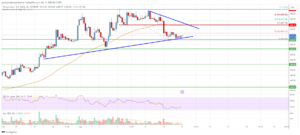
May 7, 2024Ethereum price started a downside correction from the $3,220 resistance against the US Dollar.
ETH price is now trading near $3,080 and the 55 simple moving average (4 hours).
There was a break below a key rising channel with support at $3,125 on the 4-hour chart (data feed from Coinbase).
The pair could start a fresh increase if it clears the $3,220 resistance zone.
Ethereum price is declining below $3,150 against the US Dollar. ETH/USD remains at a risk of more downsides below the $3,020 support zone.
Ethereum Price Analysis
In the past few days, Ethereum started a decent increase above the $3,050 resistance zone against the US Dollar. ETH price climbed above the $3,120 and $3,150 resistance levels.
Finally, it tested the $3,220 resistance zone. A high was
Stellar Lumen (XLM) Price Could Jump If It Clears $0.1115
May 6, 2024Stellar lumen price is attempting a fresh increase from the $0.1030 zone against the US Dollar.
XLM price is now trading near $0.1100 and the 55 simple moving average (4 hours).
There was a break above a key bearish trend line with resistance at $0.1105 on the 4-hour chart (data feed via Kraken).
The pair could accelerate higher if there is a clear move above the $0.1115 resistance zone.
Stellar lumen price is trading in a positive zone above $0.1050 against the US Dollar, like Bitcoin. XLM price must clear $0.1115 to gain bullish momentum.
Stellar Lumen Price Analysis (XLM to USD)
After forming a base above the $0.1020 zone, Stellar lumen price started a decent increase against the US Dollar. The XLM/USD pair traded above the $0.1080 resistance to move into a
XRP Price Analysis: Can Bulls Clear This Key Hurdle?
May 6, 2024XRP price is attempting a fresh increase from the $0.4750 support against the US dollar.
The price is now trading above $0.500 and the 55 simple moving average (4 hours).
There was a break above a key bearish trend line with resistance at $0.5050 on the 4-hour chart of the XRP/USD pair (data source from Kraken).
The pair could continue to rise if it clears the $0.5350 resistance.
XRP price is consolidating above $0.5150 against the US Dollar, like Bitcoin. It must stay above the $0.5050 support to continue higher in the near term.
XRP Price Analysis
After forming a base above the $0.4750 level, XRP price started a fresh increase against the US Dollar. The XRP/USD pair broke the $0.4850 and $0.500 resistance levels to enter a positive zone.
There was a break
EOS Price Analysis: Bears Aim Larger Drop Below $0.72
May 2, 2024EOS price started a fresh decline after it failed to clear $0.9650 against the US Dollar.
The price is now trading below $0.820 and the 55 simple moving average (4 hours).
There is a major bearish trend line forming with resistance at $0.7850 on the 4-hour chart of the EOS/USD pair (data feed from Coinbase).
The pair could continue to decline if it stays below the $0.7850 and $0.80 resistance levels.
EOS price is struggling below $0.820 against the US Dollar, unlike Bitcoin. The price might attempt to recover if there is a clear move above $0.8350.
EOS Price Analysis
In the past few days, EOS price saw a fresh decline from the $0.9650 resistance against the US Dollar. The price traded below the $0.920 and $0.850 levels to move into a bearish zone.
The pair even
Litecoin (LTC) Price Analysis: Recovery Could Be Capped Near $82
May 2, 2024Litecoin started a fresh decline from the $88 resistance zone against the US Dollar.
LTC price is now trading below $85 and the 55 simple moving average (4 hours).
There is a major bearish trend line forming with resistance near $81.50 on the 4-hour chart of the LTC/USD pair (data feed from Coinbase).
The pair could continue to move down unless the bulls protect the $75.00 support zone.
Litecoin price is struggling below $85.00 against the US Dollar, like Bitcoin. LTC price could continue to decline if it stays below the $82.00 resistance zone.
Litecoin Price Analysis
In the past few sessions, there was a steady decline in Bitcoin, Ethereum, Ripple, and Litecoin against the US Dollar. Earlier, LTC struggled to clear the $88 resistance and started a fresh
Solana (SOL) Price Analysis: Recovery Could Face Many Hurdles
May 1, 2024Solana price gained bearish momentum below the $140 level against the US Dollar.
The price is now trading below $132 and the 55 simple moving average (4 hours).
There is a key bearish trend line forming with resistance near $130 on the 4-hour chart of the SOL/USD pair (data feed from Coinbase).
The pair could recover, but the upsides might be limited above the $145 resistance.
Solana price is trading in a bearish zone below $140 against the US Dollar, like Bitcoin. SOL could extend losses if it stays below the $145 resistance zone.
Solana (SOL) Price Analysis
SOL price started a fresh decline below the $150 support zone. The price gained bearish momentum below the $140 support zone. The bears were able to push the price below the $132 and $125 support levels.
Cardano (ADA) Price Analysis: Bulls Lose Control Below $0.50
April 30, 2024ADA price is trading in a bearish zone below the $0.50 support zone against the US Dollar.
The price is now trading below $0.50 and the 55 simple moving average (4 hours).
There is a connecting bearish trend line forming with resistance near $0.460 on the 4-hour chart (data feed via Coinbase).
The price could continue to move down if it stays below the $0.50 resistance zone.
Cardano price is struggling below $0.50 against the US Dollar, like Bitcoin. ADA price could start a fresh increase if it clears the $0.480 and $0.500 resistance levels.
Cardano Price (ADA) Analysis
In the past few days, Cardano price started a fresh decline from the $0.5220 resistance against the US Dollar. The ADA/USD pair declined below the $0.500 and $0.480 support levels.
The price
EOS Price Analysis: Gains Could Accelerate Above $1
April 25, 2024EOS price is eyeing a fresh increase from the $0.660 support against the US Dollar.
The price is now trading above $0.80 and the 55 simple moving average (4 hours).
There is a key bullish trend line forming with support at $0.800 on the 4-hour chart of the EOS/USD pair (data feed from Coinbase).
The pair could continue to rise if it clears the $0.960 and $1.00 resistance levels.
EOS price is recovering above $0.80 against the US Dollar, like Bitcoin. The price might continue to rise if it clears the $1.00 resistance.
EOS Price Analysis
In the past few sessions, EOS price started a decent increase from the $0.660 support against the US Dollar. The price was able to clear the $0.750 and $0.80 resistance levels.
The pair even cleared the 50% Fib retracement level
Litecoin (LTC) Price Analysis: Can Bulls Hold This Key Support?
April 25, 2024Litecoin is holding gains above the $82.00 support against the US Dollar.
LTC price is now trading above $82.00 and the 55 simple moving average (4 hours).
There is a key rising channel forming with resistance near $88.50 on the 4-hour chart of the LTC/USD pair (data feed from Coinbase).
The pair could gain bullish momentum if it clears the $88.50 and $92.50 resistance levels.
Litecoin price is holding gains above $82 against the US Dollar, like Bitcoin. LTC price could climb again if there is a clear move above $88.50.
Litecoin Price Analysis
In the past few sessions, there were range moves in Bitcoin, Ethereum, Ripple, and Litecoin against the US Dollar. Earlier, LTC struggled to clear the $106 resistance zone and started a fresh decline.
There was a move
Cardano (ADA) Price Analysis: Bulls Aim Steady Increase
April 23, 2024ADA price is attempting a fresh increase from the $0.4050 zone against the US Dollar.
The price is now trading above $0.500 and the 55 simple moving average (4 hours).
There was a break above a major bearish trend line with resistance at $0.500 on the 4-hour chart (data feed via Coinbase).
The price could gain bullish momentum if it clears the $0.5150 and $0.540 levels.
Cardano price is holding the $0.480 support against the US Dollar, like Bitcoin. ADA price could gain bullish momentum if it clears the $0.5150 resistance.
Cardano Price (ADA) Analysis
Earlier this month, Cardano price started a fresh decline from well above the $0.60 zone against the US Dollar. The ADA/USD pair declined below the $0.550 and $0.500 support levels.
It tested the $0.400 zone. A
Ethereum Price Analysis: ETH Could Revisit $3,500
April 23, 2024Ethereum price is eyeing an upside break above the $3,220 resistance against the US Dollar.
ETH price is now trading above $3,100 and the 55 simple moving average (4 hours).
There was a break above a key bearish trend line with resistance near $3,150 on the 4-hour chart (data feed from Coinbase).
The pair could climb further if it stays above the $3,000 support zone.
Ethereum price is consolidating above the $3,100 level against the US Dollar. ETH/USD could rise again if it clears the $3,220 resistance zone.
Ethereum Price Analysis
In the past few sessions, Ethereum saw a decent increase from the $2,850 zone against the US Dollar. ETH price moved above the $3,000 and $3,020 levels to move into a positive zone.
There was a break above a key bearish trend line
Stellar Lumen (XLM) Price Could Gain Momentum If It Clears $0.12
April 22, 2024Stellar lumen price is attempting a fresh increase from the $0.1020 zone against the US Dollar.
XLM price is now trading above $0.1100 and the 55 simple moving average (4 hours).
There was a break above a key bearish trend line with resistance at $0.1140 on the 4-hour chart (data feed via Kraken).
The pair could accelerate higher if there is a clear move above the $0.120 resistance zone.
Stellar lumen price is trading in a positive zone above $0.1100 against the US Dollar, like Bitcoin. XLM price must clear $0.1050 to gain bullish momentum.
Stellar Lumen Price Analysis (XLM to USD)
After forming a base above the $0.100 zone, Stellar lumen price started a decent increase against the US Dollar. The XLM/USD pair traded above the $0.1080 resistance to move into a
XRP Price Analysis: Bullish Signs Emerge Above $0.48
April 22, 2024XRP price is attempting a fresh increase from the $0.40 support against the US dollar.
The price is now trading above $0.480 and the 55 simple moving average (4 hours).
There was a break above a key bearish trend line with resistance at $0.5150 on the 4-hour chart of the XRP/USD pair (data source from Kraken).
The pair could continue to rise if it clears the $0.5450 resistance.
XRP price is consolidating above $0.50 against the US Dollar, like Bitcoin. It must stay above the $0.480 support to continue higher in the near term.
XRP Price Analysis
After forming a base above the $0.400 level, XRP price started a fresh increase against the US Dollar. The XRP/USD pair broke the $0.450 and $0.4650 resistance levels to enter a positive zone.
There was a break above a
Bitcoin Cash Analysis: Bears Gain Strength Below $550
April 19, 2024Bitcoin cash price started a fresh decline from the $570 zone against the US Dollar.
The price is now trading below the $550 zone and the 55 simple moving average (4 hours).
There is a key bearish trend line forming with resistance near $505 on the 4-hour chart of the BCH/USD pair (data feed from Coinbase).
The pair could continue to move down if it stays below the $525 resistance zone.
Bitcoin cash price is struggling below the $550 zone against the US Dollar, like Bitcoin. BCH/USD could restart its decline if it fails near $525 or $540.
Bitcoin Cash Price Analysis
Bitcoin cash price struggled to continue higher above the $570 resistance zone. BCH formed a short-term top near $570 before it started a fresh decline. There was a drop below the $550 and $540
EOS Price Analysis: Uptrend At Risk Below $0.85
April 18, 2024EOS price started a fresh decline after it failed to clear $1.150 against the US Dollar.
The price is now trading below $1.00 and the 55 simple moving average (4 hours).
There is a declining channel forming with resistance at $0.770 on the 4-hour chart of the EOS/USD pair (data feed from Coinbase).
The pair could continue to decline if it stays below the $0.775 and $0.80 resistance levels.
EOS price is struggling below $1.00 against the US Dollar, unlike Bitcoin. The price might attempt to recover if there is a clear move above $0.80.
EOS Price Analysis
In the past few days, EOS price saw a fresh decline from the $1.150 resistance against the US Dollar. The price traded below the $1.10 and $1.00 levels to move into a bearish zone.
The pair even declined below
Litecoin (LTC) Price Analysis: Bears Take Control Below $90
April 18, 2024Litecoin started a fresh decline from the $105 resistance zone against the US Dollar.
LTC price is now trading below $90 and the 55 simple moving average (4 hours).
There is a major bearish trend line forming with resistance near $87.50 on the 4-hour chart of the LTC/USD pair (data feed from Coinbase).
The pair could continue to move down unless the bulls protect the $70.00 support zone.
Litecoin price is struggling below $90.00 against the US Dollar, like Bitcoin. LTC price could continue to decline if it stays below the $90.00 resistance zone.
Litecoin Price Analysis
In the past few sessions, there was a steady decline in Bitcoin, Ethereum, Ripple, and Litecoin against the US Dollar. Earlier, LTC struggled to clear the $105 resistance and started a fresh
Solana (SOL) Price Analysis: Price Dips 50%, Can It Recover?
April 17, 2024Solana price gained bearish momentum below the $150 level against the US Dollar.
The price is now trading below $150 and the 55 simple moving average (4 hours).
There is a key bearish trend line forming with resistance near $155 on the 4-hour chart of the SOL/USD pair (data feed from Coinbase).
The pair could recover, but the upsides might be limited above the $150 resistance.
Solana price is trading in a bearish zone below $160 against the US Dollar, like Bitcoin. SOL could extend losses if it stays below the $150 resistance zone.
Solana (SOL) Price Analysis
SOL price started a fresh decline below the $180 support zone. The price gained bearish momentum below the $162 support zone. The bears were able to push the price below the $155 and $150 support levels.
Bitcoin Price Analysis: BTC Takes Hit, Can This Support Hold?
April 17, 2024Bitcoin price started a fresh decline below the $65,000 level against the US Dollar.
The price is now trading below $65,500 and the 55 simple moving average (4 hours).
There is a key bearish trend line forming with resistance near $64,550 on the 4-hour chart of the BTC/USD pair (data feed from Coinbase).
The pair could face heavy resistance near the $64,500 zone in the near term.
Bitcoin price is declining below $66,000 against the US Dollar. BTC might extend losses if it stays below the $65,000 resistance zone.
Bitcoin Price Analysis
Bitcoin price started a fresh decline below the $67,000 zone. There was a steady decline below the $66,000 and $65,000 levels to move further in a bearish zone.
The bears even pushed the price below the $63,200 and $62,000 support
Cardano (ADA) Price Analysis: Bears In Action Below $0.52
April 16, 2024ADA price is trading in a bearish zone below the $0.520 support zone against the US Dollar.
The price is now trading below $0.500 and the 55 simple moving average (4 hours).
There is a connecting bearish trend line forming with resistance near $0.4940 on the 4-hour chart (data feed via Coinbase).
The price could continue to move down if it stays below the $0.520 resistance zone.
Cardano price is struggling below $0.520 against the US Dollar, like Bitcoin. ADA price could start a fresh increase if it clears the $0.500 and $0.520 resistance levels.
Cardano Price (ADA) Analysis
In the past few days, Cardano price started a fresh decline from the $0.550 resistance against the US Dollar. The ADA/USD pair declined below the $0.520 and $0.500 support levels.
The price
Ethereum Price Analysis: ETH Revisits Support As Bears Take Control
April 16, 2024Ethereum price is struggling below the $3,400 resistance against the US Dollar.
ETH price is now trading below $3,320 and the 55 simple moving average (4 hours).
There is a key bearish trend line forming with resistance near $3,200 on the 4-hour chart (data feed from Coinbase).
The pair could continue to move down if it stays below $3,200 and $3,320.
Ethereum price is declining below $3,400 against the US Dollar. ETH/USD remains at a risk of more downsides if it fails to recover above $3,320.
Ethereum Price Analysis
This past week, Ethereum struggled to stay above the $3,500 level against the US Dollar. ETH price started a fresh decline and traded below the $3,400 pivot level.
It traded below $3,320 and $3,200 support levels to enter a bearish zone. There was
Stellar Lumen (XLM) Price Recovery Faces Many Hurdles At $0.1150
April 15, 2024Stellar lumen price is attempting a recovery wave from the $0.0920 zone against the US Dollar.
XLM price is now trading below $0.1200 and the 55 simple moving average (4 hours).
There is a key bearish trend line forming with resistance at $0.1195 on the 4-hour chart (data feed via Kraken).
The pair could start a decent increase if there is a clear move above the $0.1200 resistance zone.
Stellar lumen price is consolidating above $0.1020 against the US Dollar, like Bitcoin. XLM price must clear $0.1200 to gain bullish momentum.
Stellar Lumen Price Analysis (XLM to USD)
After a steady increase, Stellar lumen price saw a rejection pattern near the $0.1365 zone against the US Dollar. The XLM/USD pair traded below the $0.1200 support and tested the $0.1150 zone.
A
XRP Price Analysis: Bulls Aim Recovery To $0.58
April 15, 2024XRP price is attempting a recovery wave from the $0.3850 zone against the US dollar.
The price is now trading below $0.550 and the 55 simple moving average (4 hours).
There was a break below a key bullish trend line with support near $0.600 on the 4-hour chart of the XRP/USD pair (data source from Kraken).
The pair could start a fresh increase if it clears the $0.5150 resistance.
XRP price is consolidating near $0.500 against the US Dollar, like Bitcoin. It must stay above the $0.4580 support to start a fresh increase.
XRP Price Analysis
This past week, XRP price made another attempt to clear the $0.6420 resistance against the US Dollar. The XRP/USD pair struggled to clear $0.6420 and started a sharp decline.
There was a move below the $0.600 and $0.550 support
Bitcoin Cash Analysis: Bulls Continue To Protect Key Support
April 12, 2024Bitcoin cash is eyeing a fresh increase above the $650 resistance against the US Dollar.
The price is now trading below the $640 zone and the 55 simple moving average (4 hours).
There is a key contracting triangle forming with resistance at $655 on the 4-hour chart of the BCH/USD pair (data feed from Coinbase).
The pair must clear $650 and $655 to start a fresh increase in the near term.
Bitcoin cash price is consolidating gains above $600 against the US Dollar, unlike Bitcoin. BCH/USD could start a fresh surge if it clears the $655 level.
Bitcoin Cash Price Analysis
Bitcoin cash price started a pullback from the $720 zone. BCH traded below the $700 and $650 support levels to enter a short-term bearish zone.
A low was formed near $596 before the price found
EOS Price Analysis: Bulls Aim For Move Above $1.15
April 11, 2024EOS price started a downside correction from the $1.1420 zone against the US Dollar.
The price is now trading above $1.050 and the 55 simple moving average (4 hours).
There is a key bullish trend line forming with support near $1.0350 on the 4-hour chart of the EOS/USD pair (data feed from Coinbase).
The pair could continue to move up if it stays above the $1.035 and $1.00 support levels.
EOS price is rising above $1.050 against the US Dollar, like Bitcoin. The price could attempt a fresh increase unless there is a break below $1.00.
EOS Price Analysis
In the past few days, EOS price climbed higher above the $1.050 resistance zone against the US Dollar. The price surpassed the $1.10 level and settled above the 55 simple moving average (4 hours).
A high was
Litecoin (LTC) Price Analysis: This Support Holds The Key To Fresh Increase
April 11, 2024Litecoin is holding gains above the $92.00 support against the US Dollar.
LTC price is now trading below $100.00 and the 55 simple moving average (4 hours).
There is a key bearish trend line forming with resistance near $101.50 on the 4-hour chart of the LTC/USD pair (data feed from Coinbase).
The pair could gain bullish momentum if it clears the $100.00 and $101.50 resistance levels.
Litecoin price is holding gains above $92 against the US Dollar, like Bitcoin. LTC price could climb again if there is a clear move above $101.50.
Litecoin Price Analysis
In the past few sessions, there were range moves in Bitcoin, Ethereum, Ripple, and Litecoin against the US Dollar. Earlier, LTC struggled to clear the $106 resistance zone and started a fresh decline.
There was a
Solana (SOL) Price Analysis: Bears Take Control Below $180
April 10, 2024Solana price gained bearish momentum below the $185 level against the US Dollar.
The price is now trading below $180 and the 55 simple moving average (4 hours).
There is a key bearish trend line forming with resistance near $176.50 on the 4-hour chart of the SOL/USD pair (data feed from Coinbase).
The pair could recover, but the upsides might be limited above the $180 resistance.
Solana price is trading in a short-term bearish zone below $180 against the US Dollar, like Bitcoin. SOL could accelerate further lower if it stays below the $180 resistance zone.
Solana (SOL) Price Analysis
SOL price started a fresh decline below the $200 support zone. The price gained bearish momentum below the $192 support zone. The bears were able to push the price below the $180
Cardano (ADA) Price Analysis: Can Bulls Clear This Hurdle?
April 9, 2024ADA price is attempting a fresh increase from the $0.5600 zone against the US Dollar.
The price is now trading above $0.600 and the 55 simple moving average (4 hours).
There is a major bearish trend line forming with resistance at $0.620 on the 4-hour chart (data feed via Coinbase).
The price could gain bullish momentum if it clears the $0.620 and $0.650 levels.
Cardano price is holding the $0.580 support against the US Dollar, like Bitcoin. ADA price could gain bullish momentum if it clears the $0.620 resistance.
Cardano Price (ADA) Analysis
This past week, Cardano price started a fresh decline from well above the $0.650 zone against the US Dollar. The ADA/USD pair declined below the $0.620 and $0.600 support levels.
It tested the $0.5600 zone. A low was

