Stellar lumen price is attempting a recovery wave from the %excerpt%.0920 zone against the US Dollar. XLM price is now trading below %excerpt%.1200 and the 55 simple moving average (4 hours). There is a key bearish trend line forming with resistance at %excerpt%.1195 on the 4-hour chart (data feed via Kraken). The pair could start a decent increase if there is a clear move above the %excerpt%.1200 resistance zone. Stellar lumen price is consolidating above %excerpt%.1020 against the US Dollar, like Bitcoin. XLM price must clear %excerpt%.1200 to gain bullish momentum. Stellar Lumen Price Analysis (XLM to USD) After a steady increase, Stellar lumen price saw a rejection pattern near the %excerpt%.1365 zone against the US Dollar. The XLM/USD pair traded below the %excerpt%.1200 support and tested the %excerpt%.1150 zone. A
Topics:
Aayush Jindal considers the following as important: Altcoin News, News, Stellar Lumens, Trading, xlm
This could be interesting, too:
Bilal Hassan writes Morocco Cracks Down on Crypto Property Deals
Bilal Hassan writes Crypto Becomes a U.S. ‘Weapon,’ Says CryptoQuant CEO
Bilal Hassan writes White House Crypto Czar Sold Holdings After Trump Took Office
Bilal Hassan writes CZ Suggests Safe Token Release Based on Price Growth
- Stellar lumen price is attempting a recovery wave from the $0.0920 zone against the US Dollar.
- XLM price is now trading below $0.1200 and the 55 simple moving average (4 hours).
- There is a key bearish trend line forming with resistance at $0.1195 on the 4-hour chart (data feed via Kraken).
- The pair could start a decent increase if there is a clear move above the $0.1200 resistance zone.
Stellar lumen price is consolidating above $0.1020 against the US Dollar, like Bitcoin. XLM price must clear $0.1200 to gain bullish momentum.
Stellar Lumen Price Analysis (XLM to USD)
After a steady increase, Stellar lumen price saw a rejection pattern near the $0.1365 zone against the US Dollar. The XLM/USD pair traded below the $0.1200 support and tested the $0.1150 zone.
A low was formed near $0.09151 and the price is now attempting a recovery wave. There was a break above the $0.1000 resistance zone. The price climbed above the 23.6% Fib retracement level of the downward move from the $0.1367 swing high to the $0.09151 low.
XLM is still trading below $0.1200 and the 55 simple moving average (4 hours). On the upside, the price is facing resistance near the $0.1142 zone. It is near the 50% Fib retracement level of the downward move from the $0.1367 swing high to the $0.09151 low.
The next major resistance is near the $0.1195 level. There is also a key bearish trend line forming with resistance at $0.1195 on the 4-hour chart. A clear move above the $0.1195 level might send the price toward the $0.1250 level.
Any more gains could lead the price toward the $0.1285 level or even $0.1320. Initial support on the downside is near the $0.1050 level. The main support is near the $0.1000 zone. Any more losses could lead the price toward the $0.0920 level in the near term, below which the price might even retest $0.0880.
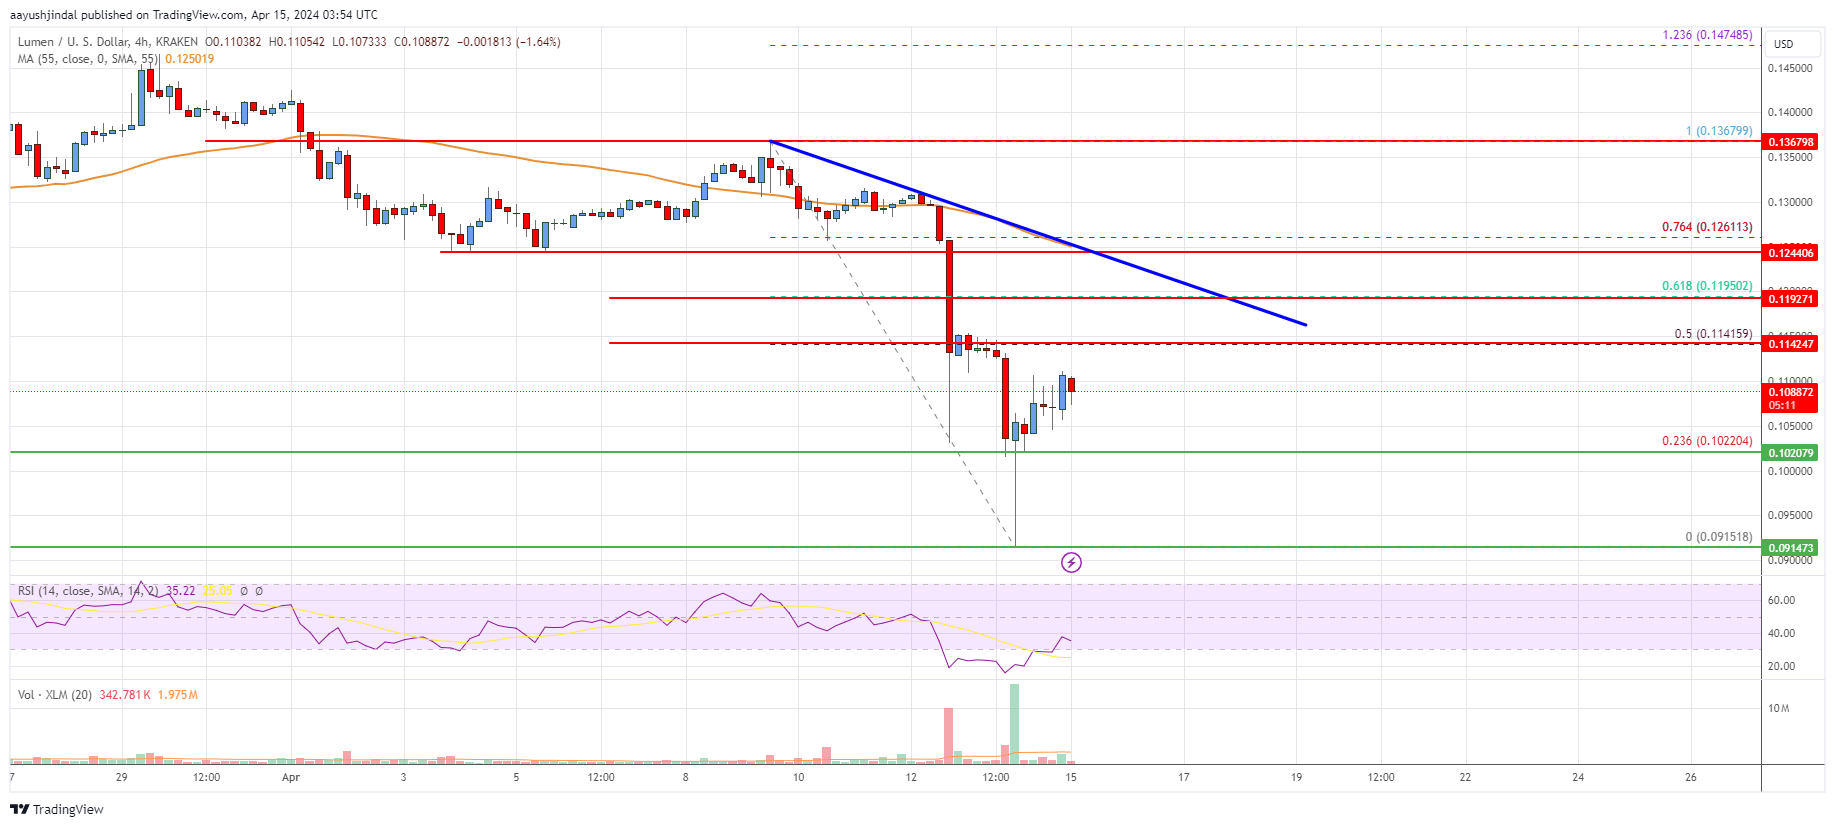
The chart indicates that XLM price is now trading below $0.1150 and the 55 simple moving average (4 hours). Overall, the price could start a major increase if there is a clear move above the $0.120 resistance zone.
Technical Indicators
4 hours MACD – The MACD for XLM/USD is losing momentum in the bearish zone.
4 hours RSI – The RSI for XLM/USD is now below the 50 level.
Key Support Levels – $0.1020 and $0.0920.
Key Resistance Levels – $0.1142, $0.1195, and $0.1250.