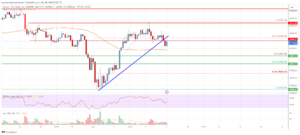
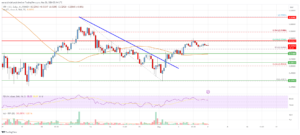
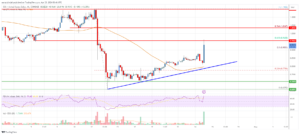
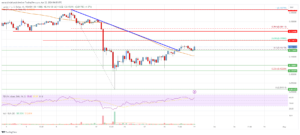
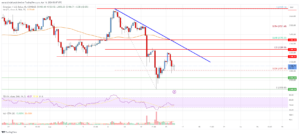
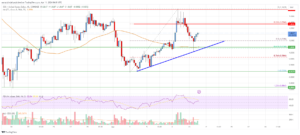
Solana price started a downside correction from the $160 zone against the US Dollar.
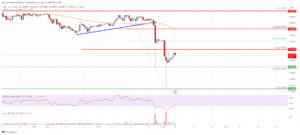
The price is now trading above $140 and the 55 simple moving average (4 hours).
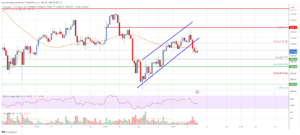
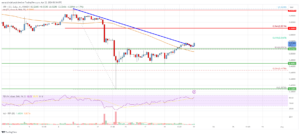
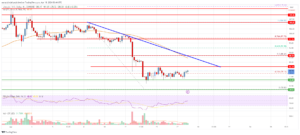
There was a break below a key bullish trend line with support at $152 on the 4-hour chart of the SOL/USD pair (data feed from Coinbase).
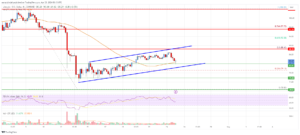
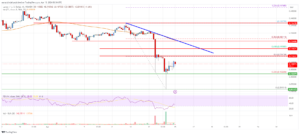
The pair must stay above the $138 and $135 support levels to start another increase.
Solana price is correcting gains from $160 against the US Dollar, like Bitcoin. SOL could start another increase if the bulls remain active above $135.
Solana (SOL) Price Analysis
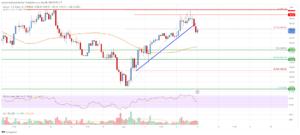
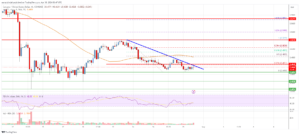
SOL price attempted more upsides above the $150 resistance zone. The price climbed above the $155 zone, but the bears were active near the $160 zone.
A high was formed near $159.38 before there was a
Solana (SOL) Price Analysis: Dips Attractive Near $135
May 8, 2024