Ethereum price is struggling below the ,400 resistance against the US Dollar. ETH price is now trading below ,320 and the 55 simple moving average (4 hours). There is a key bearish trend line forming with resistance near ,200 on the 4-hour chart (data feed from Coinbase). The pair could continue to move down if it stays below ,200 and ,320. Ethereum price is declining below ,400 against the US Dollar. ETH/USD remains at a risk of more downsides if it fails to recover above ,320. Ethereum Price Analysis This past week, Ethereum struggled to stay above the ,500 level against the US Dollar. ETH price started a fresh decline and traded below the ,400 pivot level. It traded below ,320 and ,200 support levels to enter a bearish zone. There was
Topics:
Aayush Jindal considers the following as important: Altcoin News, ETH, News, Trading
This could be interesting, too:
Bilal Hassan writes Morocco to Become First Developing Country with Clear Crypto Regulations
Bilal Hassan writes Cryptopia Liquidators Distribute 0 Million to Victims of 2019 Hack
Bilal Hassan writes Mo Shaikh Steps Down as CEO of Aptos Labs to Start New Chapter
Bilal Hassan writes FTX Announces January 2025 as Effective Date for Reorganization Plan
- Ethereum price is struggling below the $3,400 resistance against the US Dollar.
- ETH price is now trading below $3,320 and the 55 simple moving average (4 hours).
- There is a key bearish trend line forming with resistance near $3,200 on the 4-hour chart (data feed from Coinbase).
- The pair could continue to move down if it stays below $3,200 and $3,320.
Ethereum price is declining below $3,400 against the US Dollar. ETH/USD remains at a risk of more downsides if it fails to recover above $3,320.
Ethereum Price Analysis
This past week, Ethereum struggled to stay above the $3,500 level against the US Dollar. ETH price started a fresh decline and traded below the $3,400 pivot level.
It traded below $3,320 and $3,200 support levels to enter a bearish zone. There was also a break below the $3,000 level. A low is formed near $2,850 and the price is now correcting losses. ETH is now trading below $3,320 and the 55 simple moving average (4 hours).
There is also a key bearish trend line forming with resistance near $3,200 on the 4-hour chart. The trend line is near the 50% Fib retracement level of the downward move from the $3,729 swing high to the $2,850 low.
On the upside, the price is now facing resistance near the $3,200 level and the trend line. The next major resistance is near the $3,320 level. The main resistance is now forming near the $3,400 level. It is close to the 61.8% Fib retracement level of the downward move from the $3,729 swing high to the $2,850 low, above which the price could test the $3,550 resistance.
A clear move above the $3,550 resistance could send the price toward $3,750. On the downside, initial support is near the $3,050 level. The next major support is now near the $2,980 level. A break below the $2,980 support could push the price to $2,850. If the bulls fail to protect the $2,850 support, the price might decline toward $2,550.
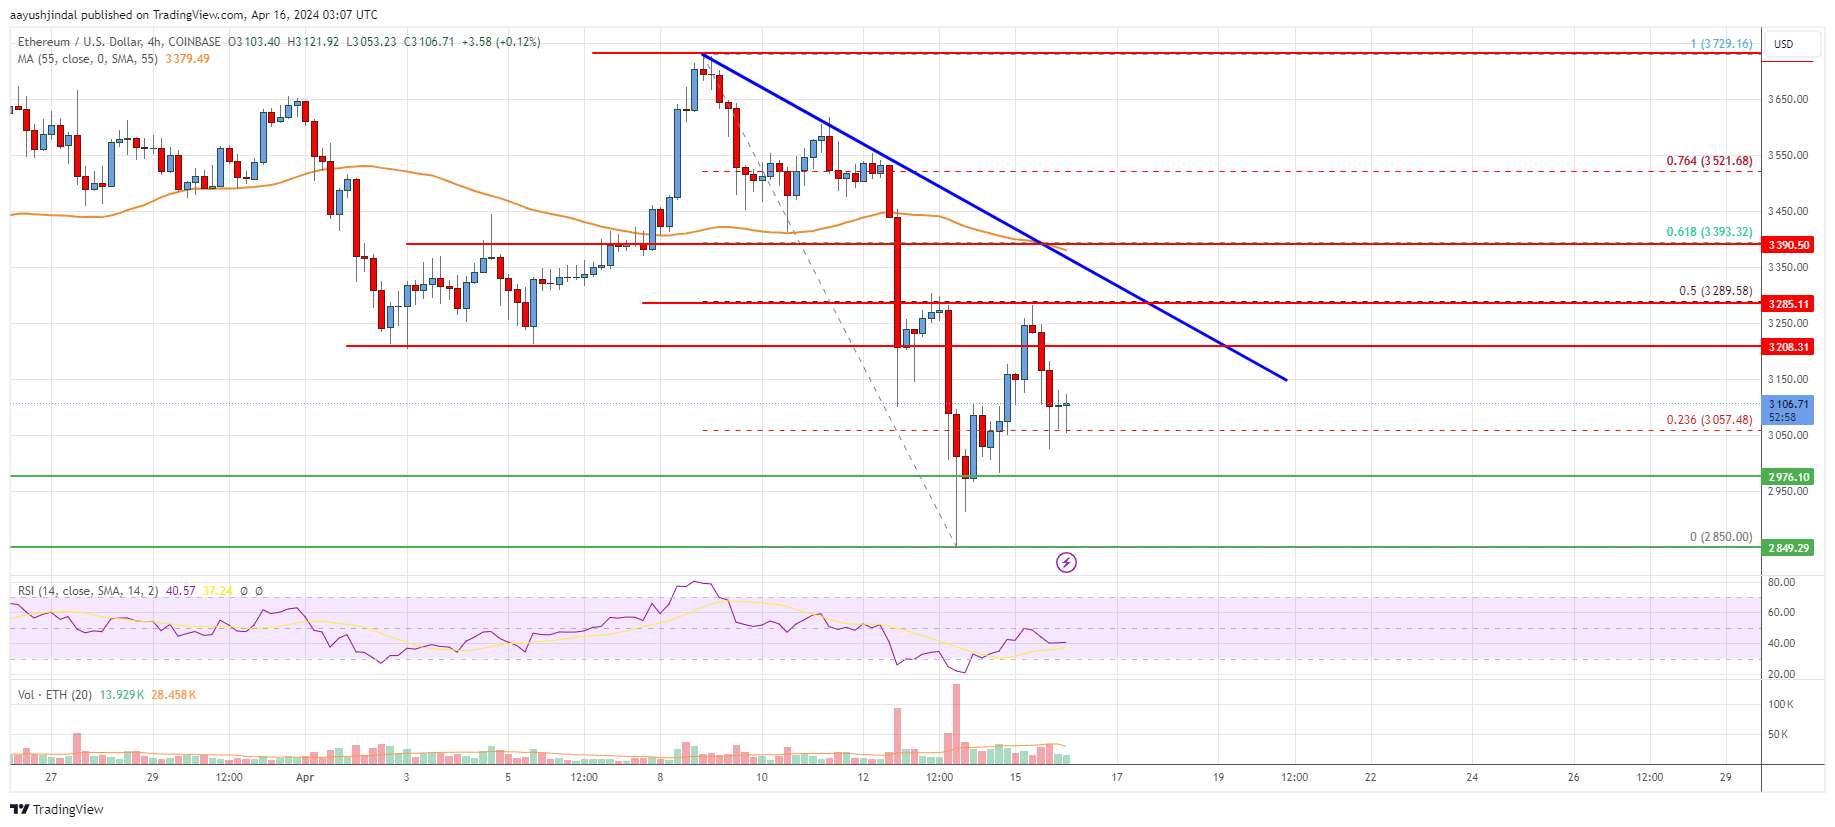
Looking at the chart, Ethereum price is trading below $3,320 and the 55 simple moving average (4 hours). Overall, Ether’s price could continue to move down if it stays below $3,200 and $3,320.
Technical indicators
4 hours MACD – The MACD for ETH/USD is now gaining momentum in the bearish zone.
4 hours RSI (Relative Strength Index) – The RSI for ETH/USD is now below the 50 level.
Key Support Levels – $3,050, followed by the $2,850 zone.
Key Resistance$ Levels – $3,200 and $3,320.