Shiba Inu’s native token has been demonstrating bearish price action over the past few weeks since getting rejected at a critical resistance level. Yet, a more severe decline may still occur in the short term. Technical Analysis By Edris The SHIB/USDT Chart On the USDT-paired chart, the price has been rejected from the %excerpt%.000011 resistance level, leading to an impulsive drop below the 50-day and the 200-day moving averages located around the %excerpt%.0000085 and %excerpt%.0000095 levels, respectively. The 50-day moving average is currently driving the price down, preventing a possible recovery. If SHIB fails to climb above the mentioned moving average’s resistance line, it will likely target the significant %excerpt%.000006 support zone in the next few weeks. The SHIB/BTC Chart Looking at
Topics:
CryptoVizArt considers the following as important: Price Analysis, Shiba Inu (SHIB), SHIBBTC, SHIBUSD
This could be interesting, too:
Dimitar Dzhondzhorov writes Watch Out: Shiba Inu (SHIB) Team Issues a Major Warning to the Community
Dimitar Dzhondzhorov writes Shiba Inu (SHIB) Might Plunge by Another 30% Before Finding Support (Analyst)
Jordan Lyanchev writes Shiba Inu Price Forecasts: Another 50% Crash or 420% Rally Ahead for SHIB?
Dimitar Dzhondzhorov writes This Trader Made Over Million by Selling Shiba Inu (SHIB) Holdings: Details
Shiba Inu’s native token has been demonstrating bearish price action over the past few weeks since getting rejected at a critical resistance level. Yet, a more severe decline may still occur in the short term.
Technical Analysis
By Edris
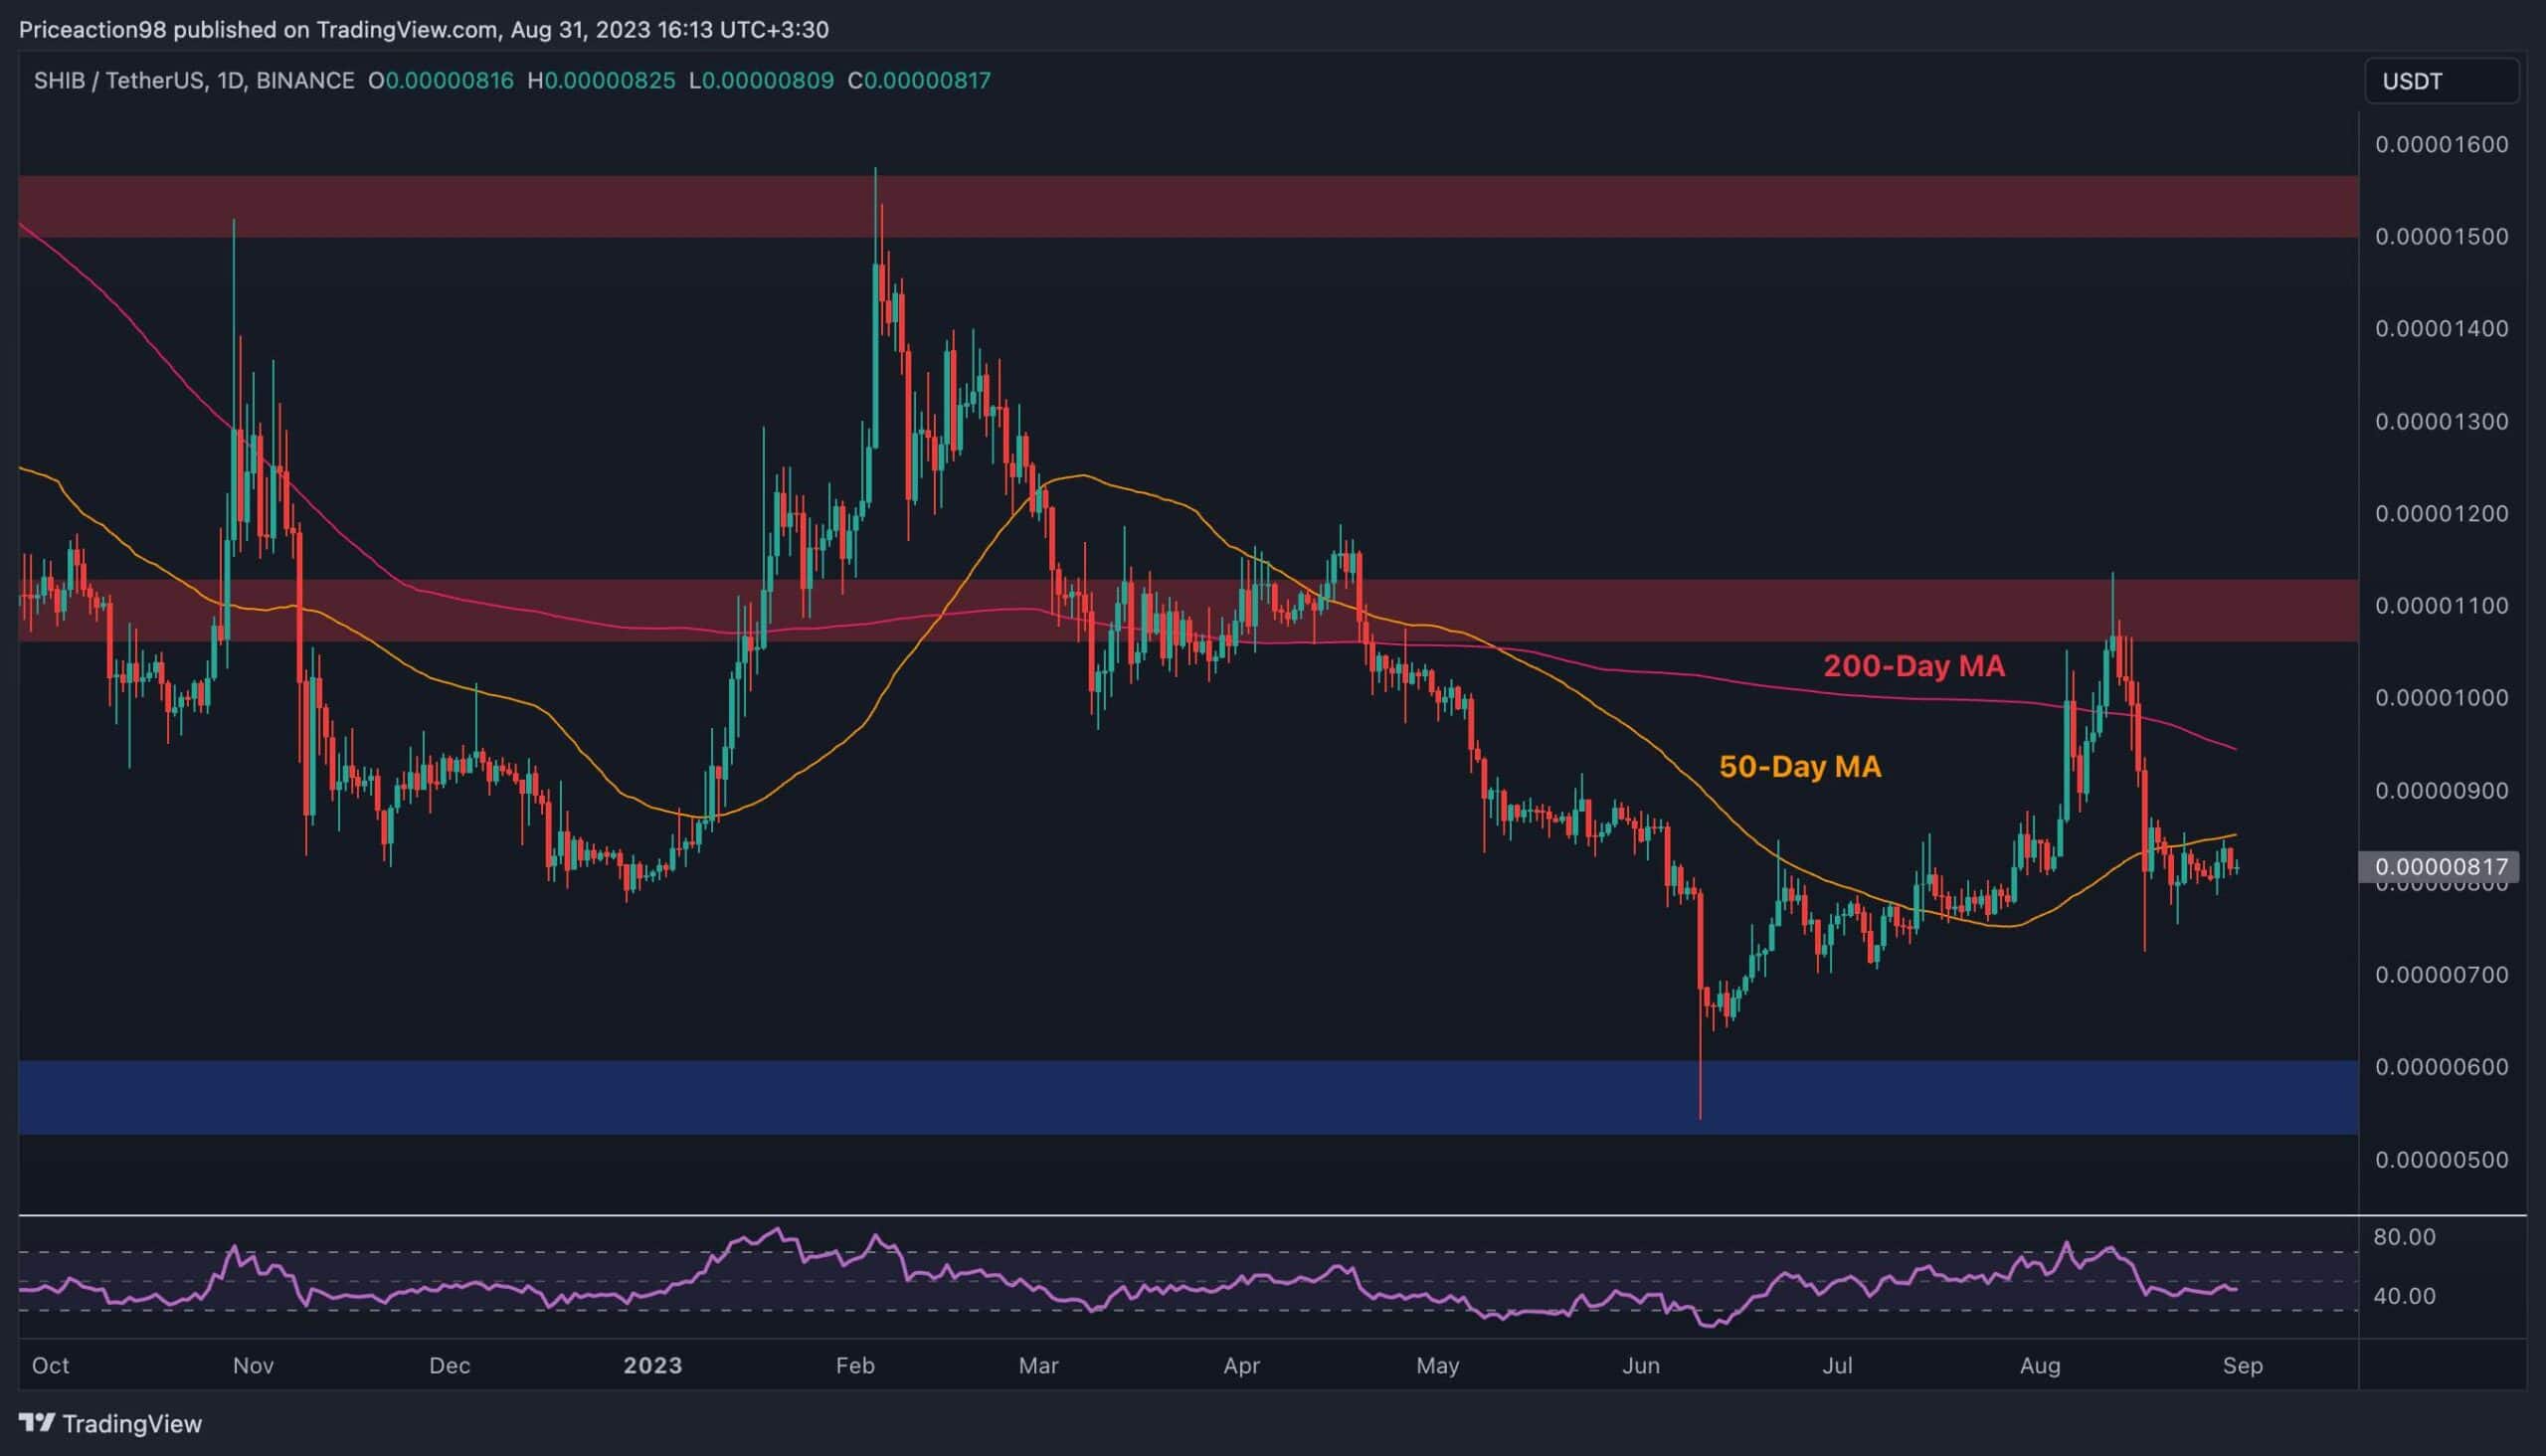
The SHIB/USDT Chart
On the USDT-paired chart, the price has been rejected from the $0.000011 resistance level, leading to an impulsive drop below the 50-day and the 200-day moving averages located around the $0.0000085 and $0.0000095 levels, respectively.
The 50-day moving average is currently driving the price down, preventing a possible recovery. If SHIB fails to climb above the mentioned moving average’s resistance line, it will likely target the significant $0.000006 support zone in the next few weeks.
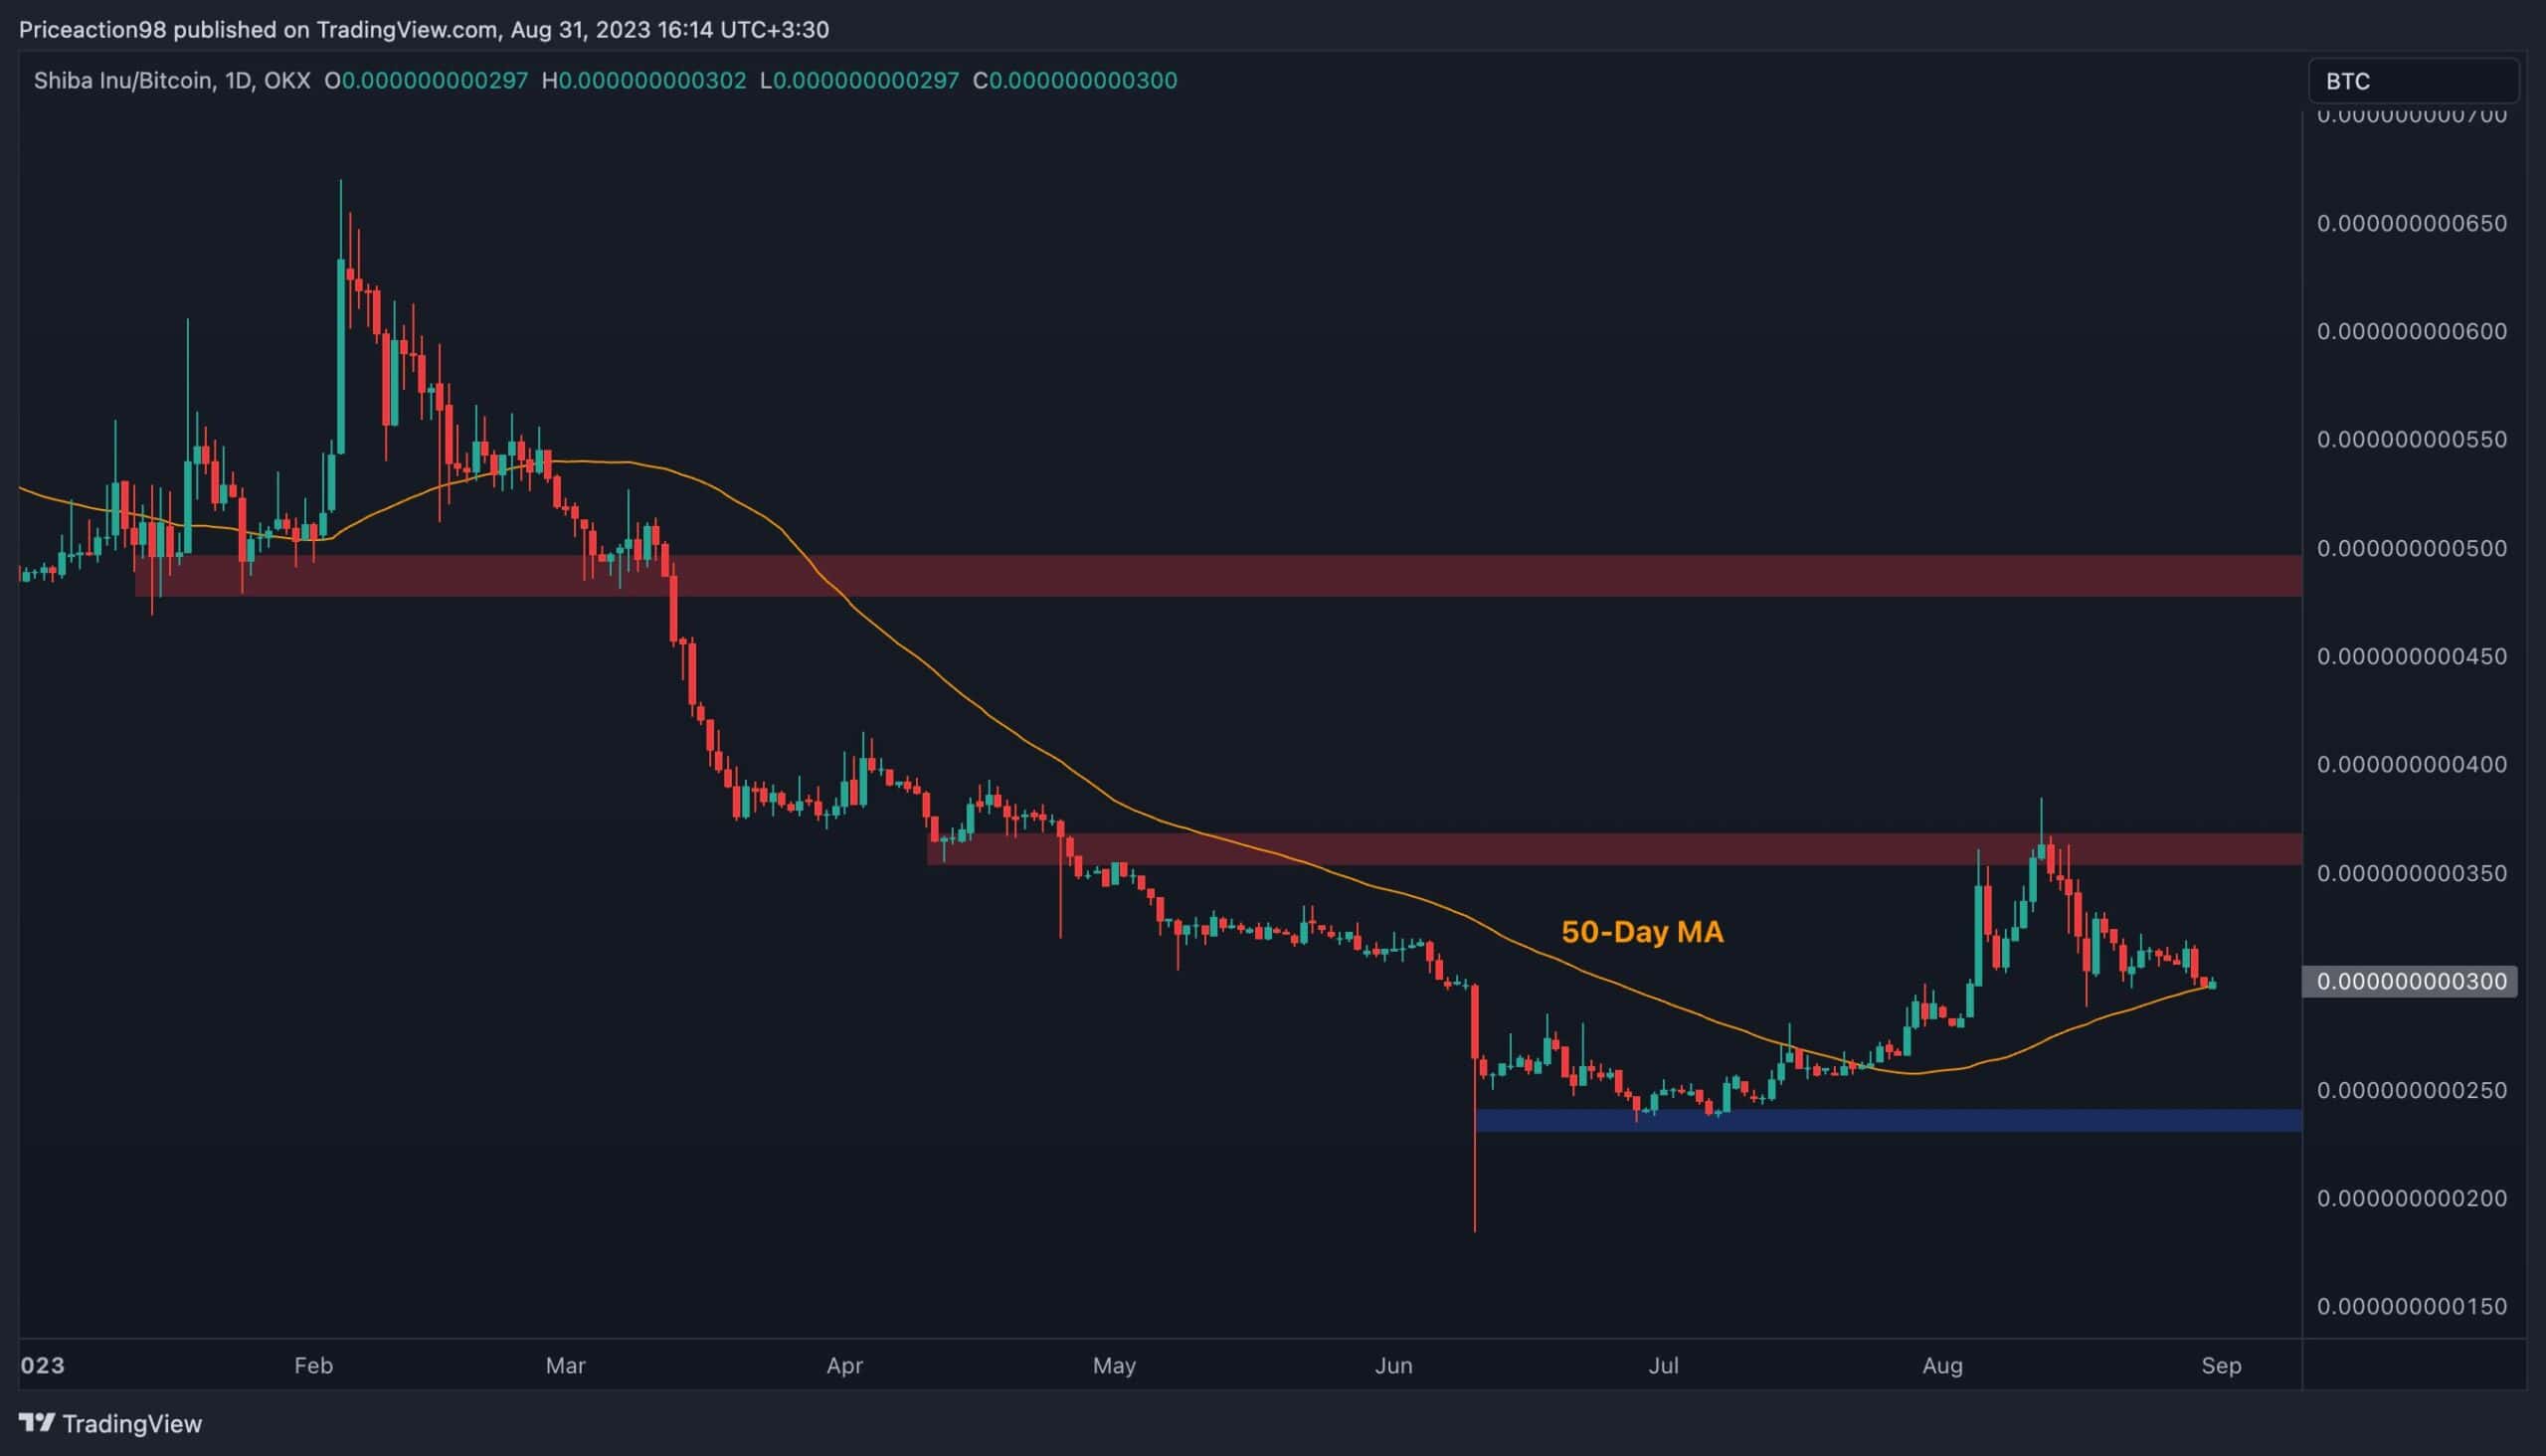
The SHIB/BTC Chart
Looking at the Bitcoin pair chart, things are quite similar. The price has been rejected from the 0.035 SAT resistance level and has decreased since.
The 50-day moving average currently provides support around the 0.03 SAT mark, and it could initiate a rally and retest of the 0.035 SAT if it holds. On the other hand, a bearish breakout could result in a drop toward the 0.024 SAT zone, which could be the investors’ last resort.