Bitcoin’s price is currently going through a phase of consolidation and has reached the 100-day moving average of ,922. However, two significant support areas ahead on its path could potentially halt the ongoing decline and trigger the next bullish rally. Technical Analysis By Shayan The Daily Chart During the consolidation correction stage, BTC dipped slightly below the middle trendline of the ascending channel and tested it as a pullback. However, the Bitcoin price continued the downtrend by printing small consecutive red candles and temporarily stalled at the 100-day moving average of .9K. If it falls below the 100-day moving average, the lower threshold of the channel of around K and the 200-day moving average of K could be potential price targets. On the
Topics:
CryptoVizArt considers the following as important: Bitcoin (BTC) Price, BTC Analysis, btcusd, btcusdt
This could be interesting, too:
Chayanika Deka writes XRP, SOL, and ADA Inclusion in US Crypto Reserve Pushes Traders on Edge
Chayanika Deka writes Why Arthur Hayes Is Bullish on Bitcoin Under Trump’s Economic Strategy
Mandy Williams writes Why the Bitcoin Market Is Stuck—and the Key Metric That Could Change It: CryptoQuant CEO
Wayne Jones writes Metaplanet Acquires 156 BTC, Bringing Total Holdings to 2,391
Bitcoin’s price is currently going through a phase of consolidation and has reached the 100-day moving average of $26,922. However, two significant support areas ahead on its path could potentially halt the ongoing decline and trigger the next bullish rally.
Technical Analysis
By Shayan
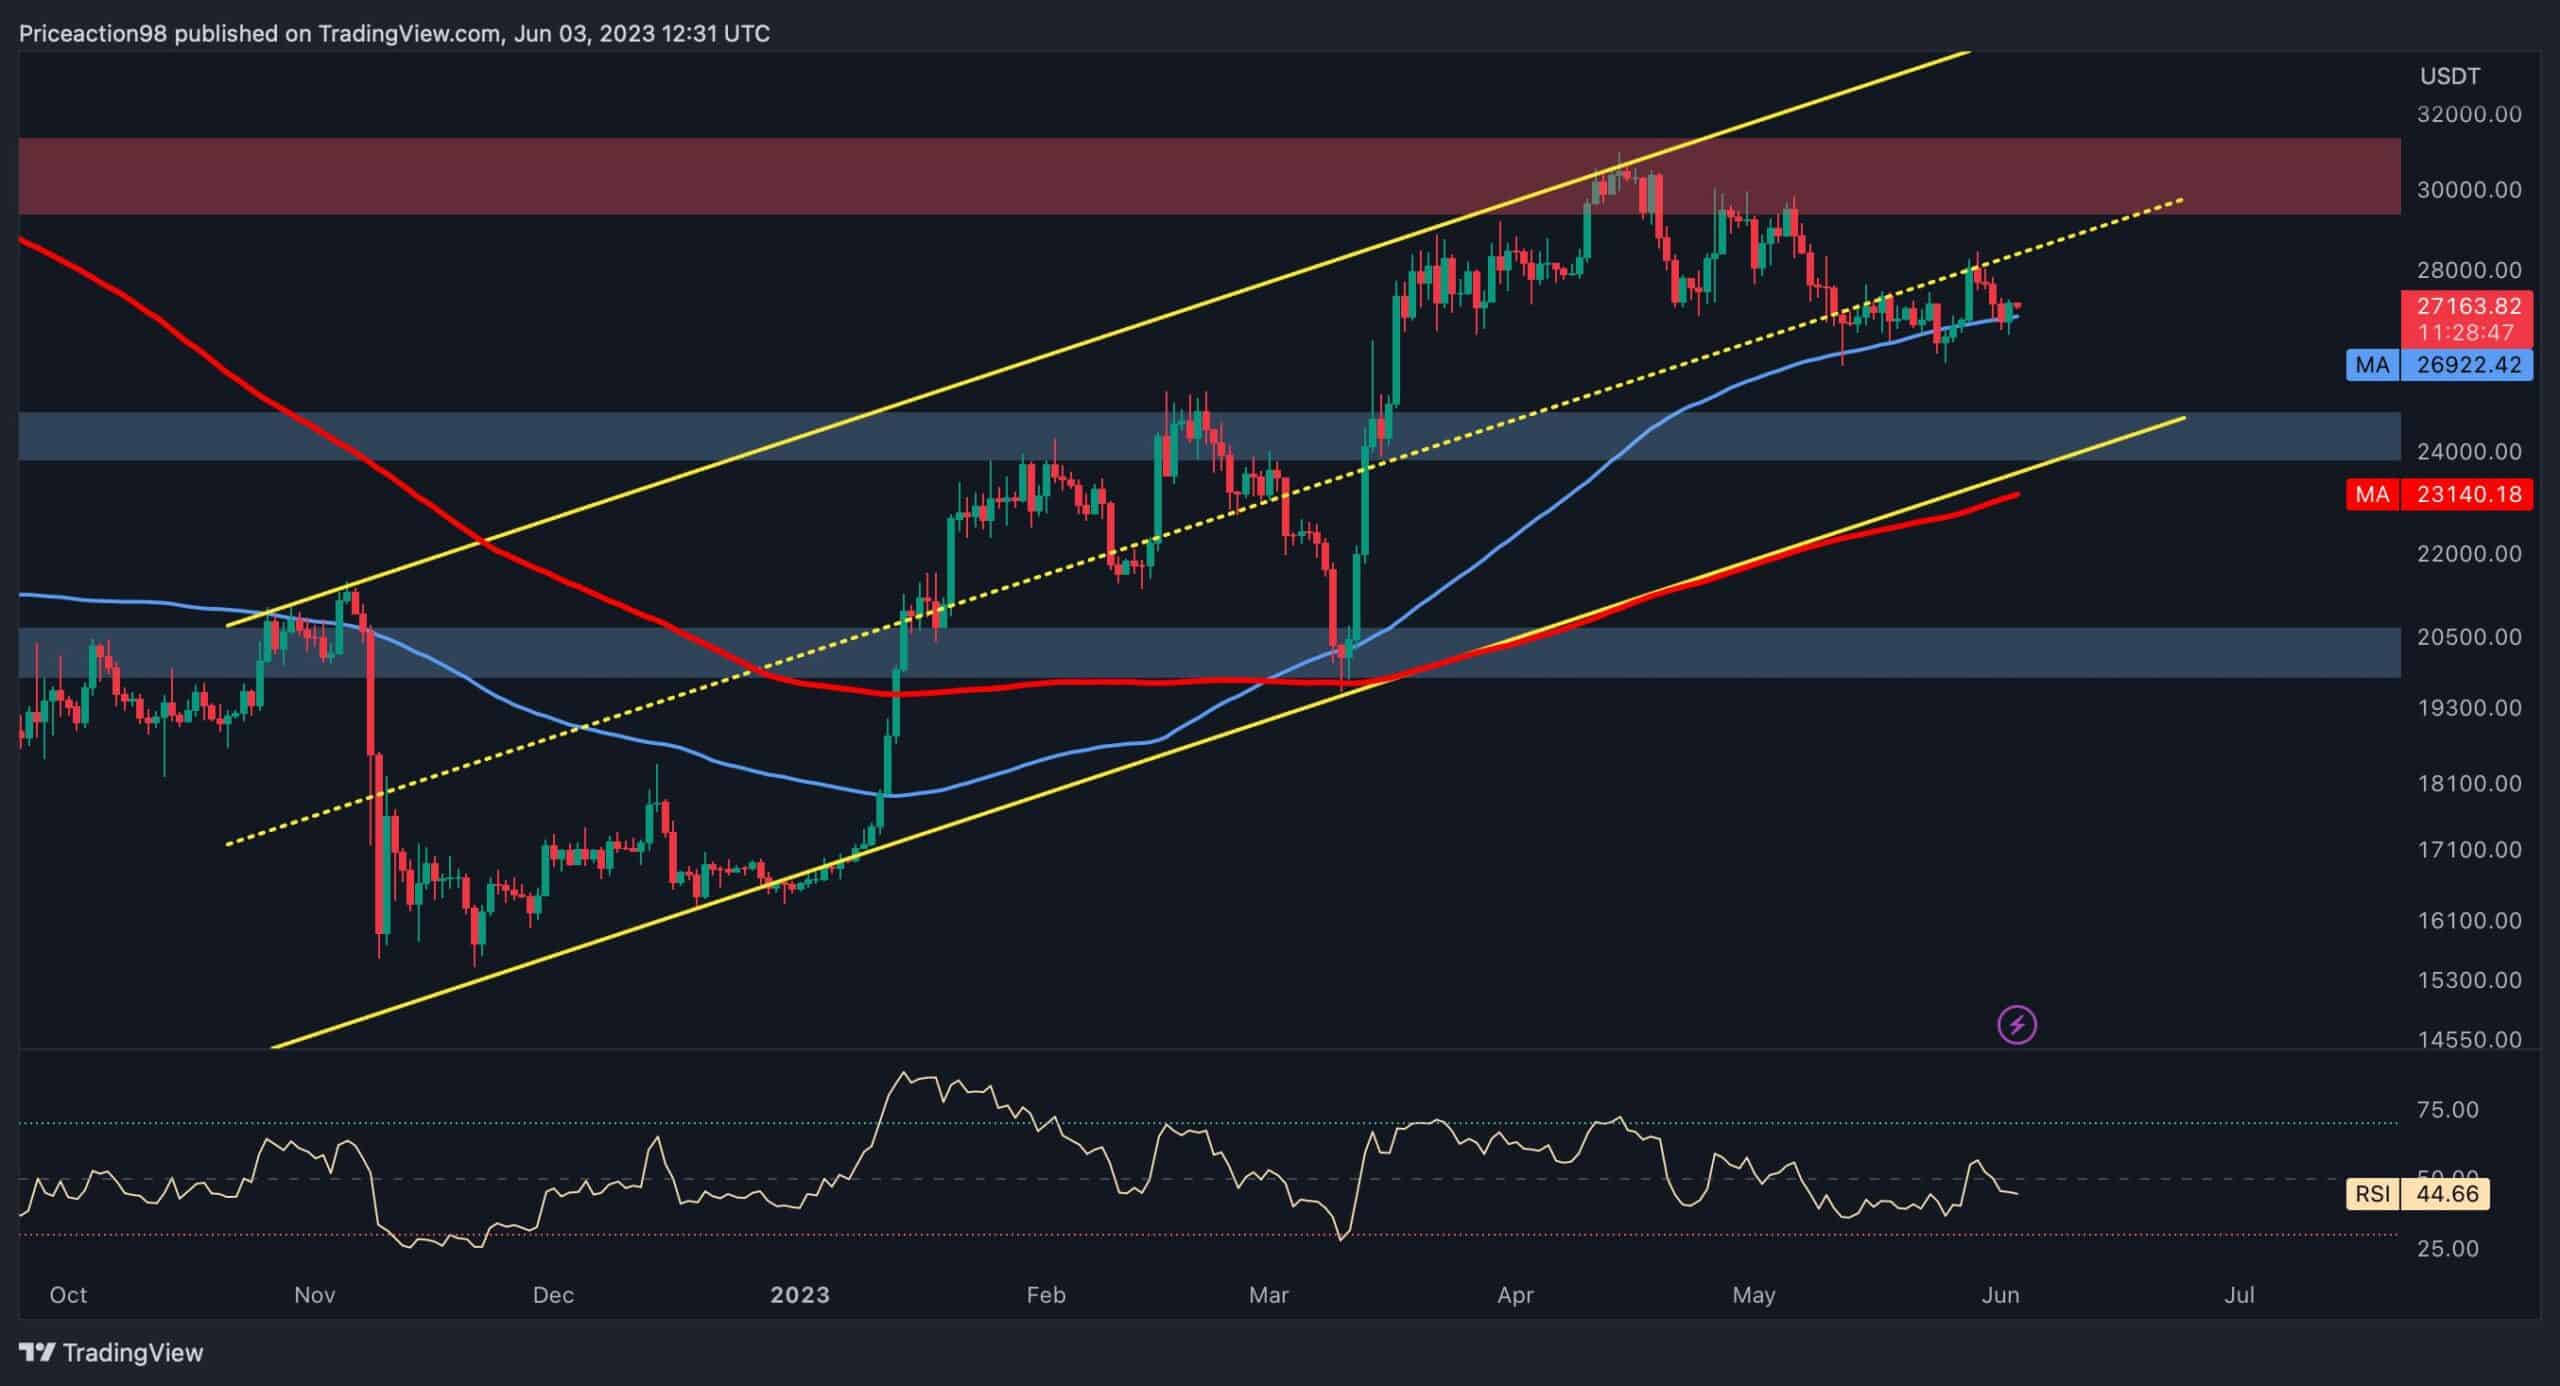
The Daily Chart
During the consolidation correction stage, BTC dipped slightly below the middle trendline of the ascending channel and tested it as a pullback. However, the Bitcoin price continued the downtrend by printing small consecutive red candles and temporarily stalled at the 100-day moving average of $26.9K.
If it falls below the 100-day moving average, the lower threshold of the channel of around $24K and the 200-day moving average of $23K could be potential price targets.
On the other hand, if Bitcoin finds support at the 100-day moving average, an attempt to surpass the significant resistance level at $30K will be the most likely scenario.
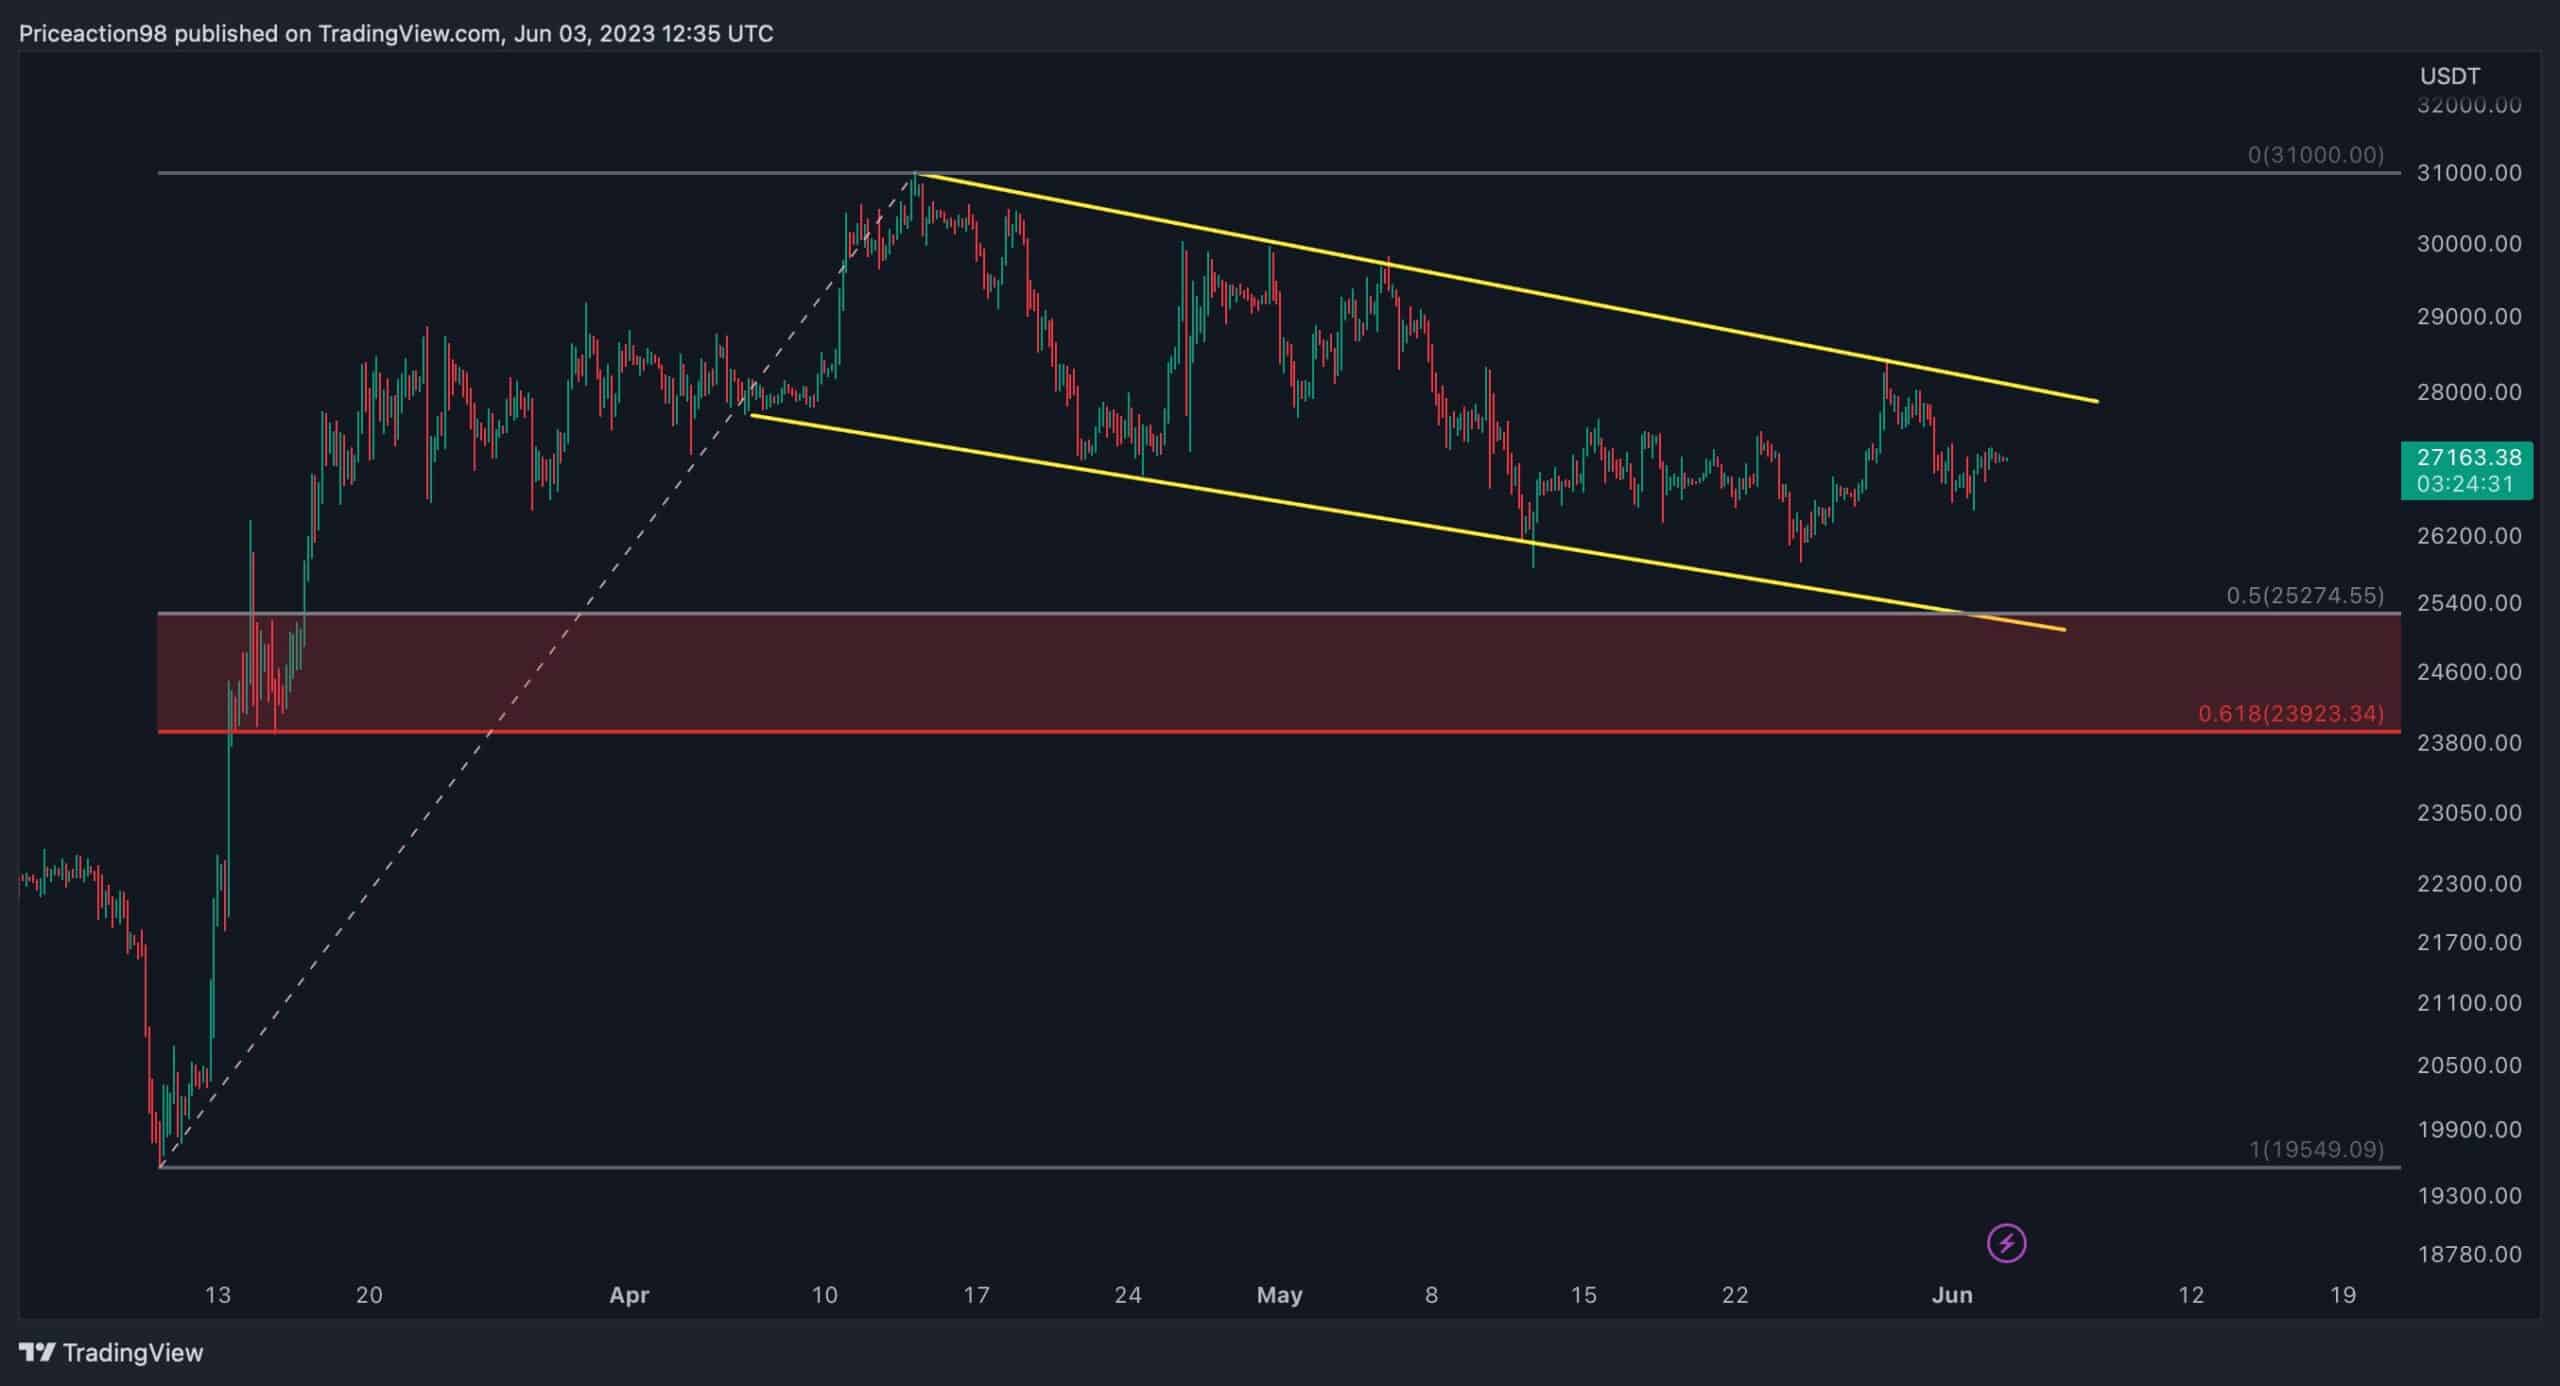
The 4-Hour Chart
Analyzing the 4-hour timeframe, a flag pattern has been developed during the recent correction phase of the market. Bitcoin’s price is currently consolidating within this flag, forming lower highs and lower lows.
However, there is a substantial support area between the 61.8% ($23,923) and 50% ($25,274) levels of the Fibonacci retracement. These two well-known Fibonacci levels indicate potential targets for correction stages. Given the market situation, it is likely that the price will continue the correction leg until it reaches this critical support zone.
On-chain Analysis
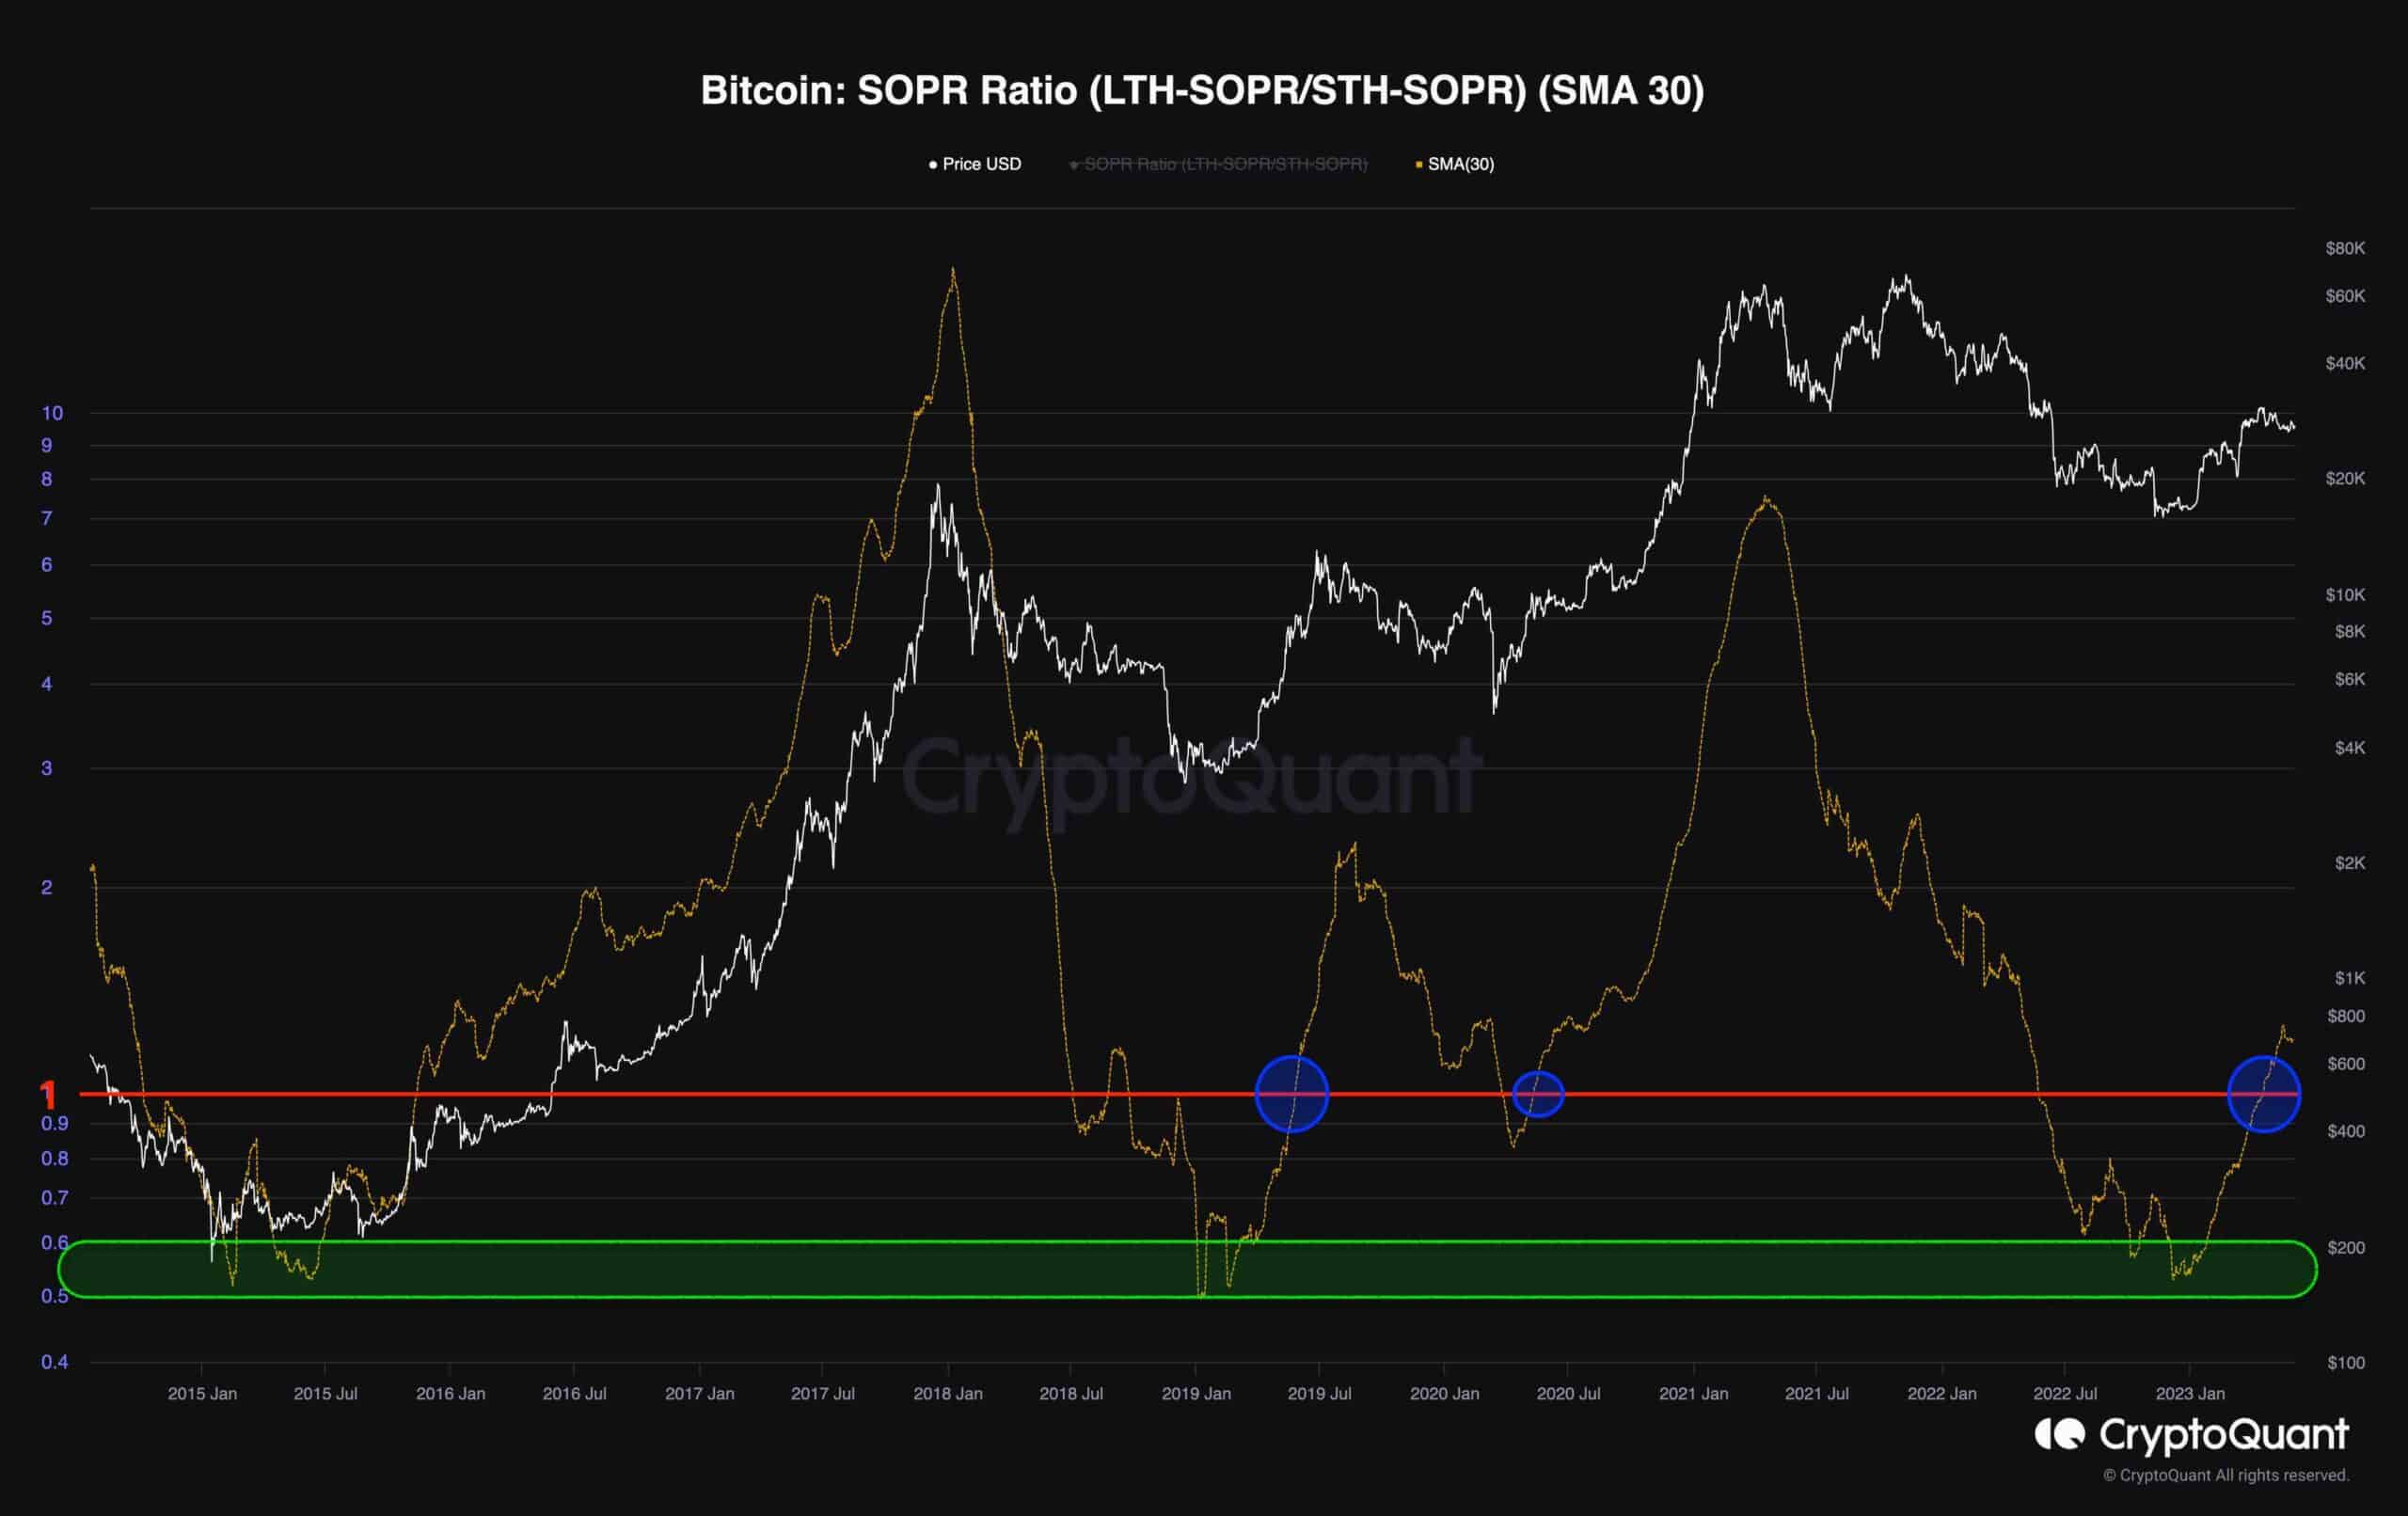
The following chart demonstrates the SOPR ratio metric alongside Bitcoin’s price since the 2015 bear market. The SOPR ratio is measured by dividing the values of long-term holders’ SOPR values by short-term holders. It has consistently signaled long-term investment opportunities, as in the previous two bearish cycles in 2015 and 2019.
This ratio reached its lowest point since 2019 – around 0.53 – in December 2022, indicating the onset of a bullish stage in the market. Currently, it is experiencing an uptrend, surpassing 1, which has historically coincided with successful bull runs in the cryptocurrency market.
Although it is uncertain whether the bull market has concluded, as long as the SOPR Ratio remains above one, the buyers are expected to continue dominating.