Technical Analysis By TradingRage Ripple’s price has been experiencing a pullback on both the USDT and BTC pairs over the last few weeks. Yet, the market might begin another bullish move soon, as the price is currently at strong support levels. The USDT Paired Chart On the USDT paired chart, the price has been on the decline over the recent weeks after it failed to move past the %excerpt%.7 mark. The %excerpt%.6 support level is currently preventing the price from dropping lower. Yet, even if this level breaks down, the 200-day moving average located around the %excerpt%.55 mark can be counted on as a turning point to push XRP higher. In this case, it is likely that a rally toward the %excerpt%.9 level will finally occur. Source: TradingViewThe BTC Paired Chart Against BTC, the price is currently
Topics:
CryptoVizArt considers the following as important: Ripple (XRP) Price, XRP Analysis, xrpbtc, xrpusd
This could be interesting, too:
Jordan Lyanchev writes Ripple’s (XRP) Surge to Triggers Over Million in Short Liquidations
Jordan Lyanchev writes Trump Confirms Work on Strategic Crypto Reserve: XRP, ADA, SOL Included
Dimitar Dzhondzhorov writes Is a Major Ripple v. SEC Lawsuit Development Expected This Week? Here’s Why
Mandy Williams writes Ripple Releases Institutional DeFi Roadmap for XRP Ledger in 2025
Technical Analysis
By TradingRage
Ripple’s price has been experiencing a pullback on both the USDT and BTC pairs over the last few weeks. Yet, the market might begin another bullish move soon, as the price is currently at strong support levels.
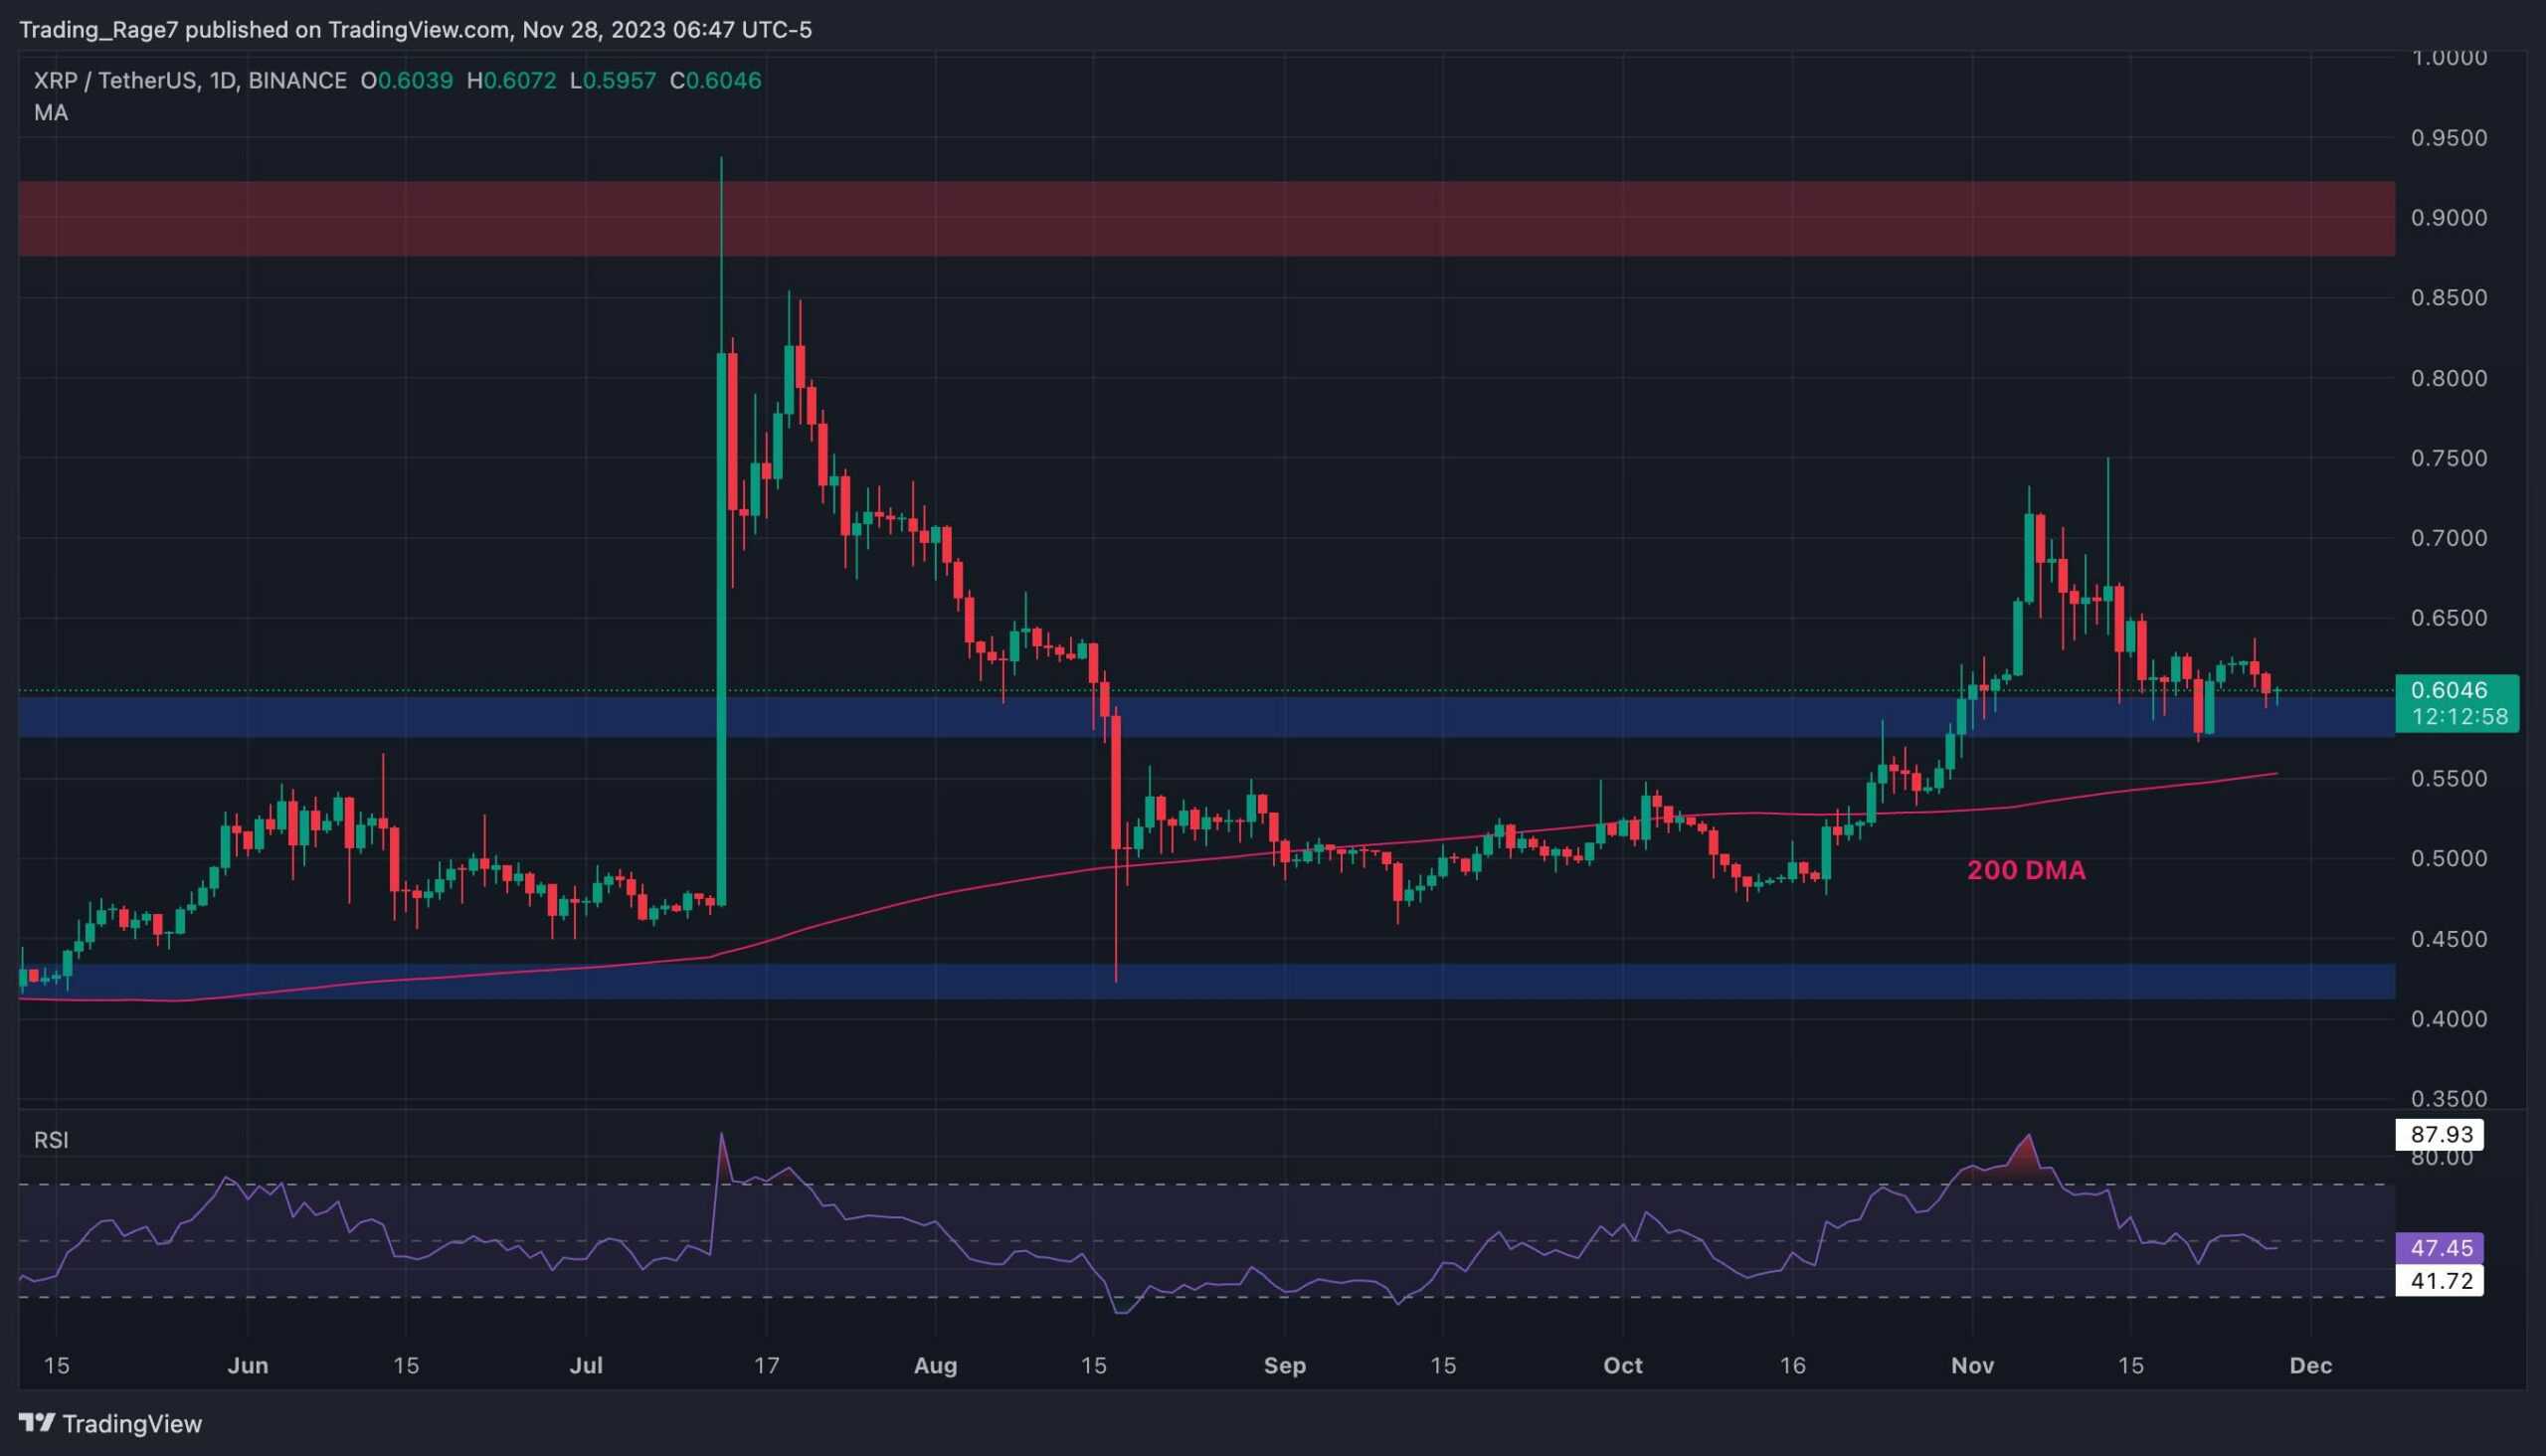
The USDT Paired Chart
On the USDT paired chart, the price has been on the decline over the recent weeks after it failed to move past the $0.7 mark.
The $0.6 support level is currently preventing the price from dropping lower. Yet, even if this level breaks down, the 200-day moving average located around the $0.55 mark can be counted on as a turning point to push XRP higher. In this case, it is likely that a rally toward the $0.9 level will finally occur.
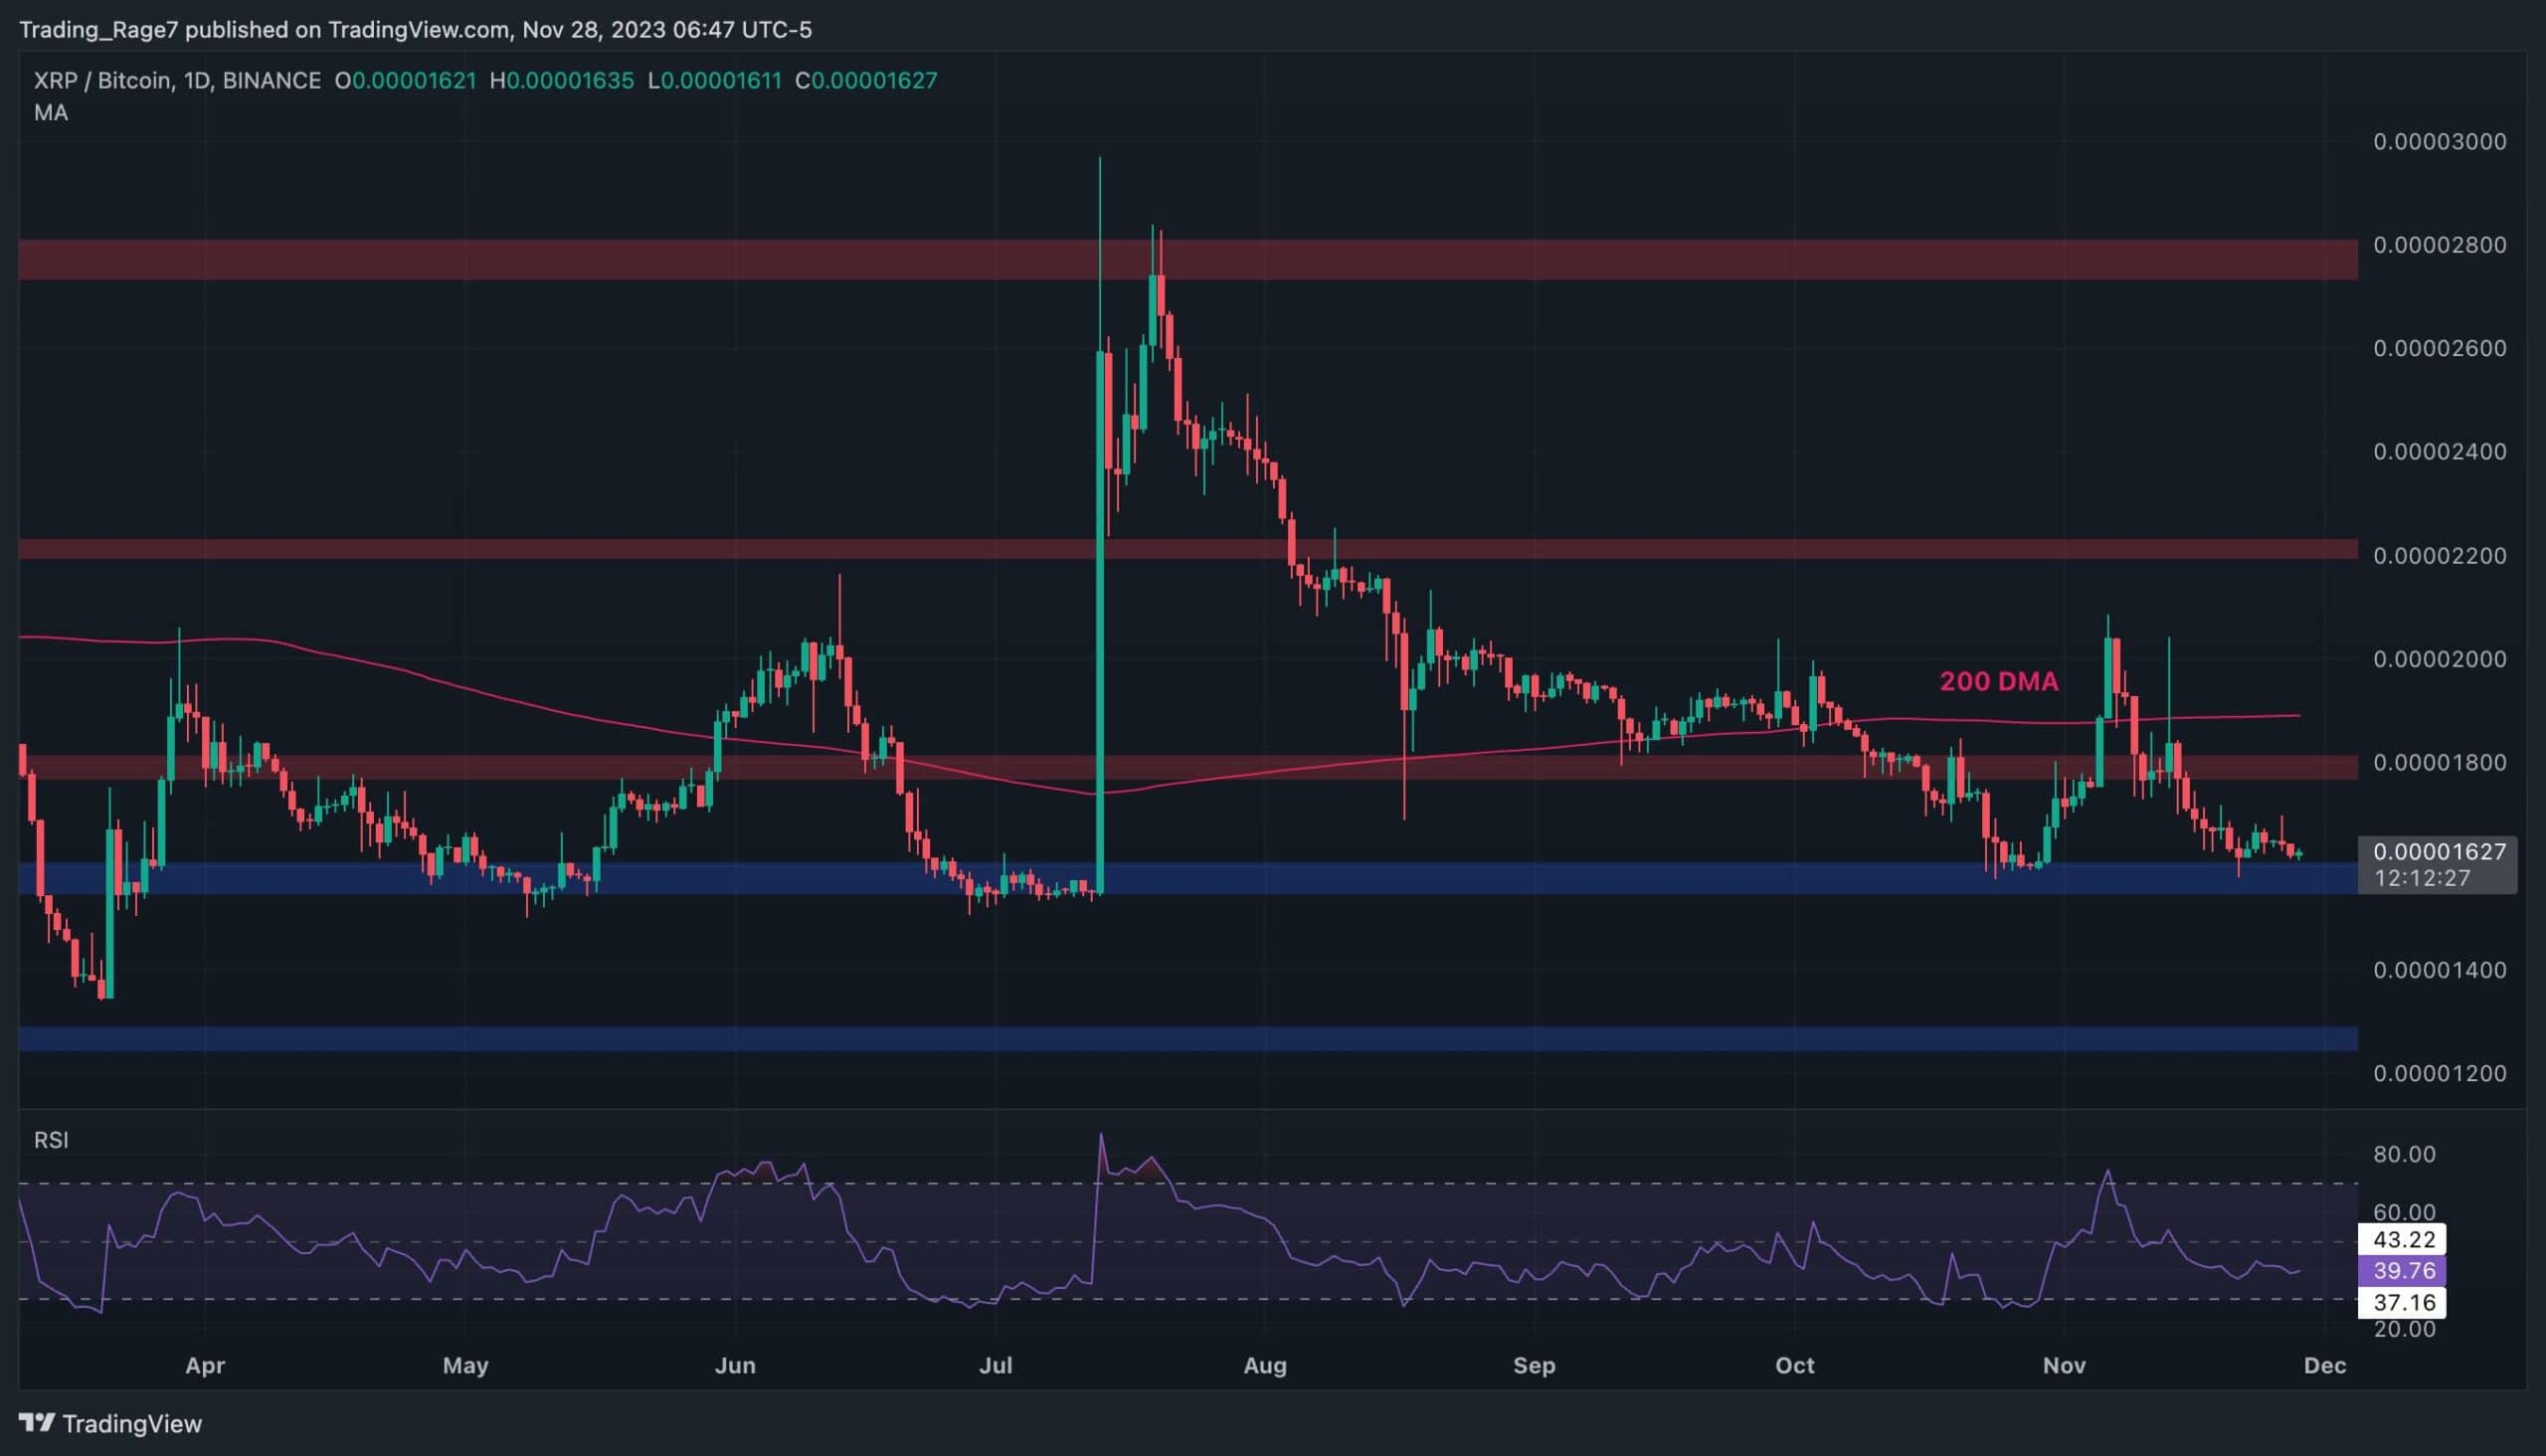
The BTC Paired Chart
Against BTC, the price is currently testing the 1,600 SAT support zone after failing to stay above the 200-day moving average, which is hovering around the 1,900 SAT mark.
If a bullish rebound occurs, the market is likely to rise toward the 1,800 SAT resistance level and potentially the 200-day moving average.
A breakout above these resistance elements will pave the way for an increase toward the key 2,200 SAT area. Yet, the relative strength index suggests that the momentum is still bearish, as it is showing values below 50%. Therefore, a breakdown of the 1,600 SAT level and a consequent drop towards the 1,250 SAT support is still probable in the short run.