XRP’s price has not yet shown any significant strength as it continues its struggle to surpass a critical resistance level over recent weeks. Things are not looking much better against BTC, with a major support level getting broken to the downside. Technical Analysis By: Edris XRP/USDT Daily Chart On the daily chart, the price has been consolidating in a tight range below the %excerpt%.43 resistance level for quite a while. The 200-day moving average, located around %excerpt%.4, has been providing support, preventing the price from dropping further. If the %excerpt%.43 level finally gets broken to the upside, a rally toward the %excerpt%.55 area could be expected in the short term. On the other hand, if a bearish rejection occurs, the 50-day moving average trending around the %excerpt%.37 mark would be the
Topics:
CryptoVizArt considers the following as important: Ripple (XRP) Price, XRP Analysis, xrpbtc, xrpusd
This could be interesting, too:
Jordan Lyanchev writes Ripple’s (XRP) Surge to Triggers Over Million in Short Liquidations
Jordan Lyanchev writes Trump Confirms Work on Strategic Crypto Reserve: XRP, ADA, SOL Included
Dimitar Dzhondzhorov writes Is a Major Ripple v. SEC Lawsuit Development Expected This Week? Here’s Why
Mandy Williams writes Ripple Releases Institutional DeFi Roadmap for XRP Ledger in 2025
XRP’s price has not yet shown any significant strength as it continues its struggle to surpass a critical resistance level over recent weeks. Things are not looking much better against BTC, with a major support level getting broken to the downside.
Technical Analysis
By: Edris
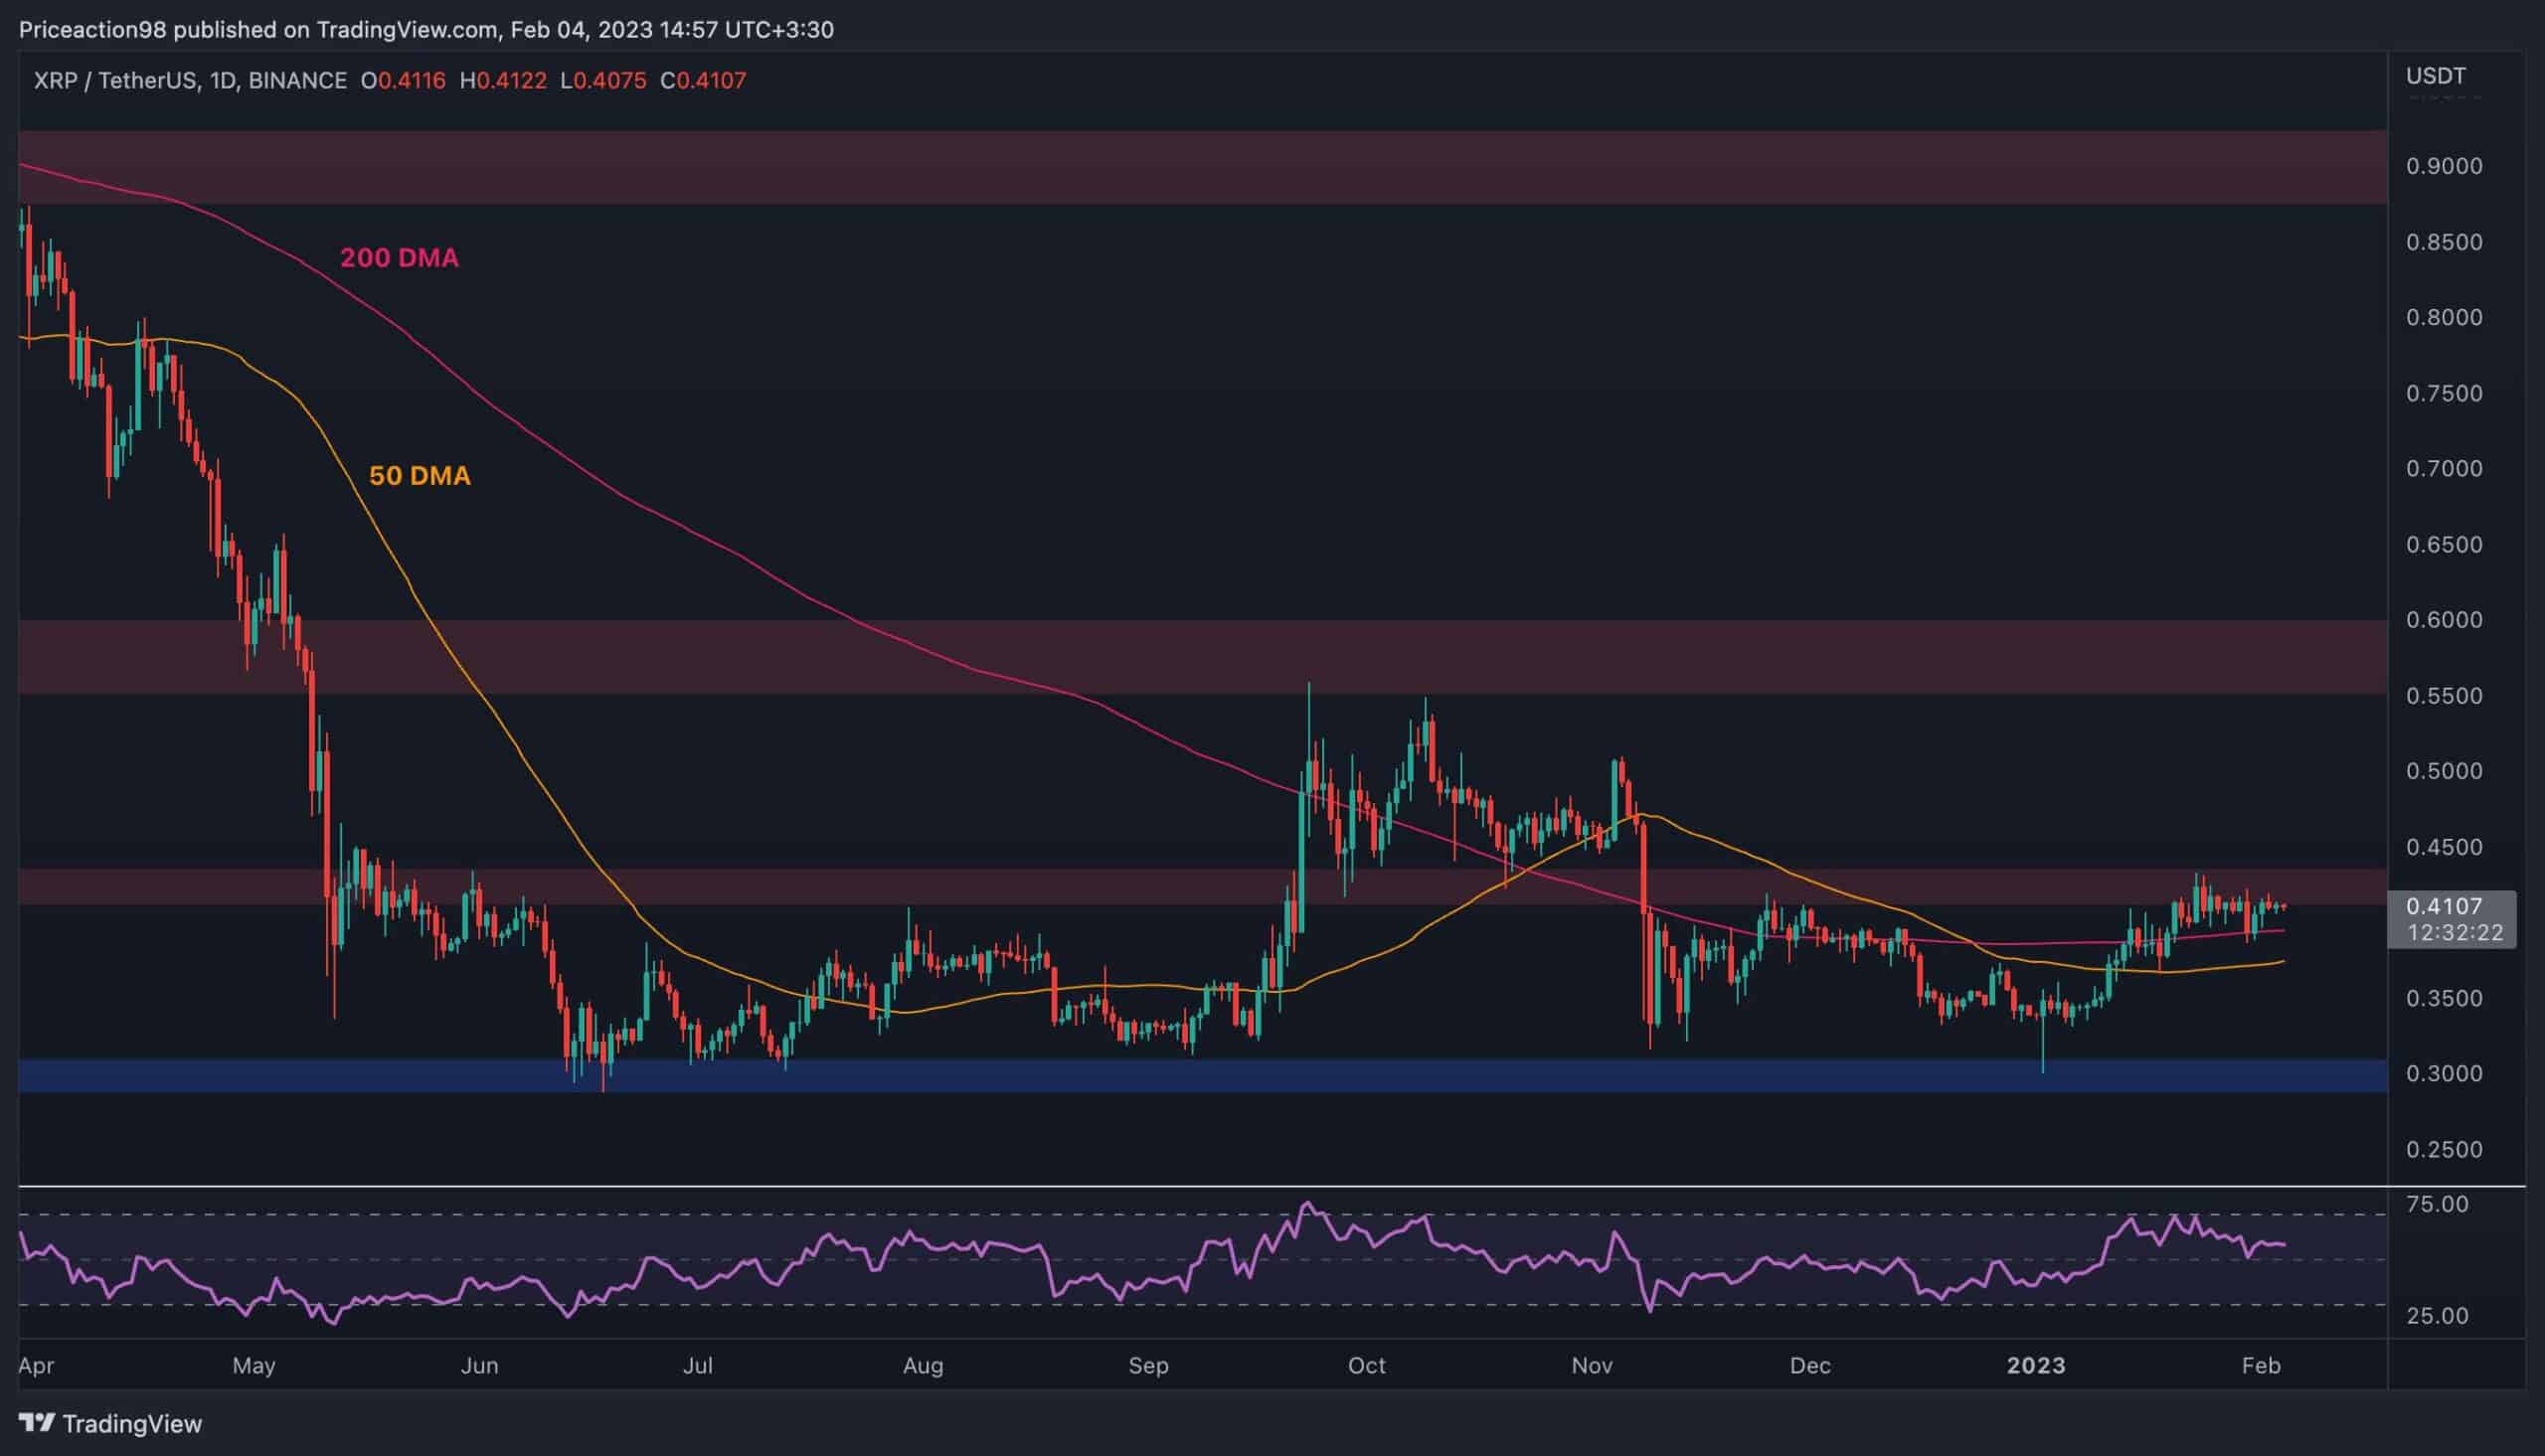
XRP/USDT Daily Chart
On the daily chart, the price has been consolidating in a tight range below the $0.43 resistance level for quite a while. The 200-day moving average, located around $0.4, has been providing support, preventing the price from dropping further.
If the $0.43 level finally gets broken to the upside, a rally toward the $0.55 area could be expected in the short term.
On the other hand, if a bearish rejection occurs, the 50-day moving average trending around the $0.37 mark would be the first potential support level before the key $0.3 area, which had previously stopped the gruesome downtrend on multiple occasions.
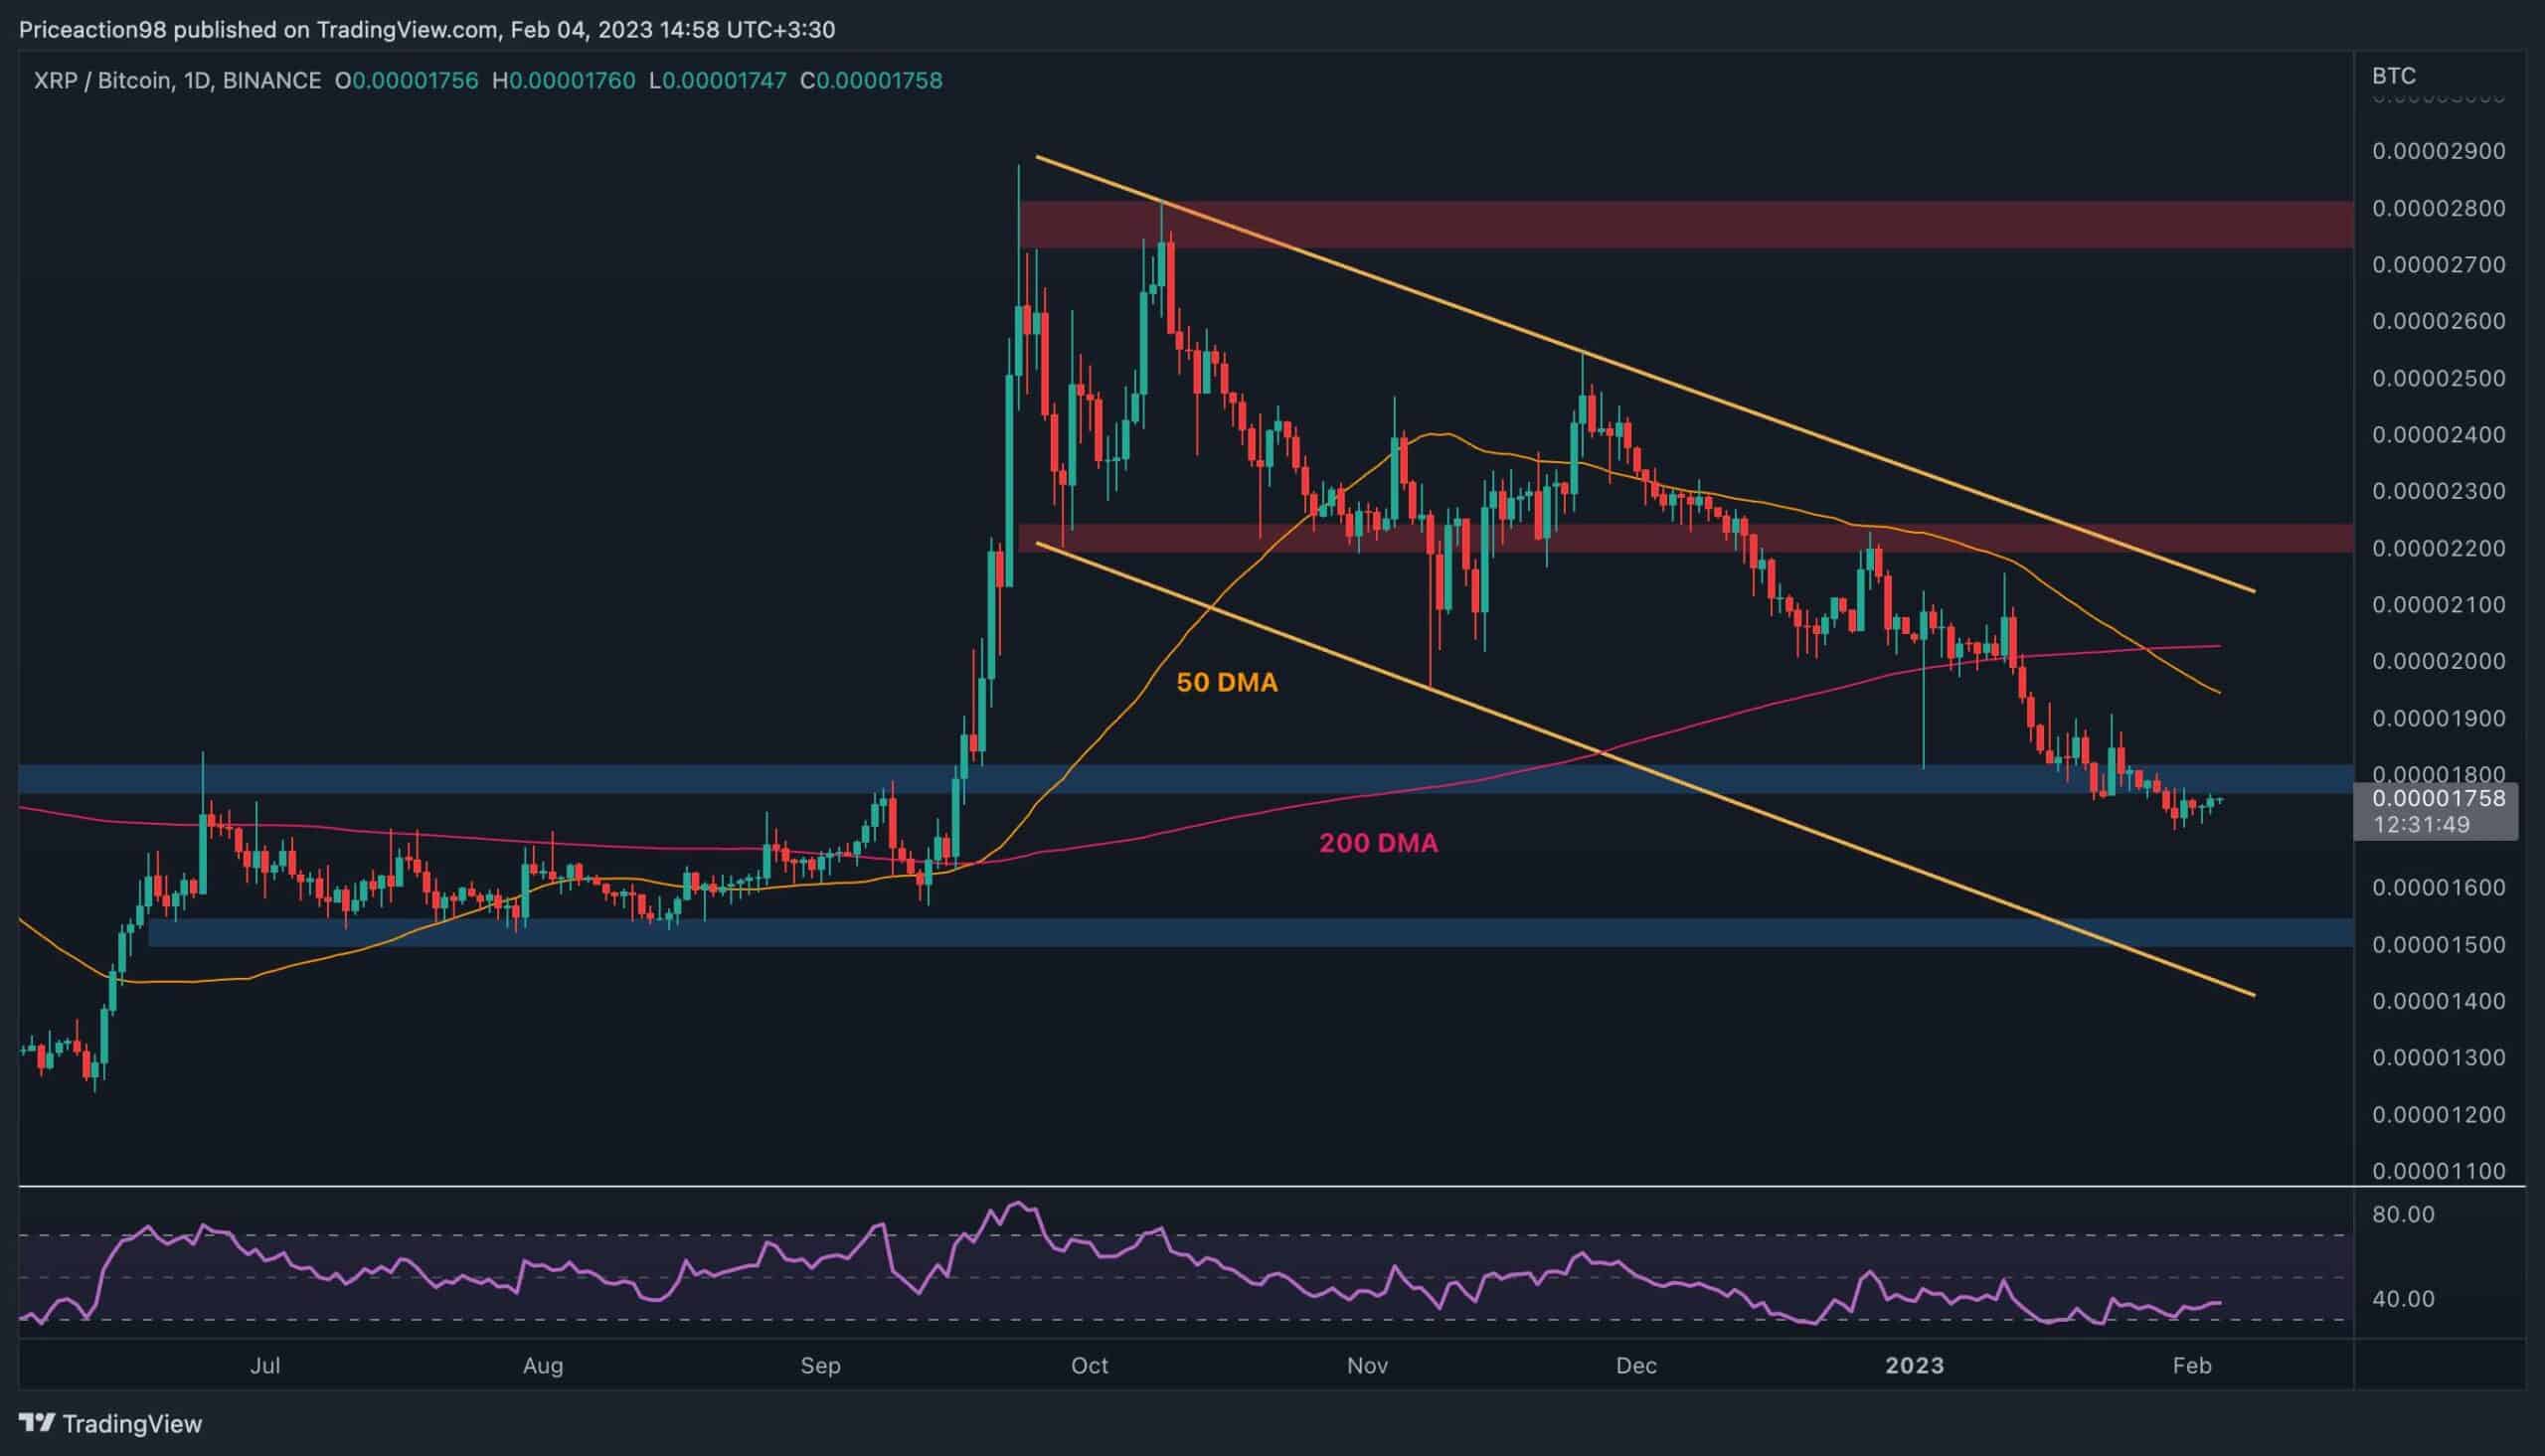
XRP/BTC Daily Chart
Against BTC, the cryptocurrency has been on the decline for the last few weeks, and the 0.000018 level has seemingly been broken to the downside. A confirmation of this breakout would potentially lead to a further drop toward the 0.000015 support level in the coming weeks.
However, considering the fact that the RSI is approaching the oversold area, the recent breakdown of the 0.000018 level could prove to be a fake one. If the price rises back above it, a surge toward the 50-day and 200-day moving average lines located around 0.000019 and 0.000020 levels would be expected.