Ripple’s price has remained relatively stagnant, displaying minimal fluctuations within a narrow range for the past couple of weeks. However, the BTC-paired chart offers a more intriguing perspective. Technical Analysis By: Edris XRP/USDT Daily Chart: The price of Ripple has been consolidating above the 50-day moving average against USDT, which is located around %excerpt%.48, after facing rejection at the %excerpt%.6 resistance level once again. A potential breakdown of the 50-day moving average may lead to a decline toward the %excerpt%.43 support level, accompanied by the 200-day moving average. If these support levels are breached, there is a likelihood of a significant drop towards the %excerpt%.3 range. However, it is premature to adopt such a pessimistic outlook, as there remains a possibility
Topics:
CryptoVizArt considers the following as important: Ripple (XRP) Price, XRP Analysis, xrpbtc, xrpusd
This could be interesting, too:
Jordan Lyanchev writes Ripple’s (XRP) Surge to Triggers Over Million in Short Liquidations
Jordan Lyanchev writes Trump Confirms Work on Strategic Crypto Reserve: XRP, ADA, SOL Included
Dimitar Dzhondzhorov writes Is a Major Ripple v. SEC Lawsuit Development Expected This Week? Here’s Why
Mandy Williams writes Ripple Releases Institutional DeFi Roadmap for XRP Ledger in 2025
Ripple’s price has remained relatively stagnant, displaying minimal fluctuations within a narrow range for the past couple of weeks. However, the BTC-paired chart offers a more intriguing perspective.
Technical Analysis
By: Edris
XRP/USDT Daily Chart:
The price of Ripple has been consolidating above the 50-day moving average against USDT, which is located around $0.48, after facing rejection at the $0.6 resistance level once again.
A potential breakdown of the 50-day moving average may lead to a decline toward the $0.43 support level, accompanied by the 200-day moving average.
If these support levels are breached, there is a likelihood of a significant drop towards the $0.3 range. However, it is premature to adopt such a pessimistic outlook, as there remains a possibility for a price rebound and another attempt at testing the $0.6 level.
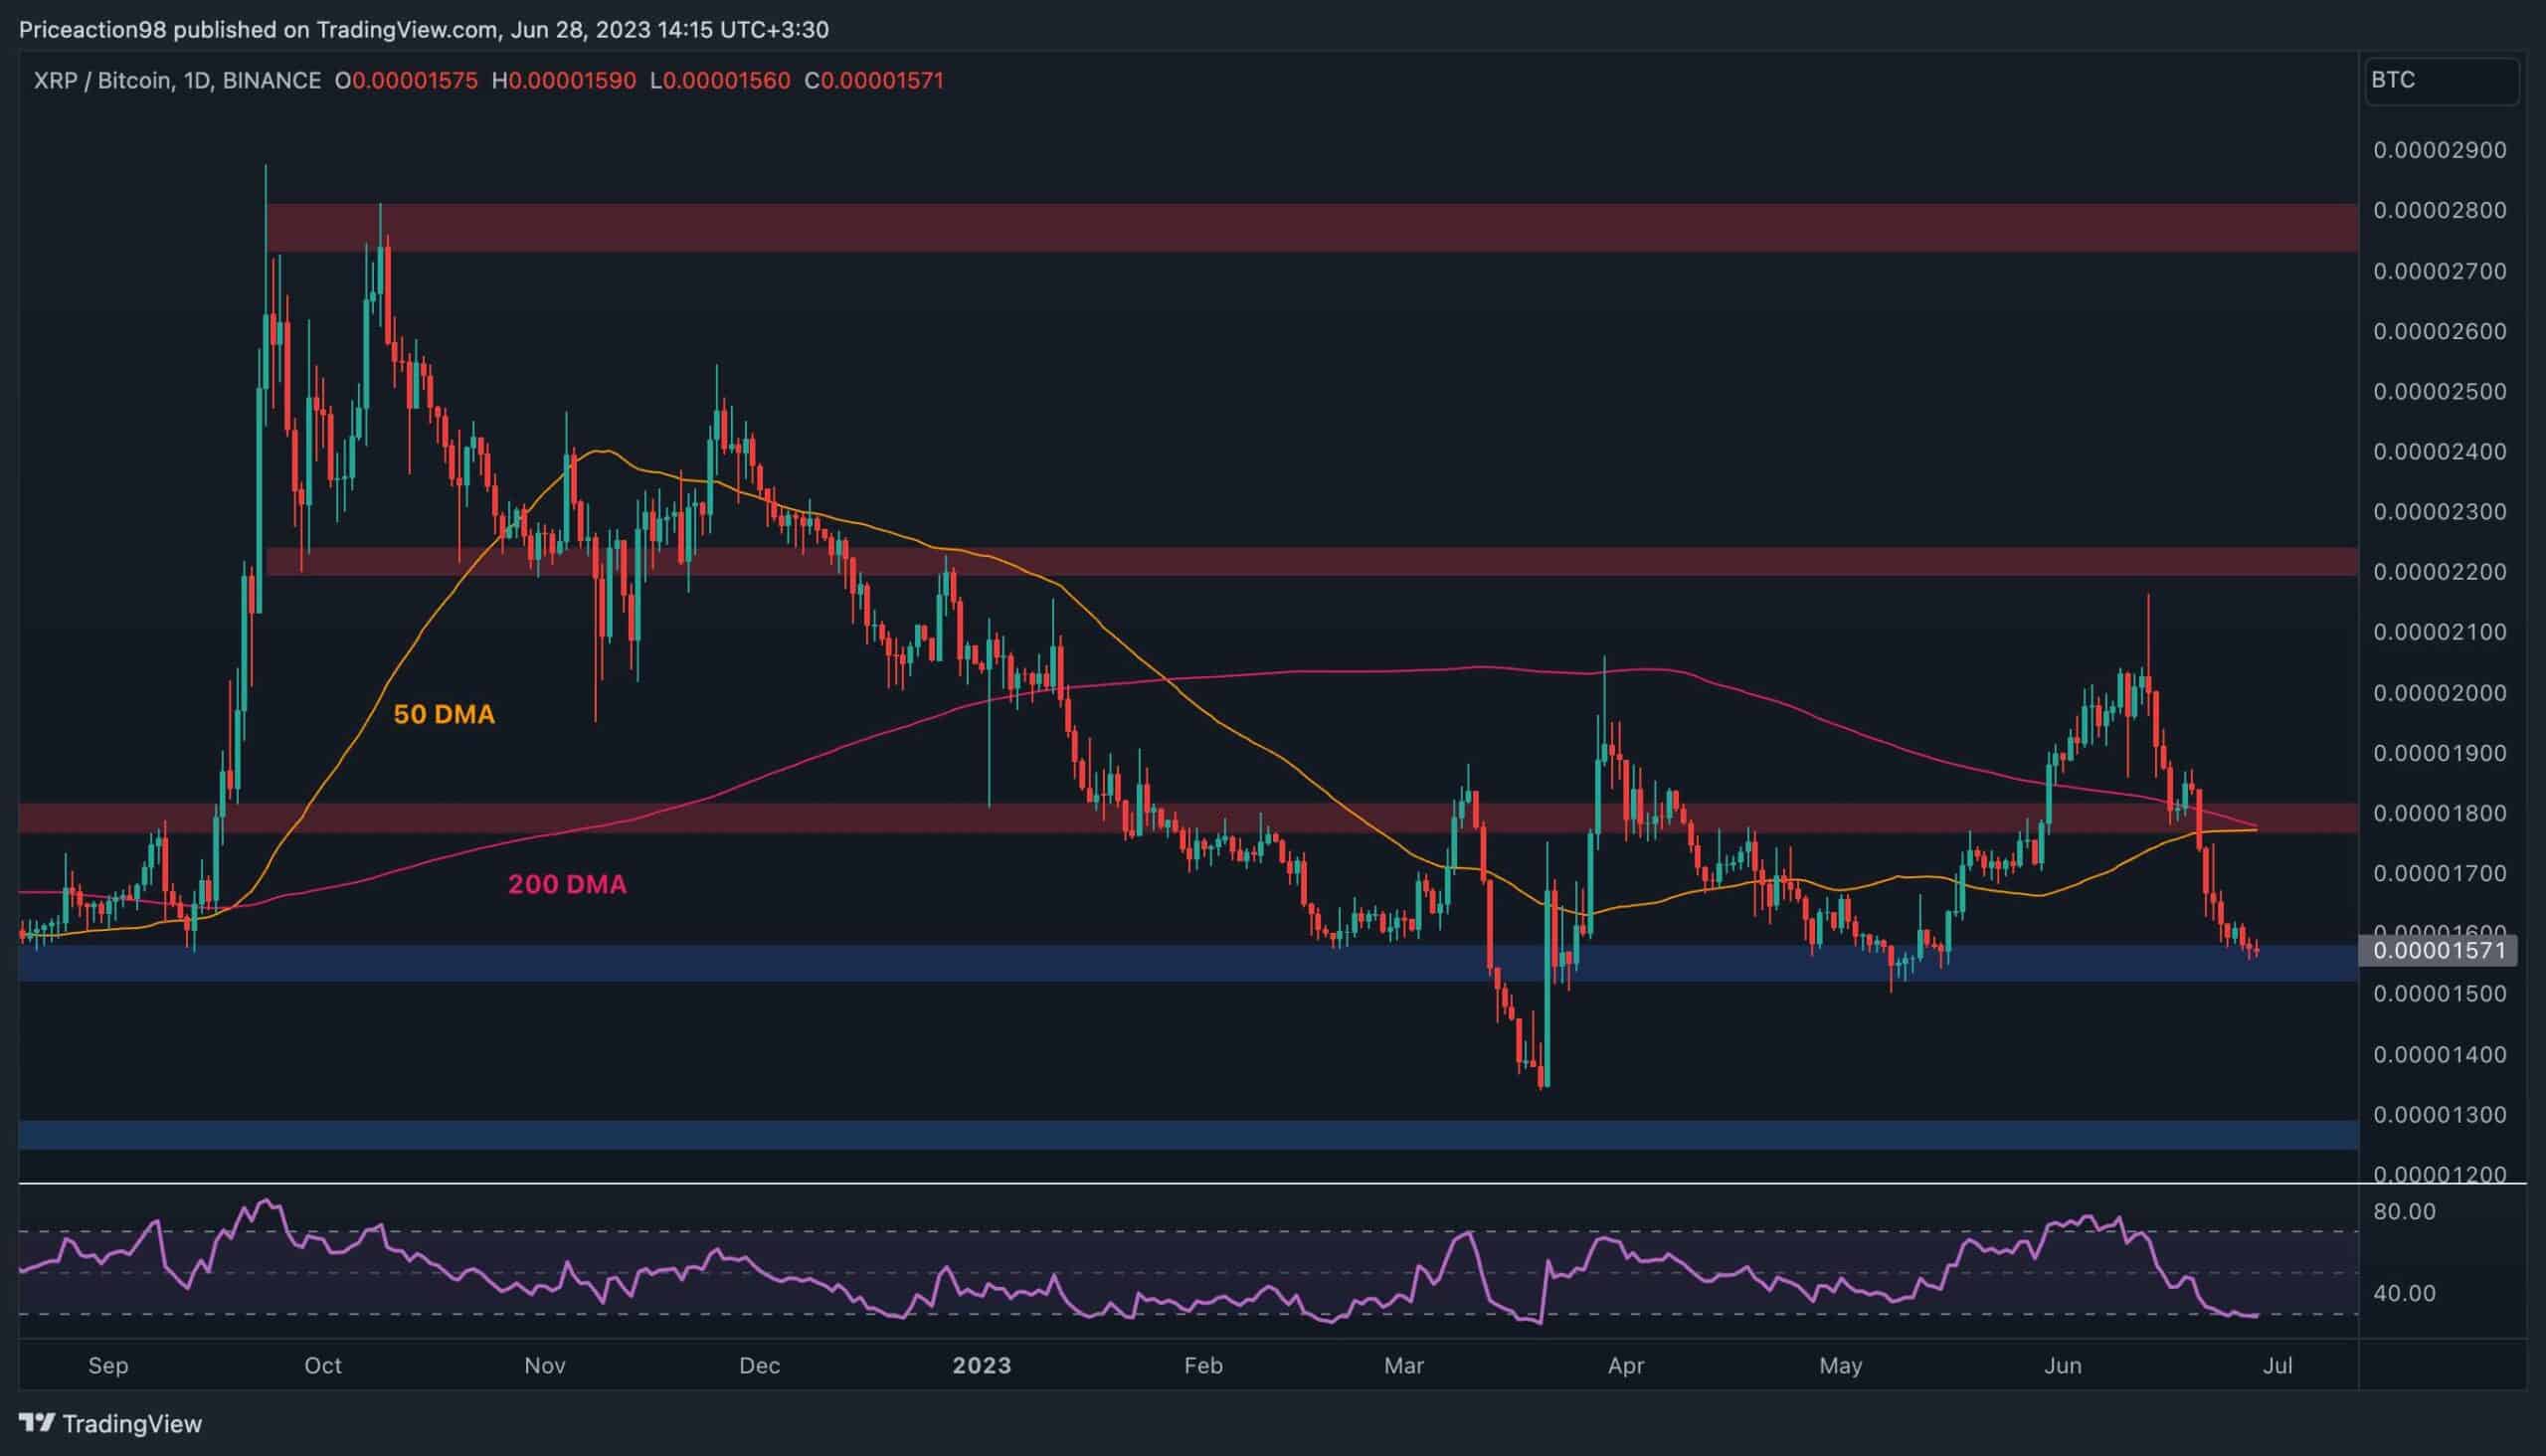
XRP/BTC Daily Chart
The price of Ripple against BTC has been experiencing a continuous decline in recent weeks.
Both the 200-day and 50-day moving averages have been breached downward, with the price currently testing the support level at 1500 SAT.
If there is a rebound from the support zone, the initial targets for XRP would be the converging 200-day and 50-day moving averages around the 1800 SAT resistance level.
Additionally, the RSI indicator suggests an oversold condition, implying the potential for a short-term pullback or rebound.