Ripple’s price has remained stagnant and lacks bullish momentum, as it has been in a consolidation phase for several months. The situation is similar when trading against Bitcoin. Technical Analysis By: Edris XRP/USDT Daily Chart: Ripple’s price faced strong rejection at the %excerpt%.6 resistance zone a few weeks ago. Currently, the cryptocurrency is finding support at the %excerpt%.49 level, where the 50-day moving average is located. If this level is breached, the next targets would be the %excerpt%.43 resistance and the 200-day moving average around the same price. Rebounding from this area would be likely. However, if these support levels are unable to hold, Ripple’s price could experience a significant decline, potentially dropping towards %excerpt%.3 and even lower within a short timeframe.
Topics:
CryptoVizArt considers the following as important: Ripple (XRP) Price, XRP Analysis, xrpbtc, xrpusd
This could be interesting, too:
Jordan Lyanchev writes Ripple’s (XRP) Surge to Triggers Over Million in Short Liquidations
Jordan Lyanchev writes Trump Confirms Work on Strategic Crypto Reserve: XRP, ADA, SOL Included
Dimitar Dzhondzhorov writes Is a Major Ripple v. SEC Lawsuit Development Expected This Week? Here’s Why
Mandy Williams writes Ripple Releases Institutional DeFi Roadmap for XRP Ledger in 2025
Ripple’s price has remained stagnant and lacks bullish momentum, as it has been in a consolidation phase for several months. The situation is similar when trading against Bitcoin.
Technical Analysis
By: Edris
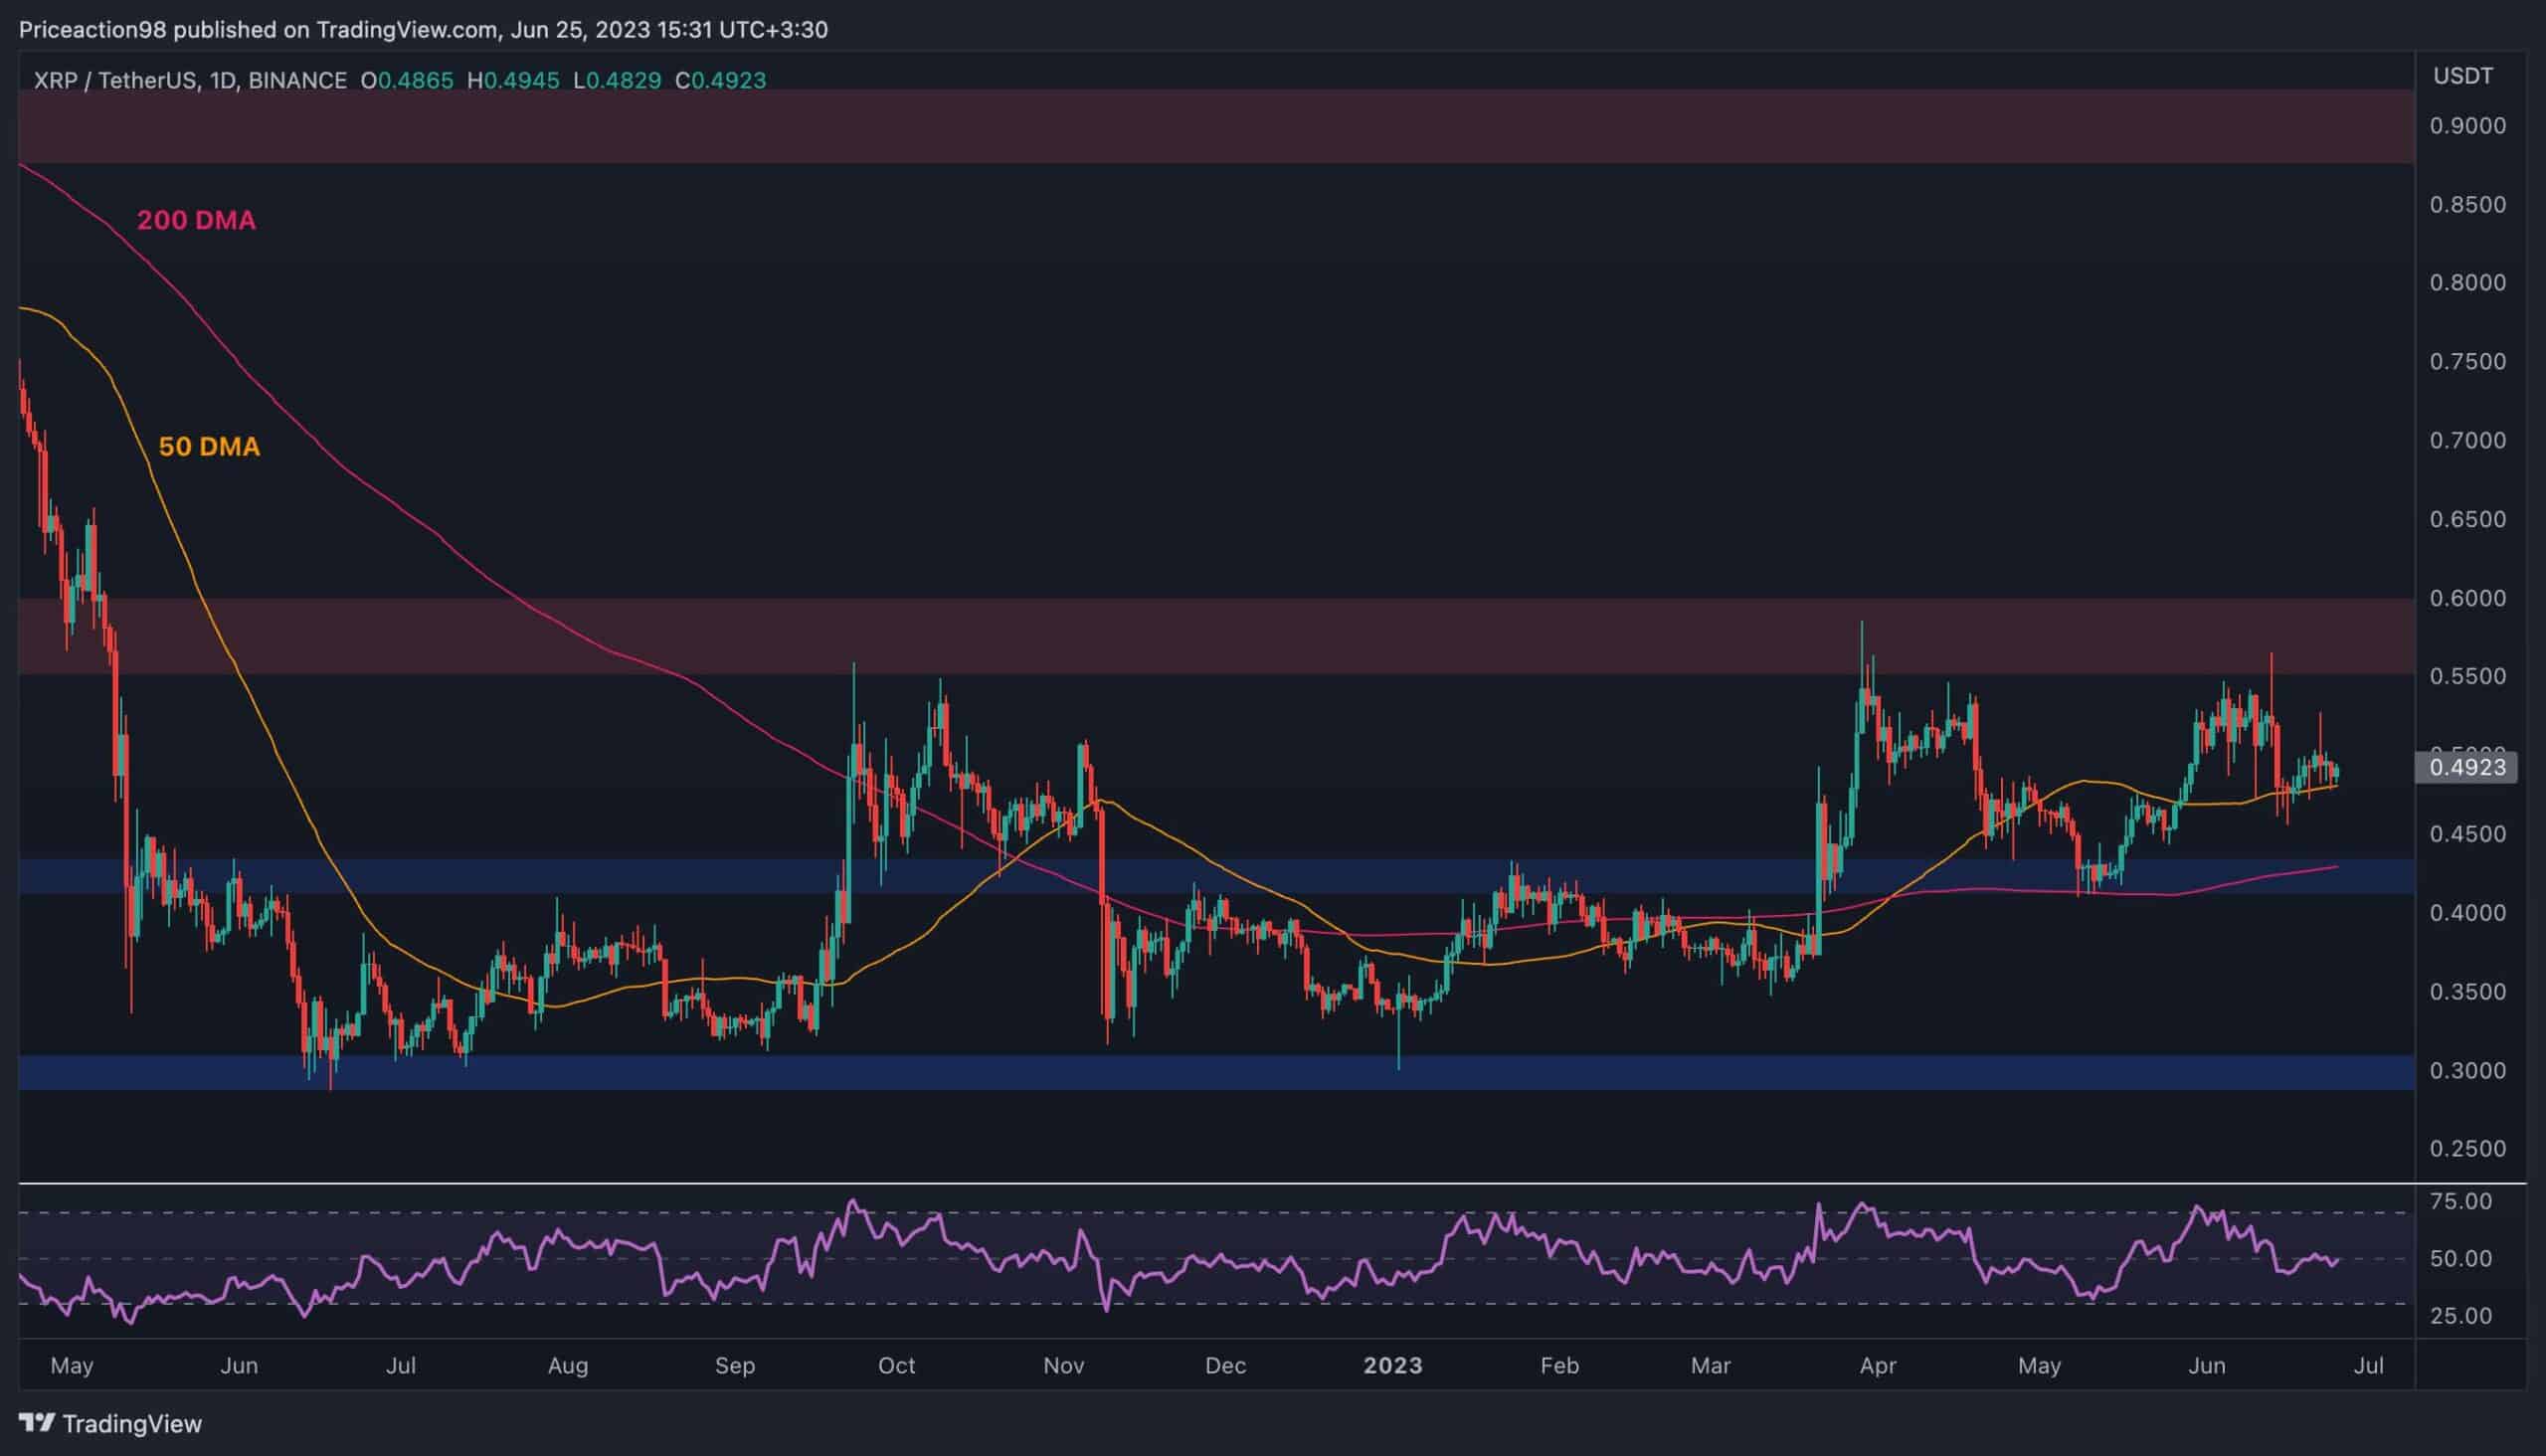
XRP/USDT Daily Chart:
Ripple’s price faced strong rejection at the $0.6 resistance zone a few weeks ago. Currently, the cryptocurrency is finding support at the $0.49 level, where the 50-day moving average is located.
If this level is breached, the next targets would be the $0.43 resistance and the 200-day moving average around the same price. Rebounding from this area would be likely.
However, if these support levels are unable to hold, Ripple’s price could experience a significant decline, potentially dropping towards $0.3 and even lower within a short timeframe.
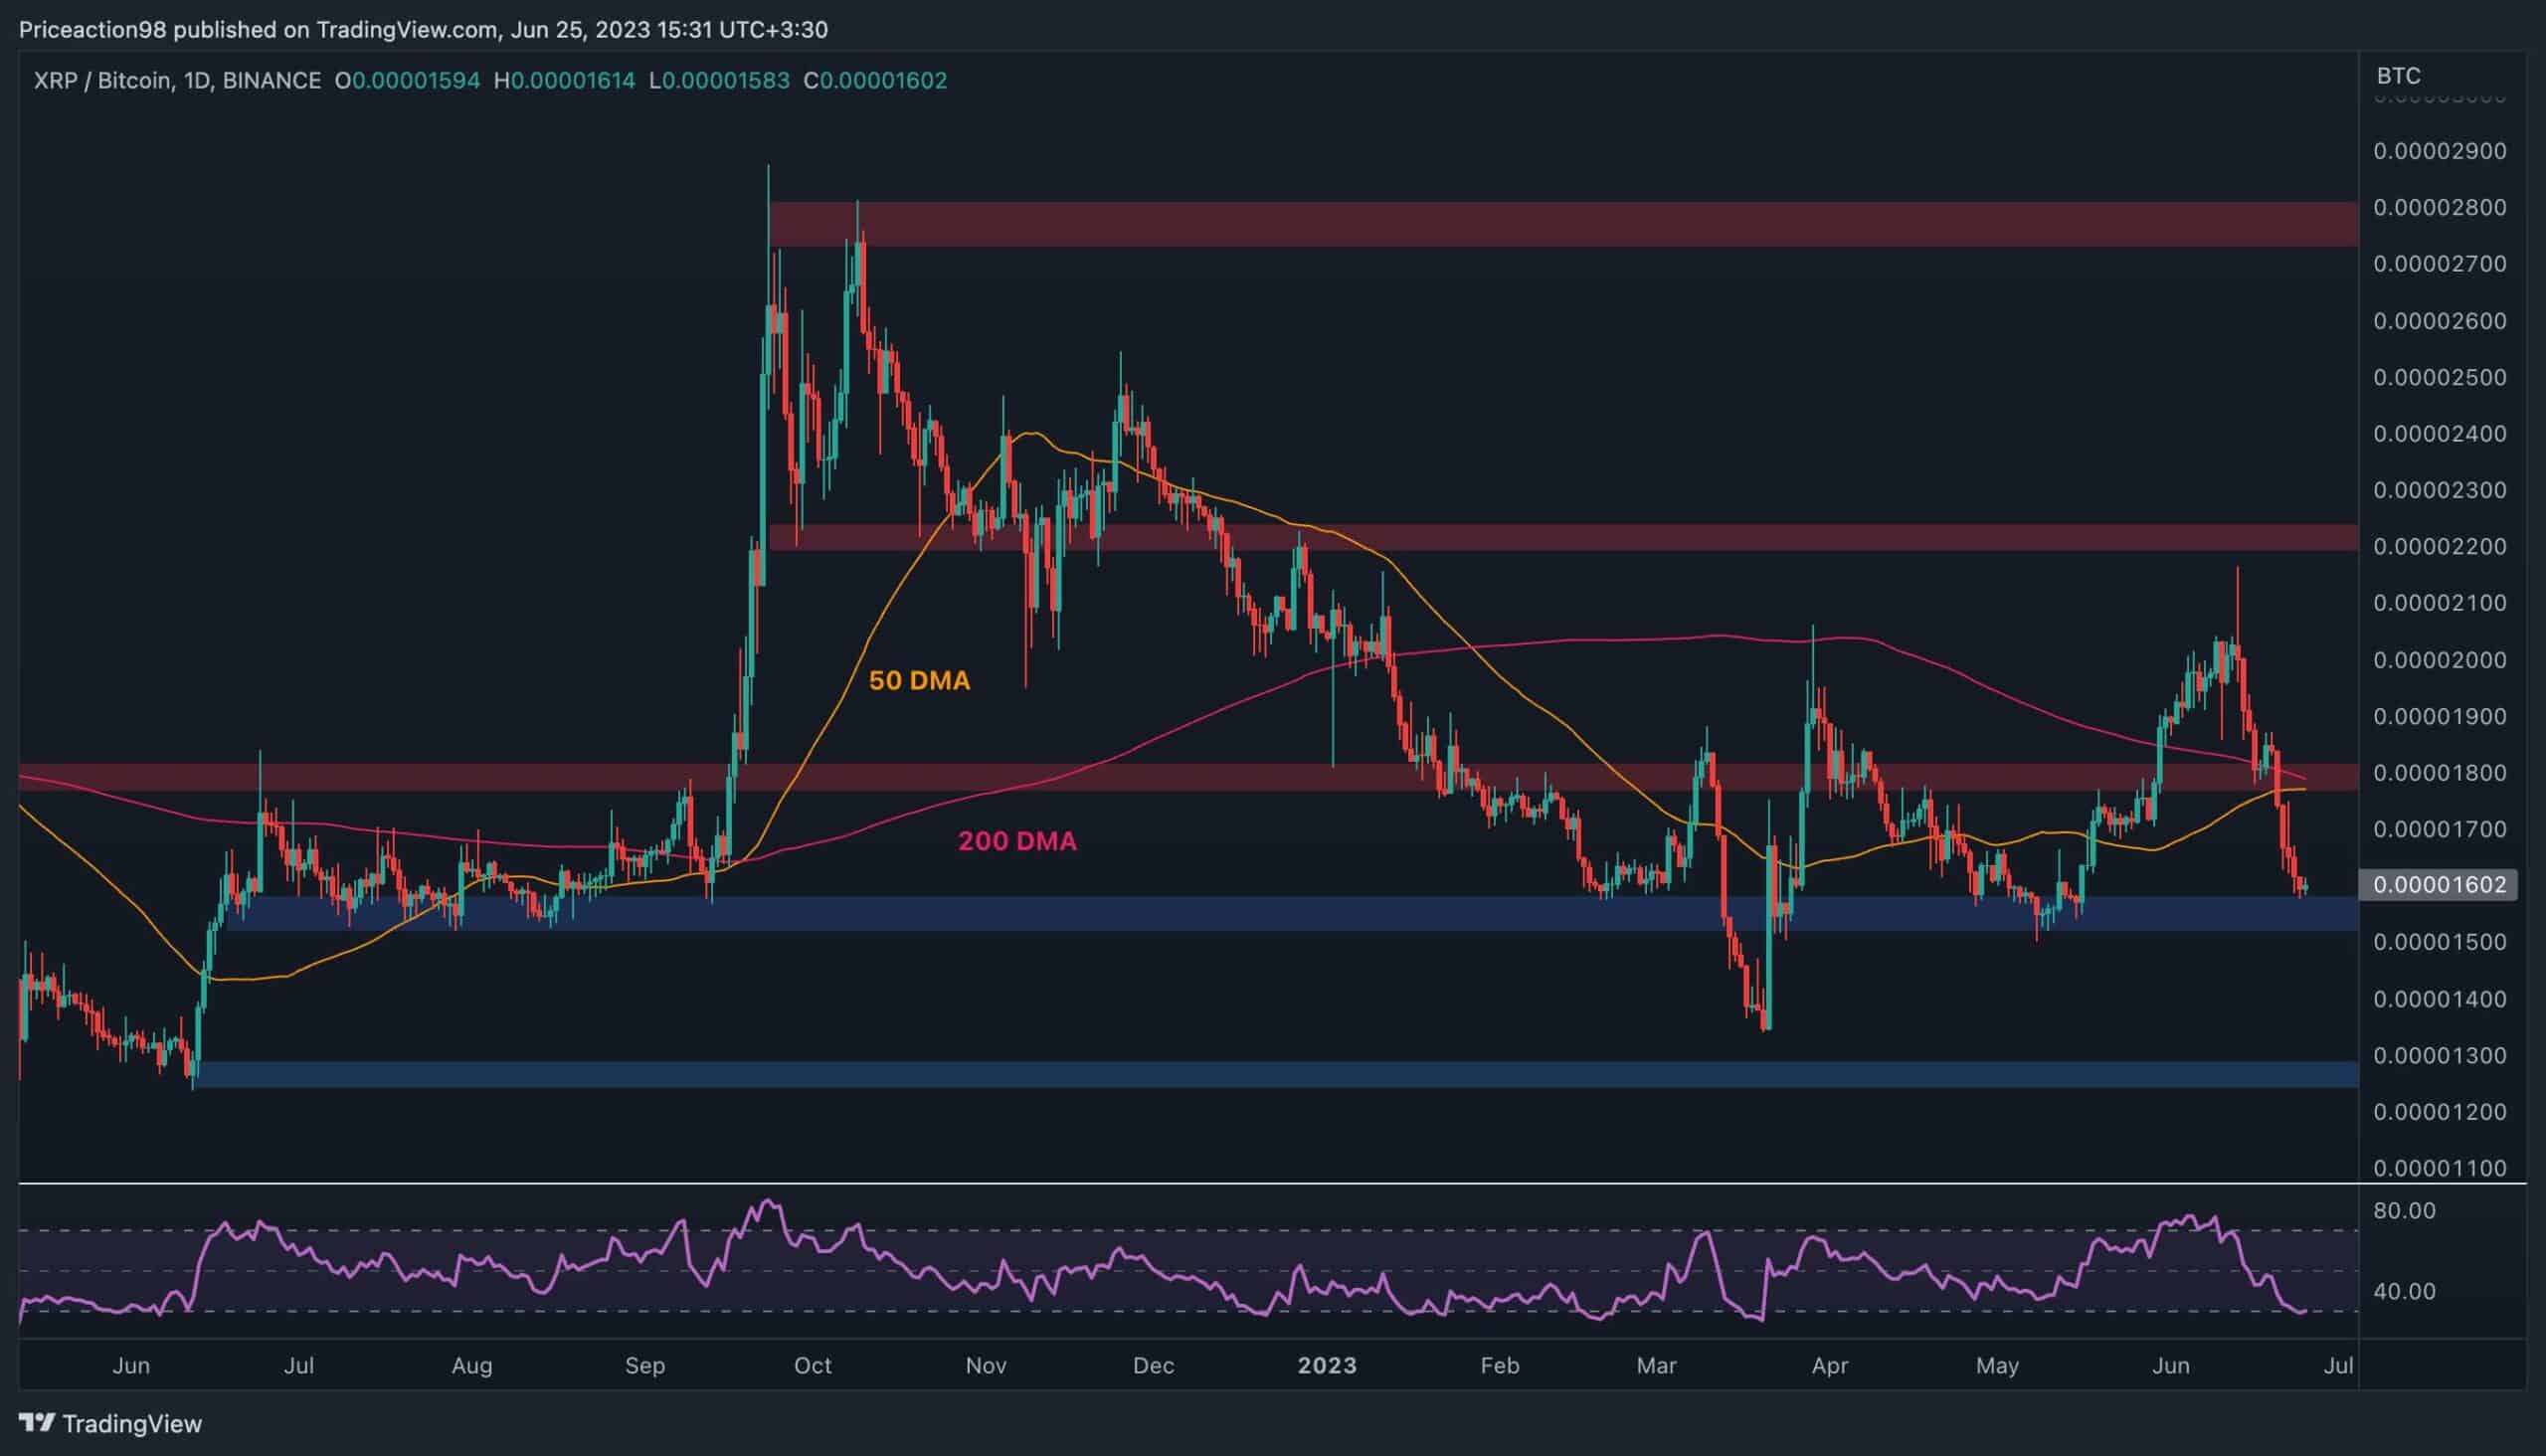
XRP/BTC Daily Chart
Against BTC, it becomes apparent that Ripple’s price has experienced a sharp decline after failing to maintain its position above the 2000SAT level. Currently, the market is approaching a crucial support area at 1600 SAT, accompanied by an oversold signal from the RSI indicator.
As a result, a potential short-term rebound is seemingly likely. However, for investors to regain confidence in the price trajectory, XRP must surpass the 1800 SAT resistance level, as well as the convergence of the 50-day and 200-day moving averages around that point.