Ripple’s price action has been choppy lately, especially against USD. Against BTC, though, things are looking interesting in the short term. Technical Analysis By: Edris XRP/USDT Daily Chart: Against USD, the price has been consolidating in a narrow range between %excerpt%.45 and %excerpt%.5. The 50-day moving average, currently around %excerpt%.5, is currently pushing the cryptocurrency lower. If XRP drops toward the %excerpt%.43 level, the 200-day moving average near that price is expected to provide strong support. On the other hand, if XRP breaks above the 50-day moving average, investors could be optimistic as the %excerpt%.6 resistance is likely to be tested. This scenario could be ideal for Ripple as the market might enter a mid-term bullish phase after months of consolidation. Source:
Topics:
CryptoVizArt considers the following as important: Ripple (XRP) Price, XRP Analysis, xrpbtc, xrpusd
This could be interesting, too:
Jordan Lyanchev writes Ripple’s (XRP) Surge to Triggers Over Million in Short Liquidations
Jordan Lyanchev writes Trump Confirms Work on Strategic Crypto Reserve: XRP, ADA, SOL Included
Dimitar Dzhondzhorov writes Is a Major Ripple v. SEC Lawsuit Development Expected This Week? Here’s Why
Mandy Williams writes Ripple Releases Institutional DeFi Roadmap for XRP Ledger in 2025
Ripple’s price action has been choppy lately, especially against USD. Against BTC, though, things are looking interesting in the short term.
Technical Analysis
By: Edris
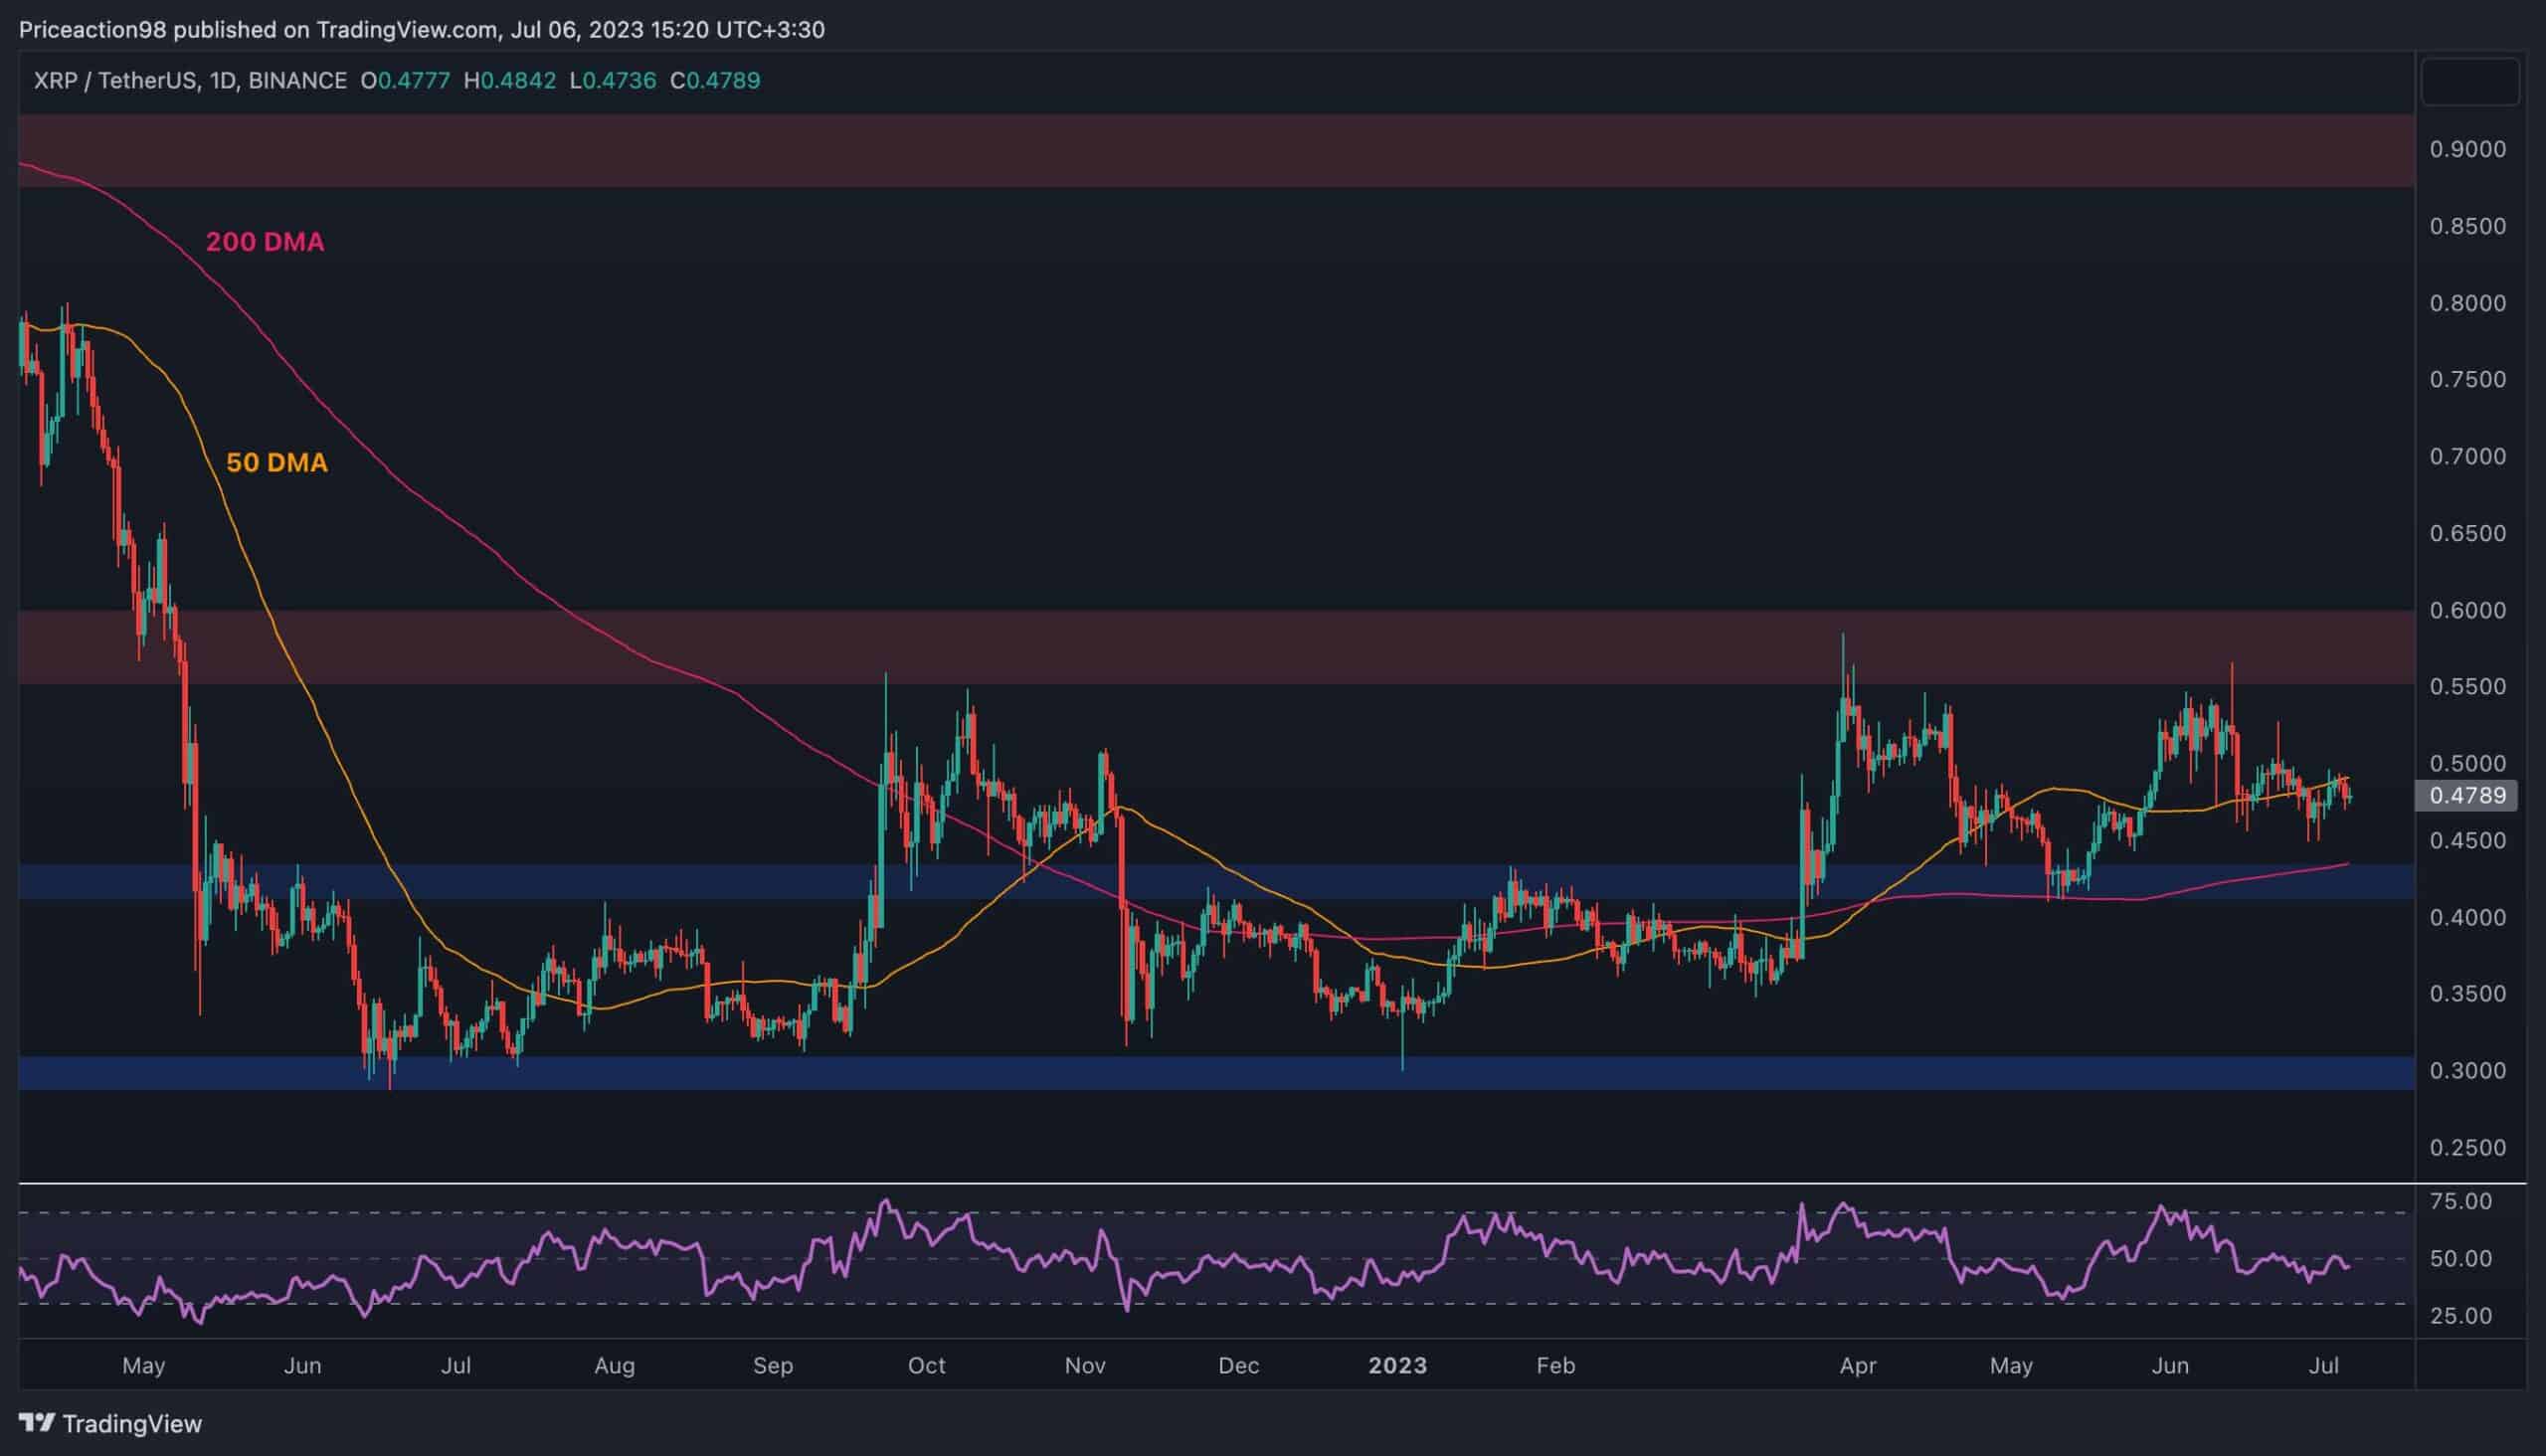
XRP/USDT Daily Chart:
Against USD, the price has been consolidating in a narrow range between $0.45 and $0.5. The 50-day moving average, currently around $0.5, is currently pushing the cryptocurrency lower. If XRP drops toward the $0.43 level, the 200-day moving average near that price is expected to provide strong support.
On the other hand, if XRP breaks above the 50-day moving average, investors could be optimistic as the $0.6 resistance is likely to be tested.
This scenario could be ideal for Ripple as the market might enter a mid-term bullish phase after months of consolidation.
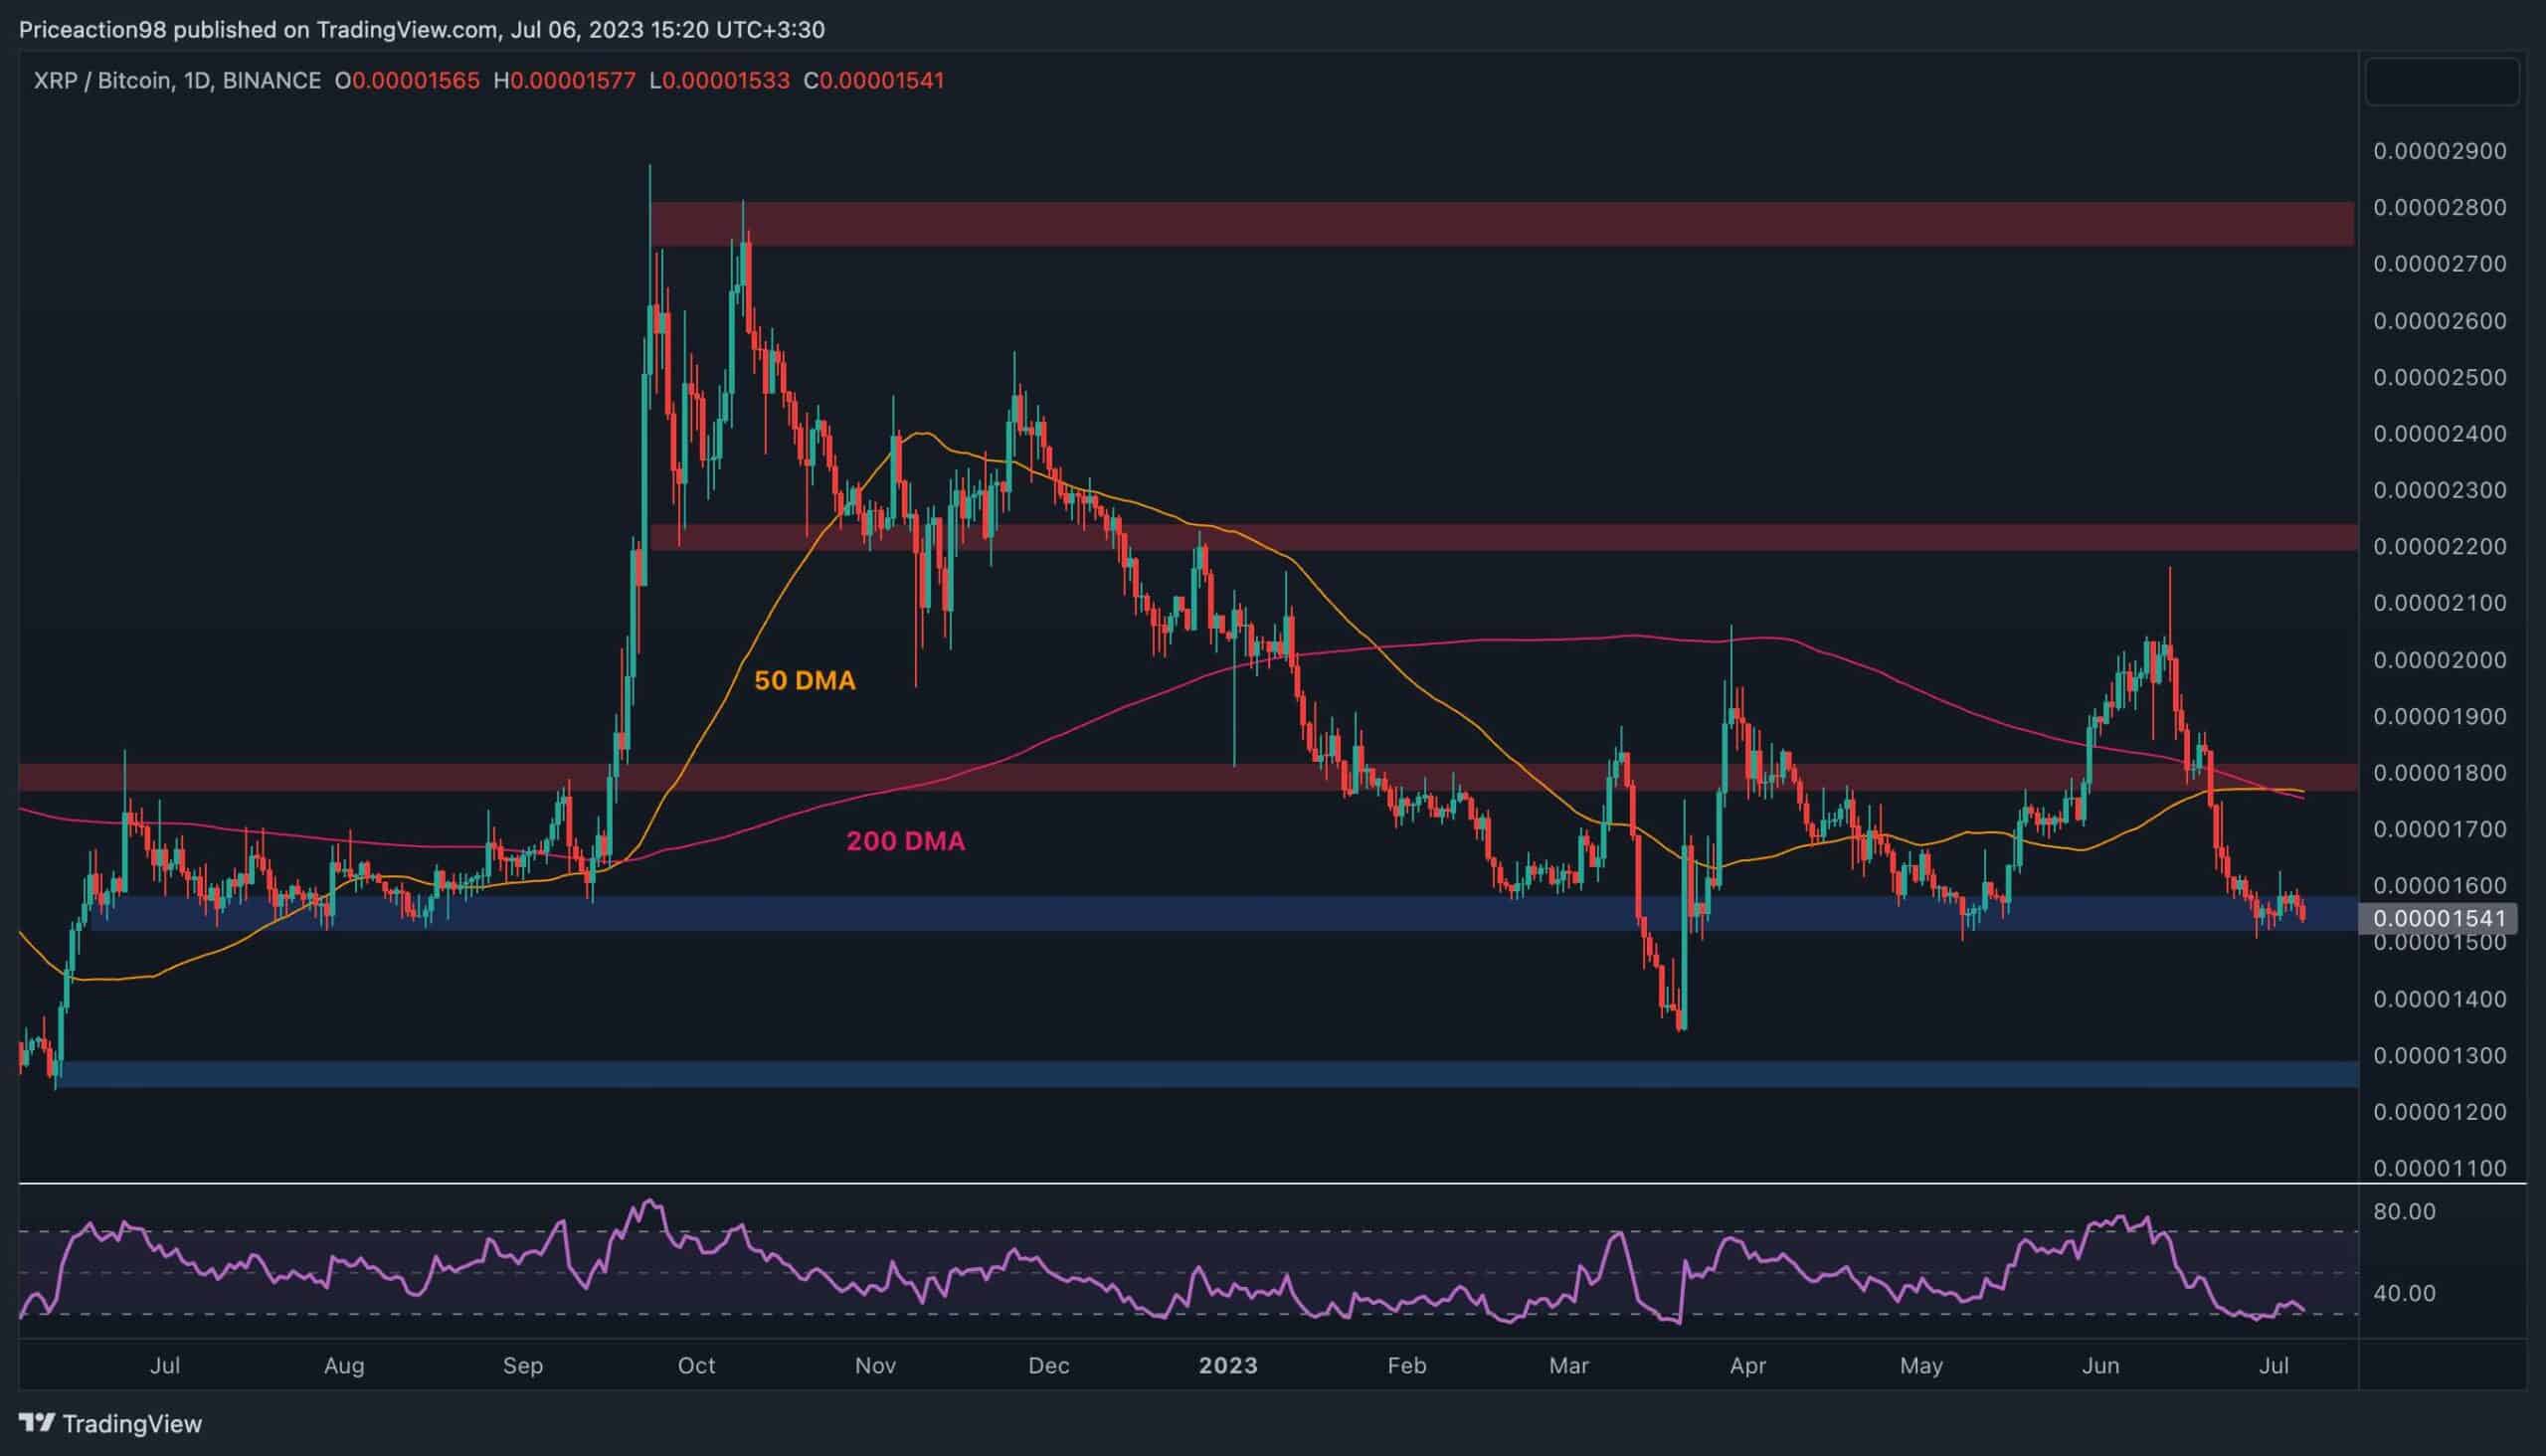
XRP/BTC Daily Chart
The market has been trending downward lately. The price has been on a free-fall since the breakdown of the 1,800 SAT level and the 200-day and 50-day moving averages earlier in June.
However, the key 1,500 SAT support zone is currently holding the XRP price from further drops. Additionally, the 50-day and 200-day moving averages printed a bullish crossover a few days back, increasing the probability of a rebound in the short term.
The RSI is also showing values close to the oversold area, boosting the chances of a bullish reversal in the coming weeks.
However, despite these positive signals from indicators, the price action remains bearish, and there is still a high probability of a bearish breakout below the 1,500 SAT level, which could lead to a subsequent crash toward the 1,300 SAT zone in a short period of time.