XRP’s price has been consolidating over the last few weeks on the USDT pair. It is yet to show any significant desire to either drop or rally. However, against BTC, things are looking different. Technical Analysis By TradingRage Ripple Price Analysis: The USDT Chart Against USDT, the price has been supported by the %excerpt%.6 level. Yet, it has not rebounded with any considerable bullish momentum. In case this level holds, the price can rise toward the %excerpt%.72 resistance level in the short term. On the other hand, a breakdown of the %excerpt%.6 level would result in a drop to the 200-day moving average, which is not far away, trending near the %excerpt%.54 mark. Needless to say, a decline below the 200-day moving average would be very bearish, as the next significant support level lies at the
Topics:
CryptoVizArt considers the following as important: Ripple (XRP) Price, XRP Analysis, xrpbtc, xrpusd
This could be interesting, too:
Jordan Lyanchev writes Ripple’s (XRP) Surge to Triggers Over Million in Short Liquidations
Jordan Lyanchev writes Trump Confirms Work on Strategic Crypto Reserve: XRP, ADA, SOL Included
Dimitar Dzhondzhorov writes Is a Major Ripple v. SEC Lawsuit Development Expected This Week? Here’s Why
Mandy Williams writes Ripple Releases Institutional DeFi Roadmap for XRP Ledger in 2025
XRP’s price has been consolidating over the last few weeks on the USDT pair.
It is yet to show any significant desire to either drop or rally. However, against BTC, things are looking different.
Technical Analysis
By TradingRage
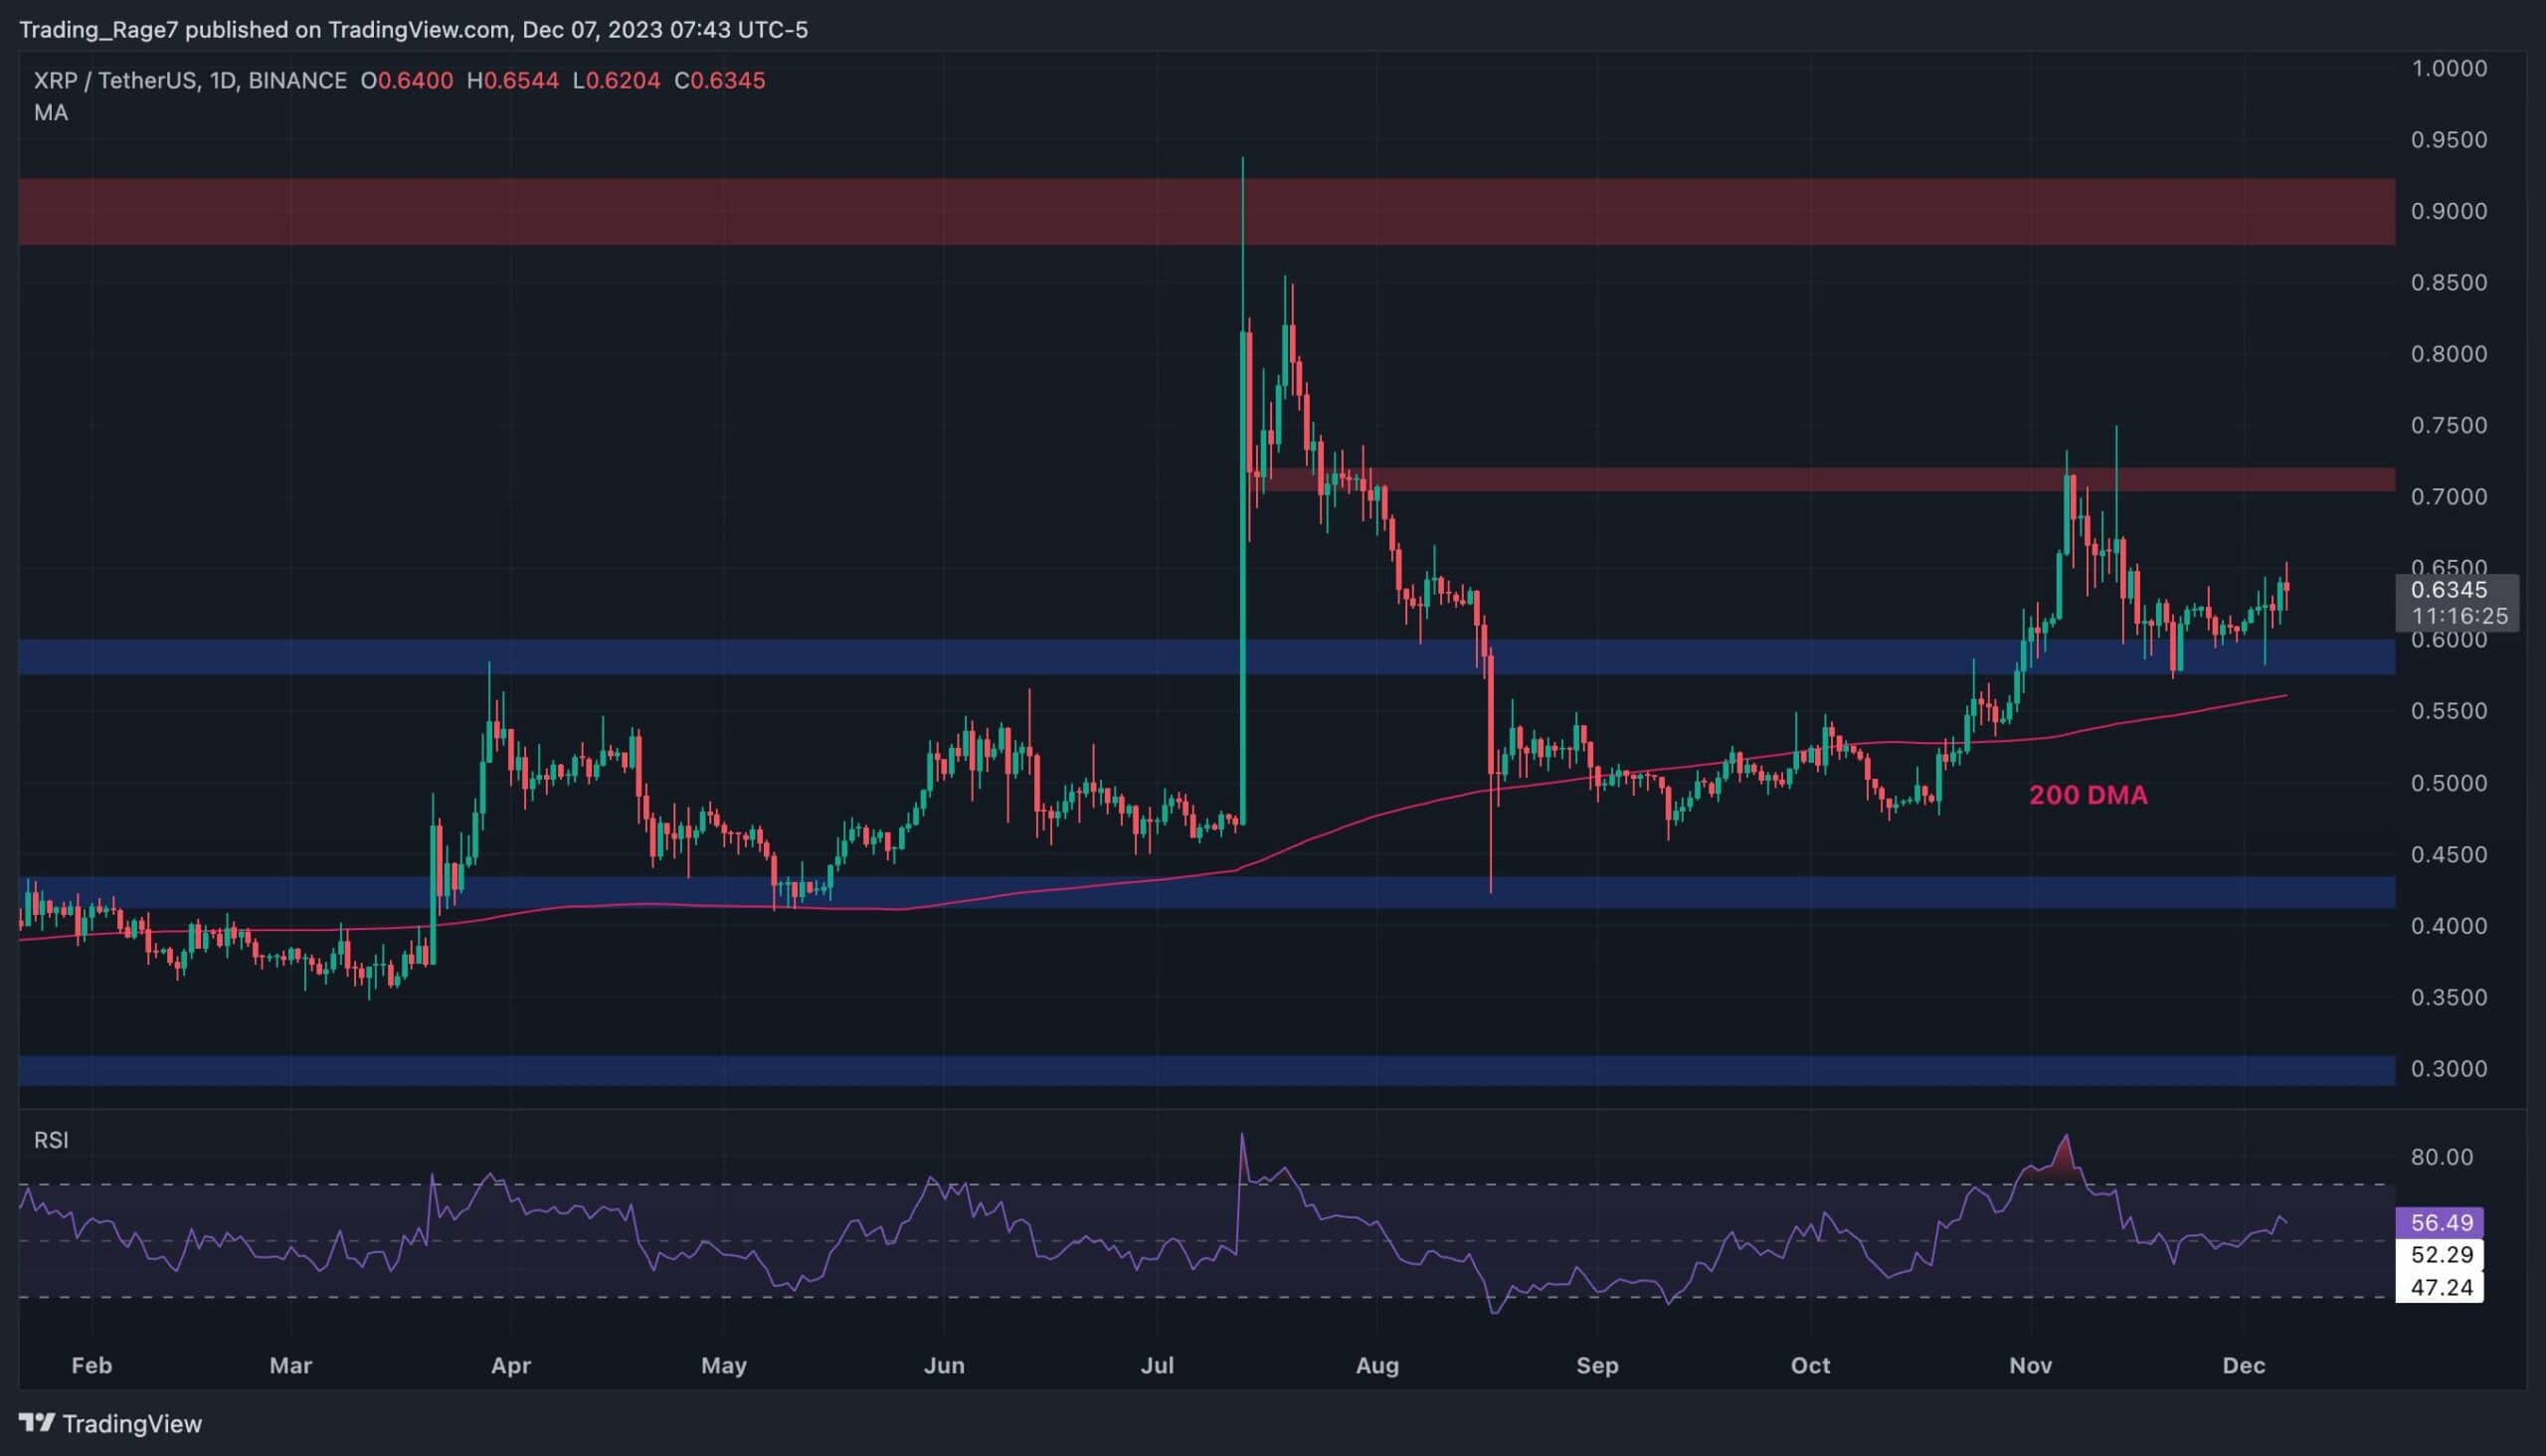
Ripple Price Analysis: The USDT Chart
Against USDT, the price has been supported by the $0.6 level. Yet, it has not rebounded with any considerable bullish momentum. In case this level holds, the price can rise toward the $0.72 resistance level in the short term.
On the other hand, a breakdown of the $0.6 level would result in a drop to the 200-day moving average, which is not far away, trending near the $0.54 mark.
Needless to say, a decline below the 200-day moving average would be very bearish, as the next significant support level lies at the $0.45 area.
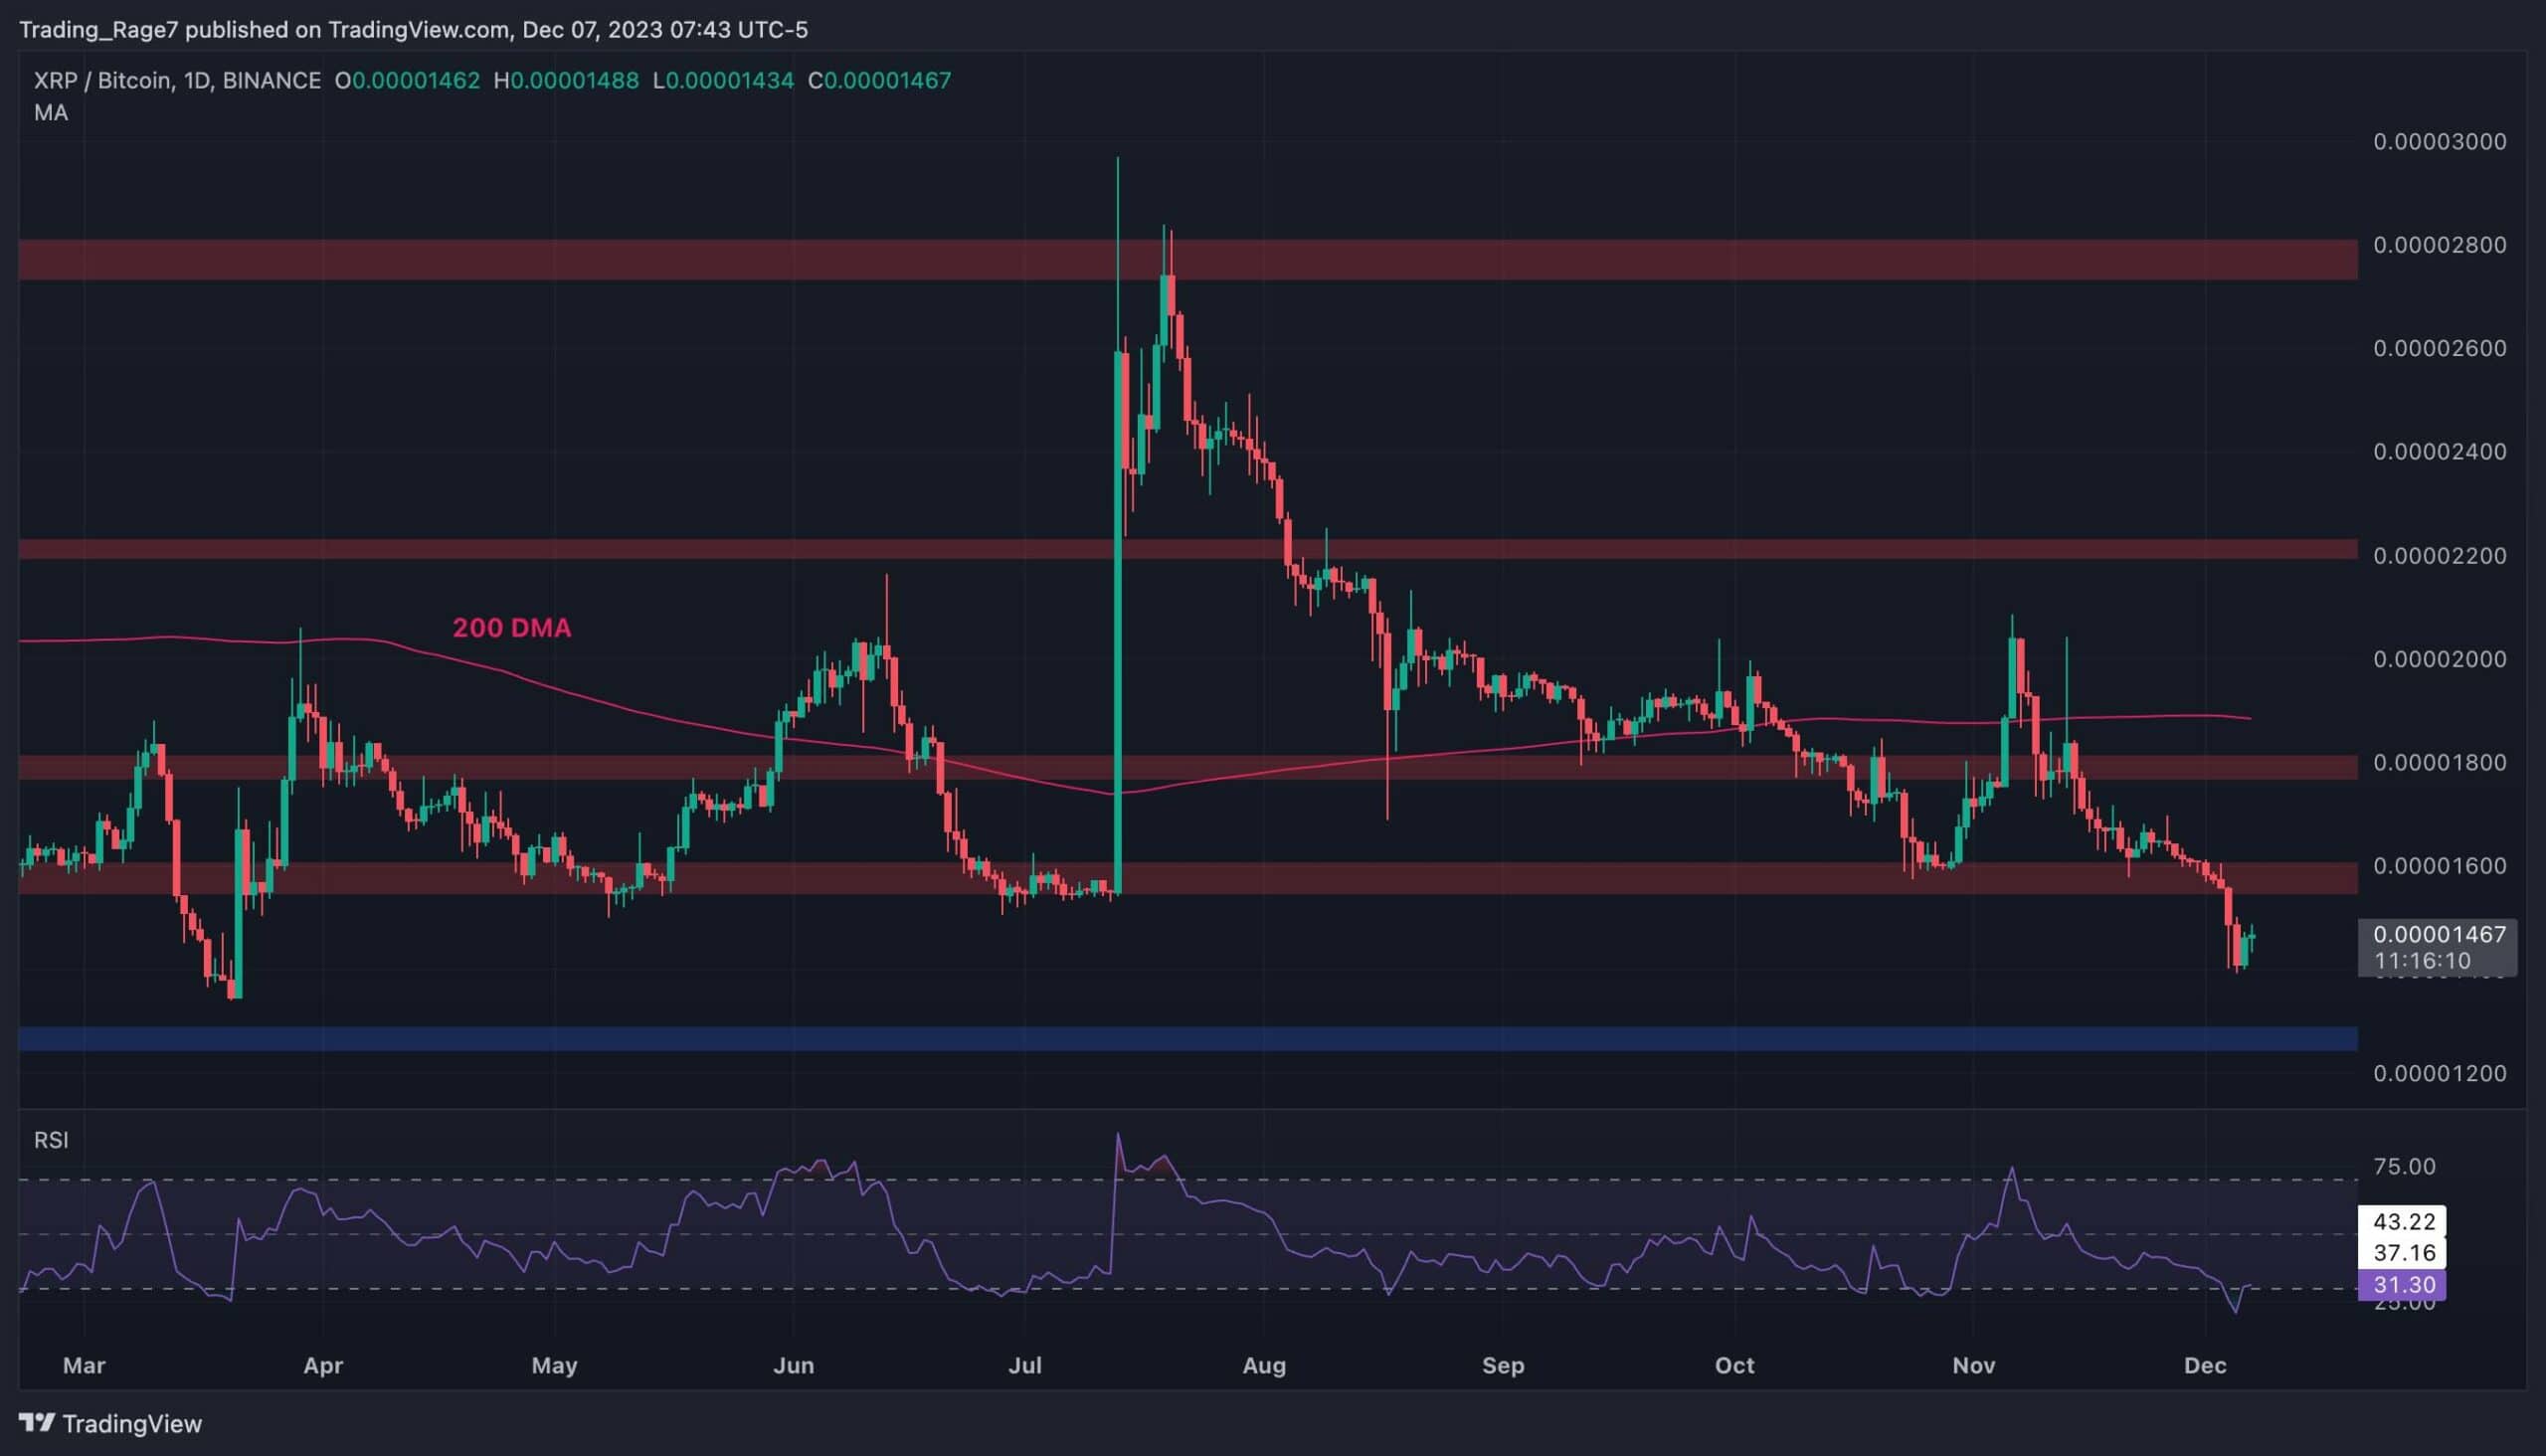
The BTC Paired Chart
Against BTC, the price has been constantly making lower highs and lower lows. It has already broken both the 1800 SAT and the 1600 SAT support levels to the downside.
However, the market is likely to pull back to the broken 1600 SAT zone, which has now turned into a resistance level, as the price action suggests.
The relative strength index is also showing an oversold signal, further boosting the probability of such a pullback occurring in the coming days. A rejection from the level would then pave the way for a further drop toward the 1250 SAT support zone.