Ripple’s price has rallied violently over the past few days, breaking multiple significant resistance levels against both USDT and BTC. However, the price is currently struggling at a key level. Technical Analysis By: Edris XRP/USDT Daily Chart: XRP’s price has risen rapidly since breaking the %excerpt%.43 level to the upside and retesting it. Ripple is currently trading at around %excerpt%.54 per coin and has finally reached the key %excerpt%.55 resistance area. However, the price is seemingly struggling to break above this level, and a short-term pullback or even a reversal could be expected. The RSI indicator is also demonstrating a clear overbought signal, boosting the probability of a bearish rejection from the current level. In case of a deep correction, the %excerpt%.43 level can now be
Topics:
CryptoVizArt considers the following as important: Ripple (XRP) Price, XRP Analysis, xrpbtc, xrpusd
This could be interesting, too:
Jordan Lyanchev writes Ripple’s (XRP) Surge to Triggers Over Million in Short Liquidations
Jordan Lyanchev writes Trump Confirms Work on Strategic Crypto Reserve: XRP, ADA, SOL Included
Dimitar Dzhondzhorov writes Is a Major Ripple v. SEC Lawsuit Development Expected This Week? Here’s Why
Mandy Williams writes Ripple Releases Institutional DeFi Roadmap for XRP Ledger in 2025
Ripple’s price has rallied violently over the past few days, breaking multiple significant resistance levels against both USDT and BTC. However, the price is currently struggling at a key level.
Technical Analysis
By: Edris
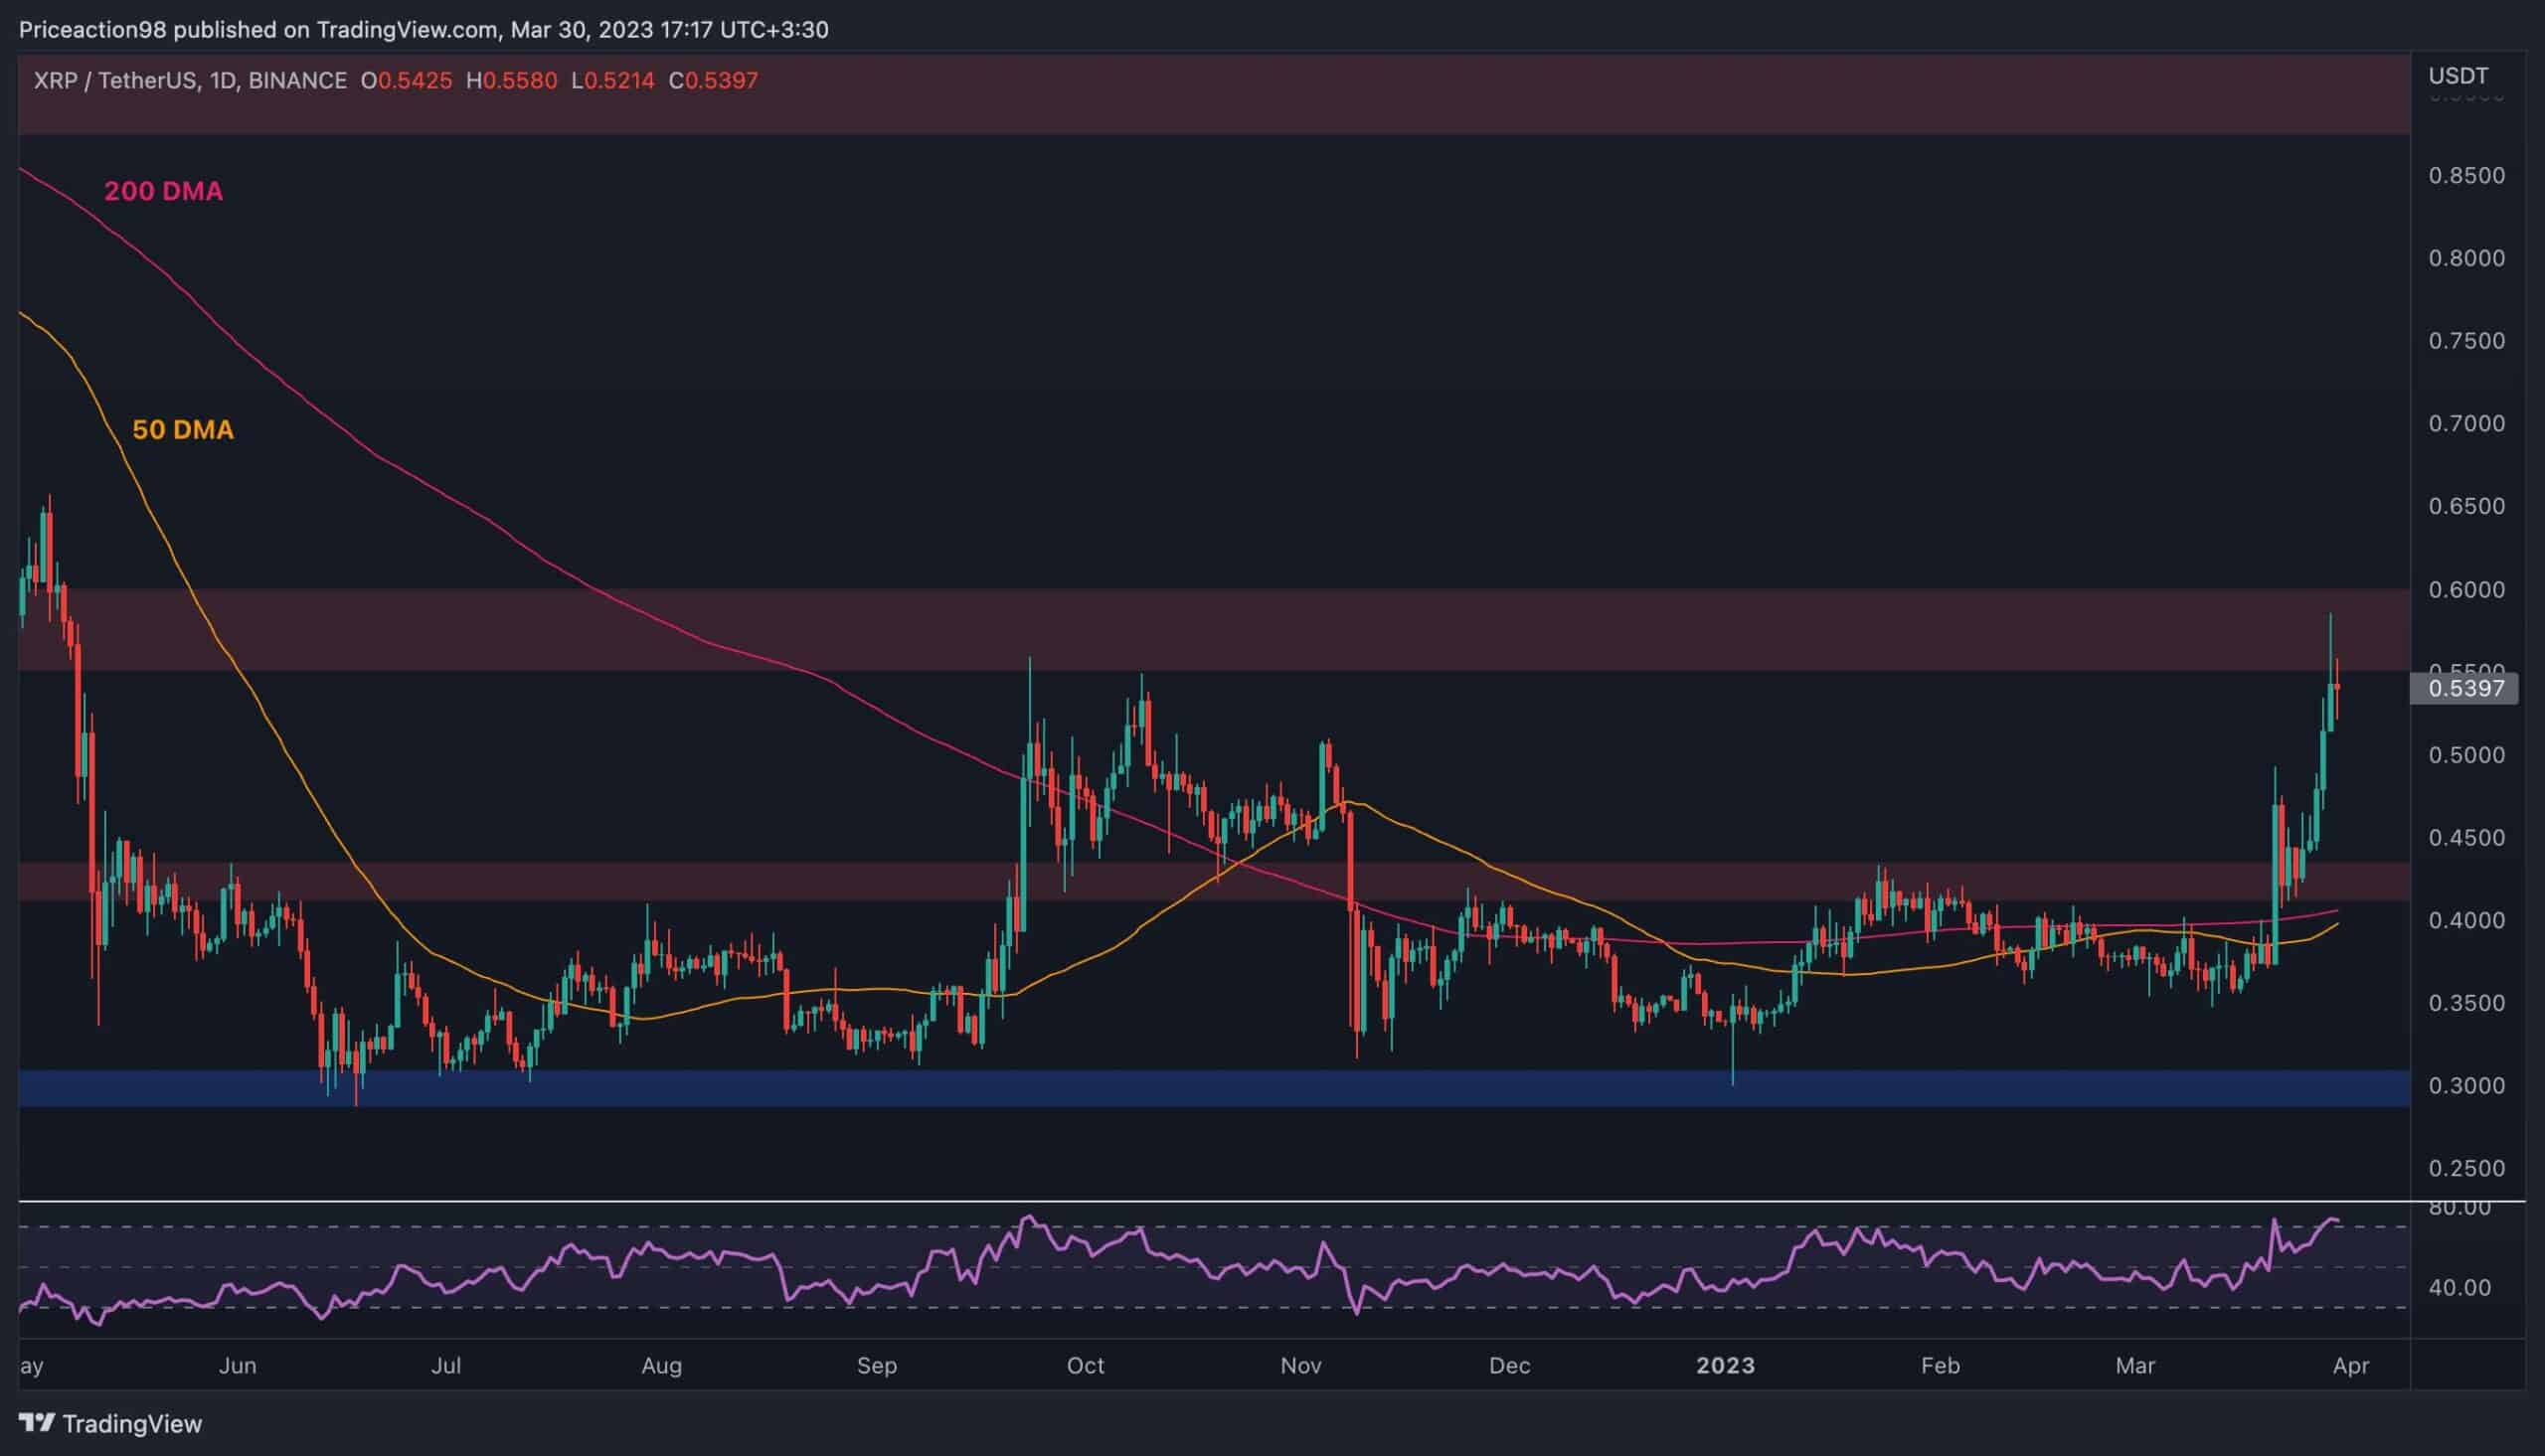
XRP/USDT Daily Chart:
XRP’s price has risen rapidly since breaking the $0.43 level to the upside and retesting it. Ripple is currently trading at around $0.54 per coin and has finally reached the key $0.55 resistance area. However, the price is seemingly struggling to break above this level, and a short-term pullback or even a reversal could be expected.
The RSI indicator is also demonstrating a clear overbought signal, boosting the probability of a bearish rejection from the current level. In case of a deep correction, the $0.43 level can now be counted on as support.
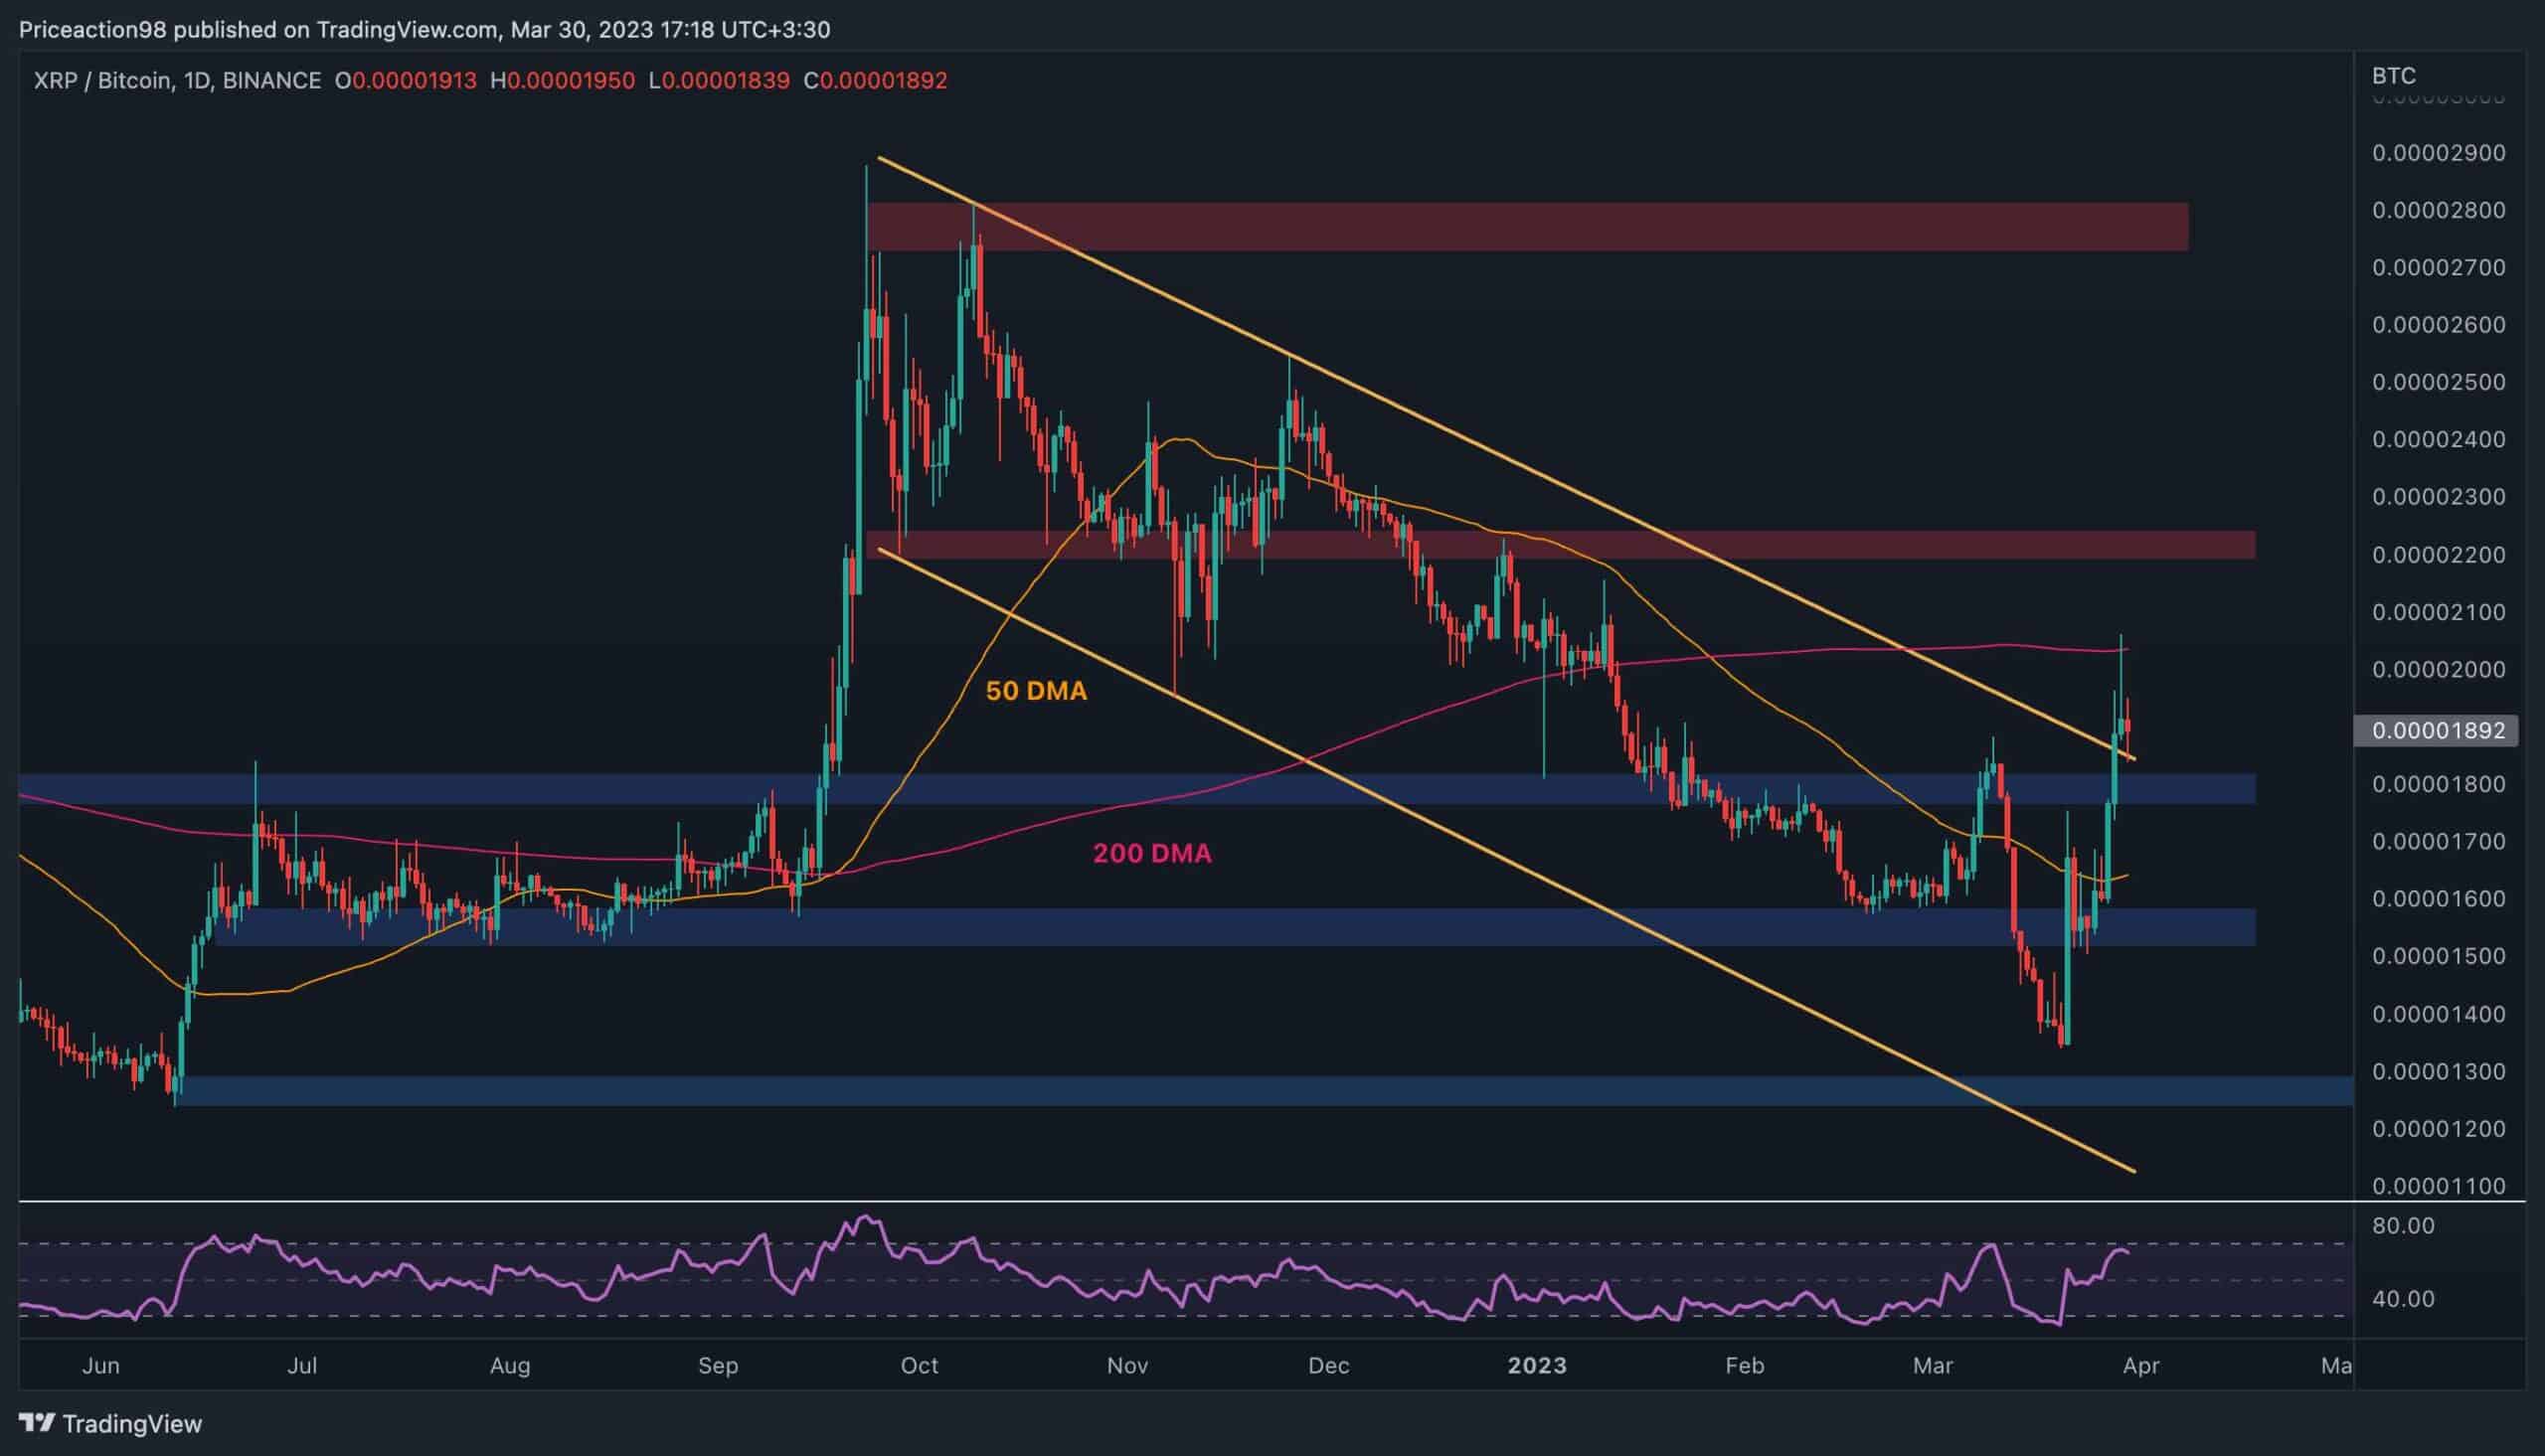
XRP/BTC Daily Chart:
Against BTC, the price action is quite similar, with a nearly vertical surge during the past week. The 0.000016 SAT and 0.000018 SAT resistance levels, and the 50-day moving average located around the 0.0000165 SAT area, have all been broken to the upside with considerable force.
The price has also climbed above the higher boundary of the large ascending channel but is now retesting it following a rejection from the key 200-day moving average around the 0.00002 SAT area.
In case the trendline holds, the 200-day moving average could be tested and broken in the short term, and a rally toward the 0.000022 SAT resistance level would be more probable.
On the other hand, a drop back inside the channel could be disappointing for the bulls, as the fake breakout would likely be followed by a deep correction towards the 0.000016 SAT level at the very least.