Bitcoin’s price has undergone a consistent surge following the recent announcement of SEC ETF approval, reaching a crucial resistance region. This price range includes the upper boundary of the ascending channel and the static resistance at K, presenting challenges in reclaiming this significant level. Technical Analysis By Shayan The Daily Chart A comprehensive analysis of the daily chart reveals a sustained uptrend in the price, approaching a substantial resistance zone. It is defined by the upper boundary of the ascending channel and the critical K threshold, forming a robust barrier for Bitcoin buyers. A successful breakthrough in this crucial area could initiate a profound uptrend, potentially achieving a new all-time high (ATH) for Bitcoin. However, if sellers
Topics:
CryptoVizArt considers the following as important: Bitcoin (BTC) Price, BTC Analysis, BTCEUR, BTCGBP, btcusd, btcusdt
This could be interesting, too:
Chayanika Deka writes XRP, SOL, and ADA Inclusion in US Crypto Reserve Pushes Traders on Edge
Chayanika Deka writes Why Arthur Hayes Is Bullish on Bitcoin Under Trump’s Economic Strategy
Mandy Williams writes Why the Bitcoin Market Is Stuck—and the Key Metric That Could Change It: CryptoQuant CEO
Wayne Jones writes Metaplanet Acquires 156 BTC, Bringing Total Holdings to 2,391
Bitcoin’s price has undergone a consistent surge following the recent announcement of SEC ETF approval, reaching a crucial resistance region.
This price range includes the upper boundary of the ascending channel and the static resistance at $48K, presenting challenges in reclaiming this significant level.
Technical Analysis
By Shayan
The Daily Chart
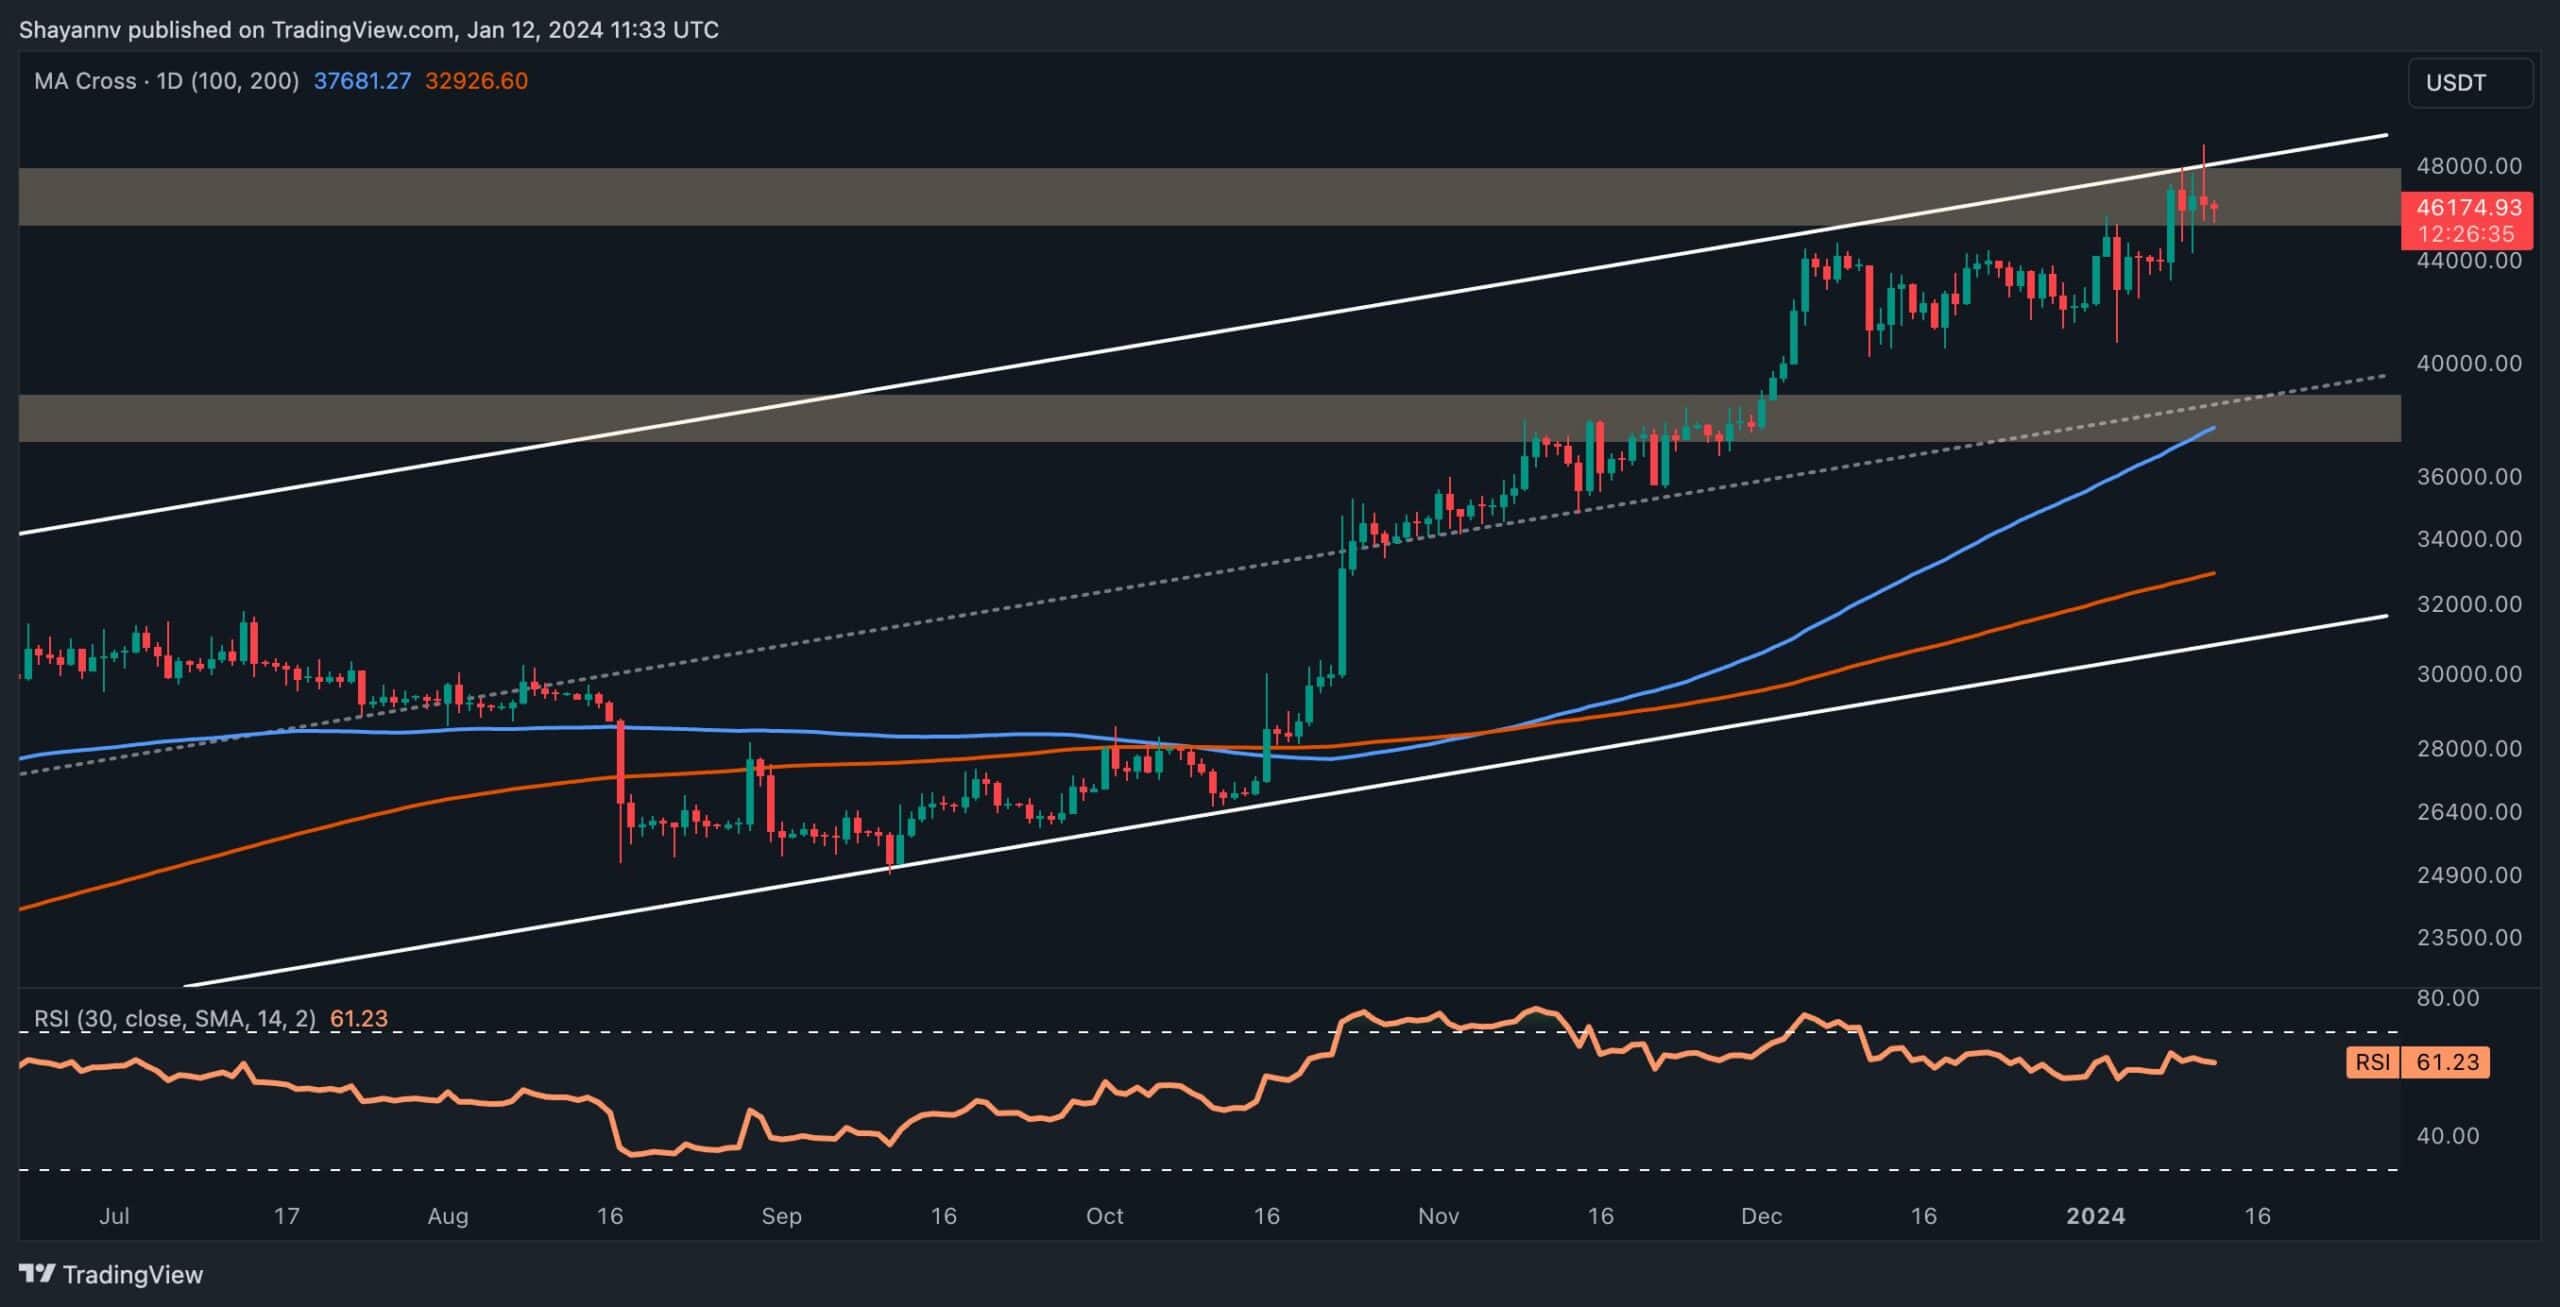
A comprehensive analysis of the daily chart reveals a sustained uptrend in the price, approaching a substantial resistance zone. It is defined by the upper boundary of the ascending channel and the critical $48K threshold, forming a robust barrier for Bitcoin buyers. A successful breakthrough in this crucial area could initiate a profound uptrend, potentially achieving a new all-time high (ATH) for Bitcoin.
However, if sellers gain control, Bitcoin may enter a consolidation correction stage, with the price retracing towards the substantial support region. This support region includes the middle trendline of the channel, coinciding with the 100-day moving average at $38K, potentially halting further downward attempts.
The 4-Hour Chart
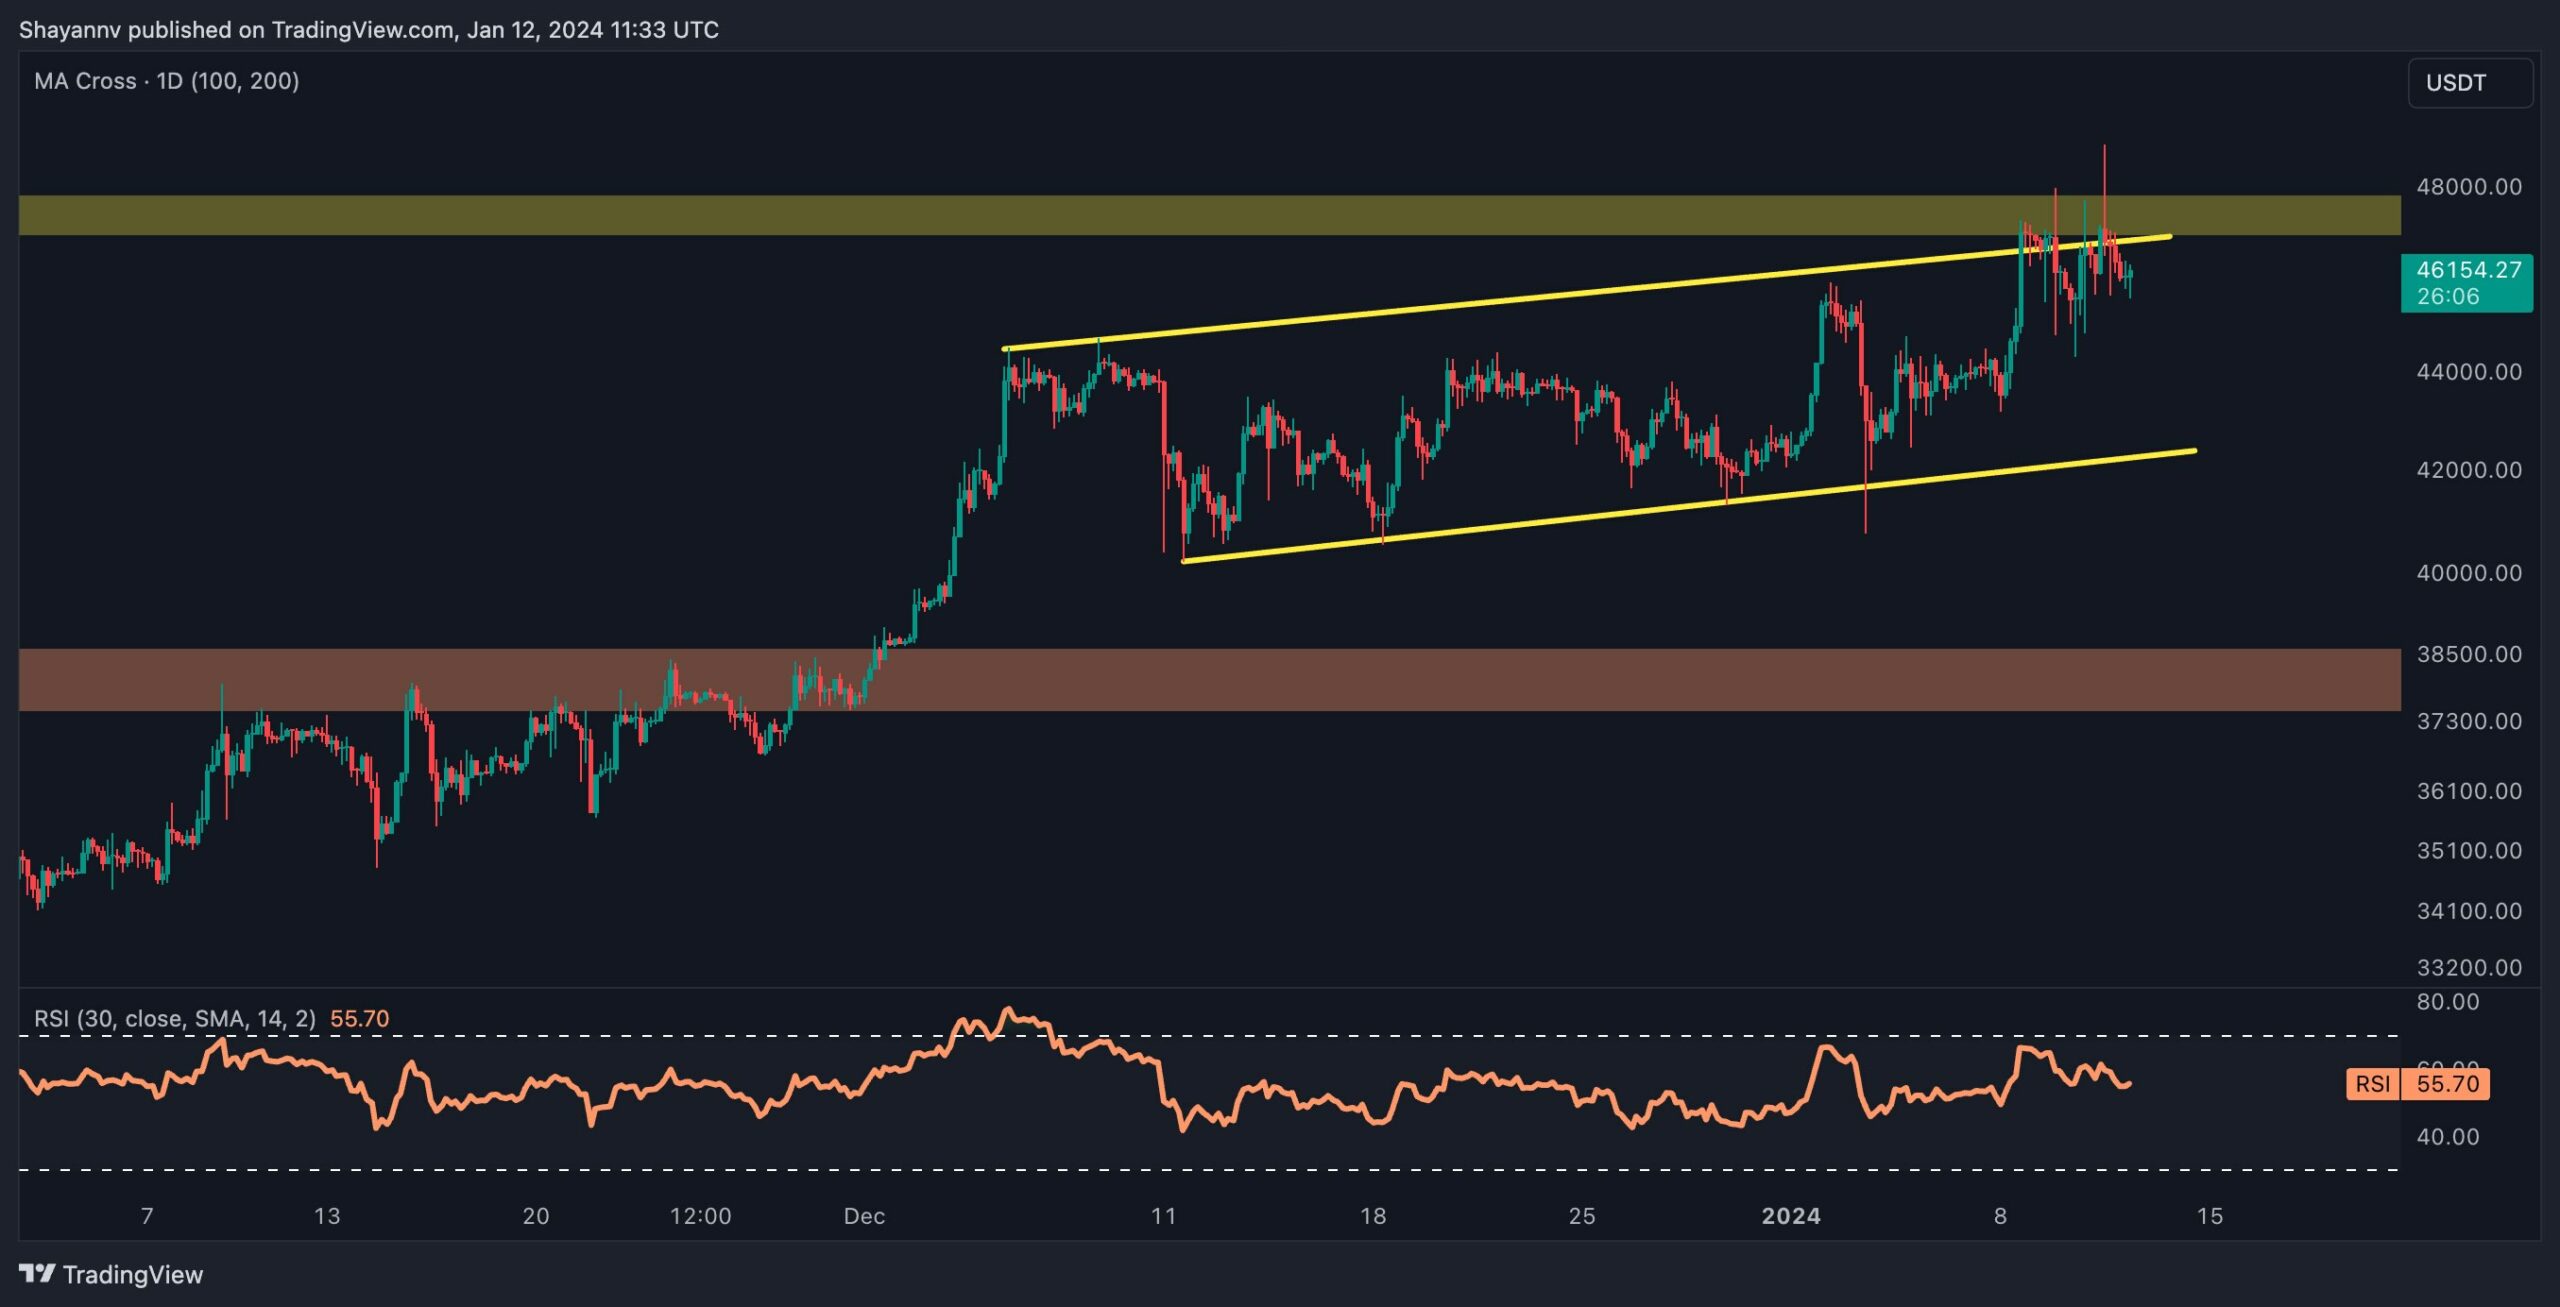
The 4-hour chart illustrates price consolidation within an ascending flag pattern, indicating a balance between sellers and buyers around this price range. However, the recent bullish sentiment stemming from the ETF approval news has led to a renewed uptrend, with the aim of breaching the upper boundary of the flag.
Currently, the price is experiencing heightened volatility as buyers and sellers engage in a struggle. A successful breakout could pave the way for a renewed and notable bullish movement.
However, considering the current market conditions, rejection is still possible, followed by retracement legs toward the substantial support at $38K, completing a necessary correction stage before the next impulsive move.
On-chain Analysis
By Shayan
This chart depicts the Stablecoins(ERC20) Exchange Reserve metric, providing insight into the participants’ risk appetite and potential buying power.
The quantity of dollar-denominated stablecoins (ERC20) held on cryptocurrency exchanges initiated the year at approximately $18 billion and has recently surged to $20 billion this week. This influx of $2 billion underscores the capital flow entering the cryptocurrency market, influencing the current prices of altcoins.
The heightened interest in Bitcoin spot exchange-traded funds (ETFs) is anticipated to contribute further to the capital inflow into the entire crypto ecosystem. Although the trend has been on a decline since the conclusion of 2022, it has remained consistent throughout 2023.
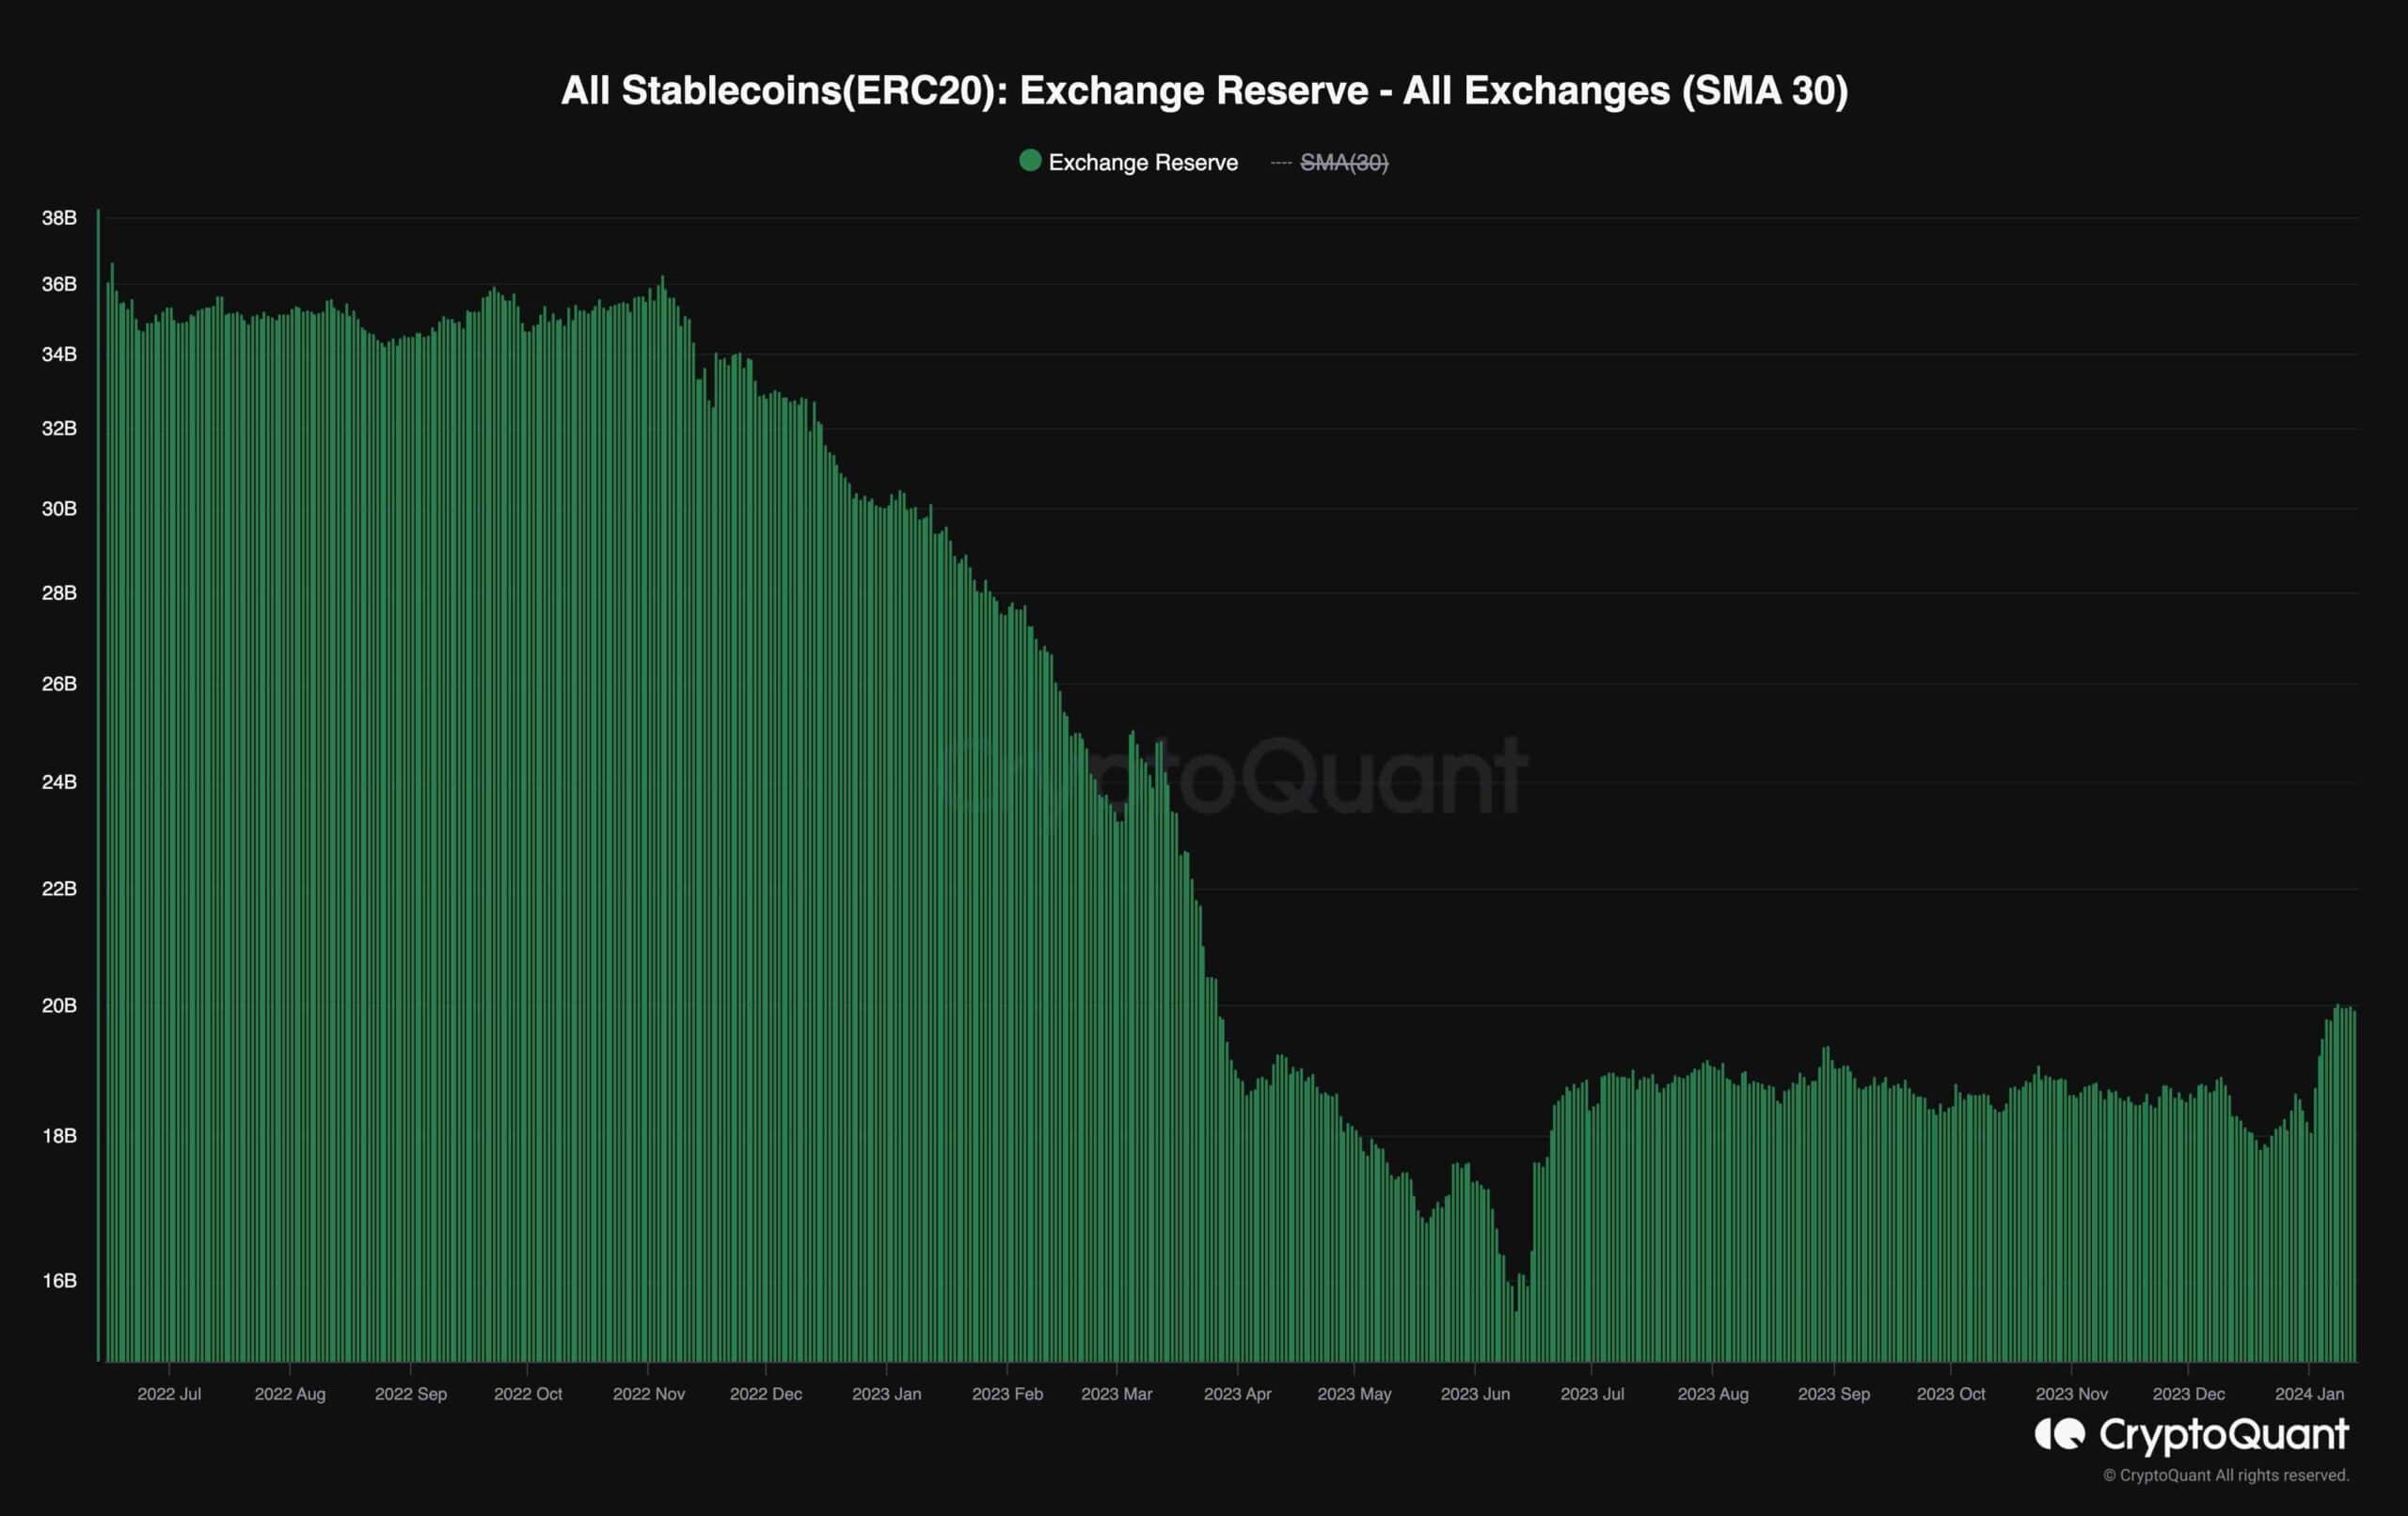
Looking ahead to 2024, considering the first-ever Bitcoin spot ETFs approval, there is a noticeable trend reversal, signaling a potential increase in risk appetite. This shift could ultimately benefit the digital asset market as a whole.