Bitcoin’s price is finally showing signs of breaking the previous all-time high to the upside. Cryptocurrency is entering uncharted territories, and predicting its upside potential becomes a lot more challenging. However, there are some hints interpreted from technical and on-chain analysis. Technical Analysis By TradingRage The Daily Chart On the daily timeframe, the price is finally breaking the previous all-time high to the upside, with the price climbing toward the K level. The psychological resistance levels of K and K might be the upcoming targets for BTC in the coming months. Yet, the Relative Strength Index displays a clear overbought signal, which can point to a potential correction or consolidation in the short term. Source: TradingViewThe 4-Hour Chart
Topics:
CryptoVizArt considers the following as important: Bitcoin (BTC) Price, BTC Analysis, BTCEUR, BTCGBP, btcusd, btcusdt
This could be interesting, too:
Chayanika Deka writes XRP, SOL, and ADA Inclusion in US Crypto Reserve Pushes Traders on Edge
Chayanika Deka writes Why Arthur Hayes Is Bullish on Bitcoin Under Trump’s Economic Strategy
Mandy Williams writes Why the Bitcoin Market Is Stuck—and the Key Metric That Could Change It: CryptoQuant CEO
Wayne Jones writes Metaplanet Acquires 156 BTC, Bringing Total Holdings to 2,391
Bitcoin’s price is finally showing signs of breaking the previous all-time high to the upside.
Cryptocurrency is entering uncharted territories, and predicting its upside potential becomes a lot more challenging. However, there are some hints interpreted from technical and on-chain analysis.
Technical Analysis
By TradingRage
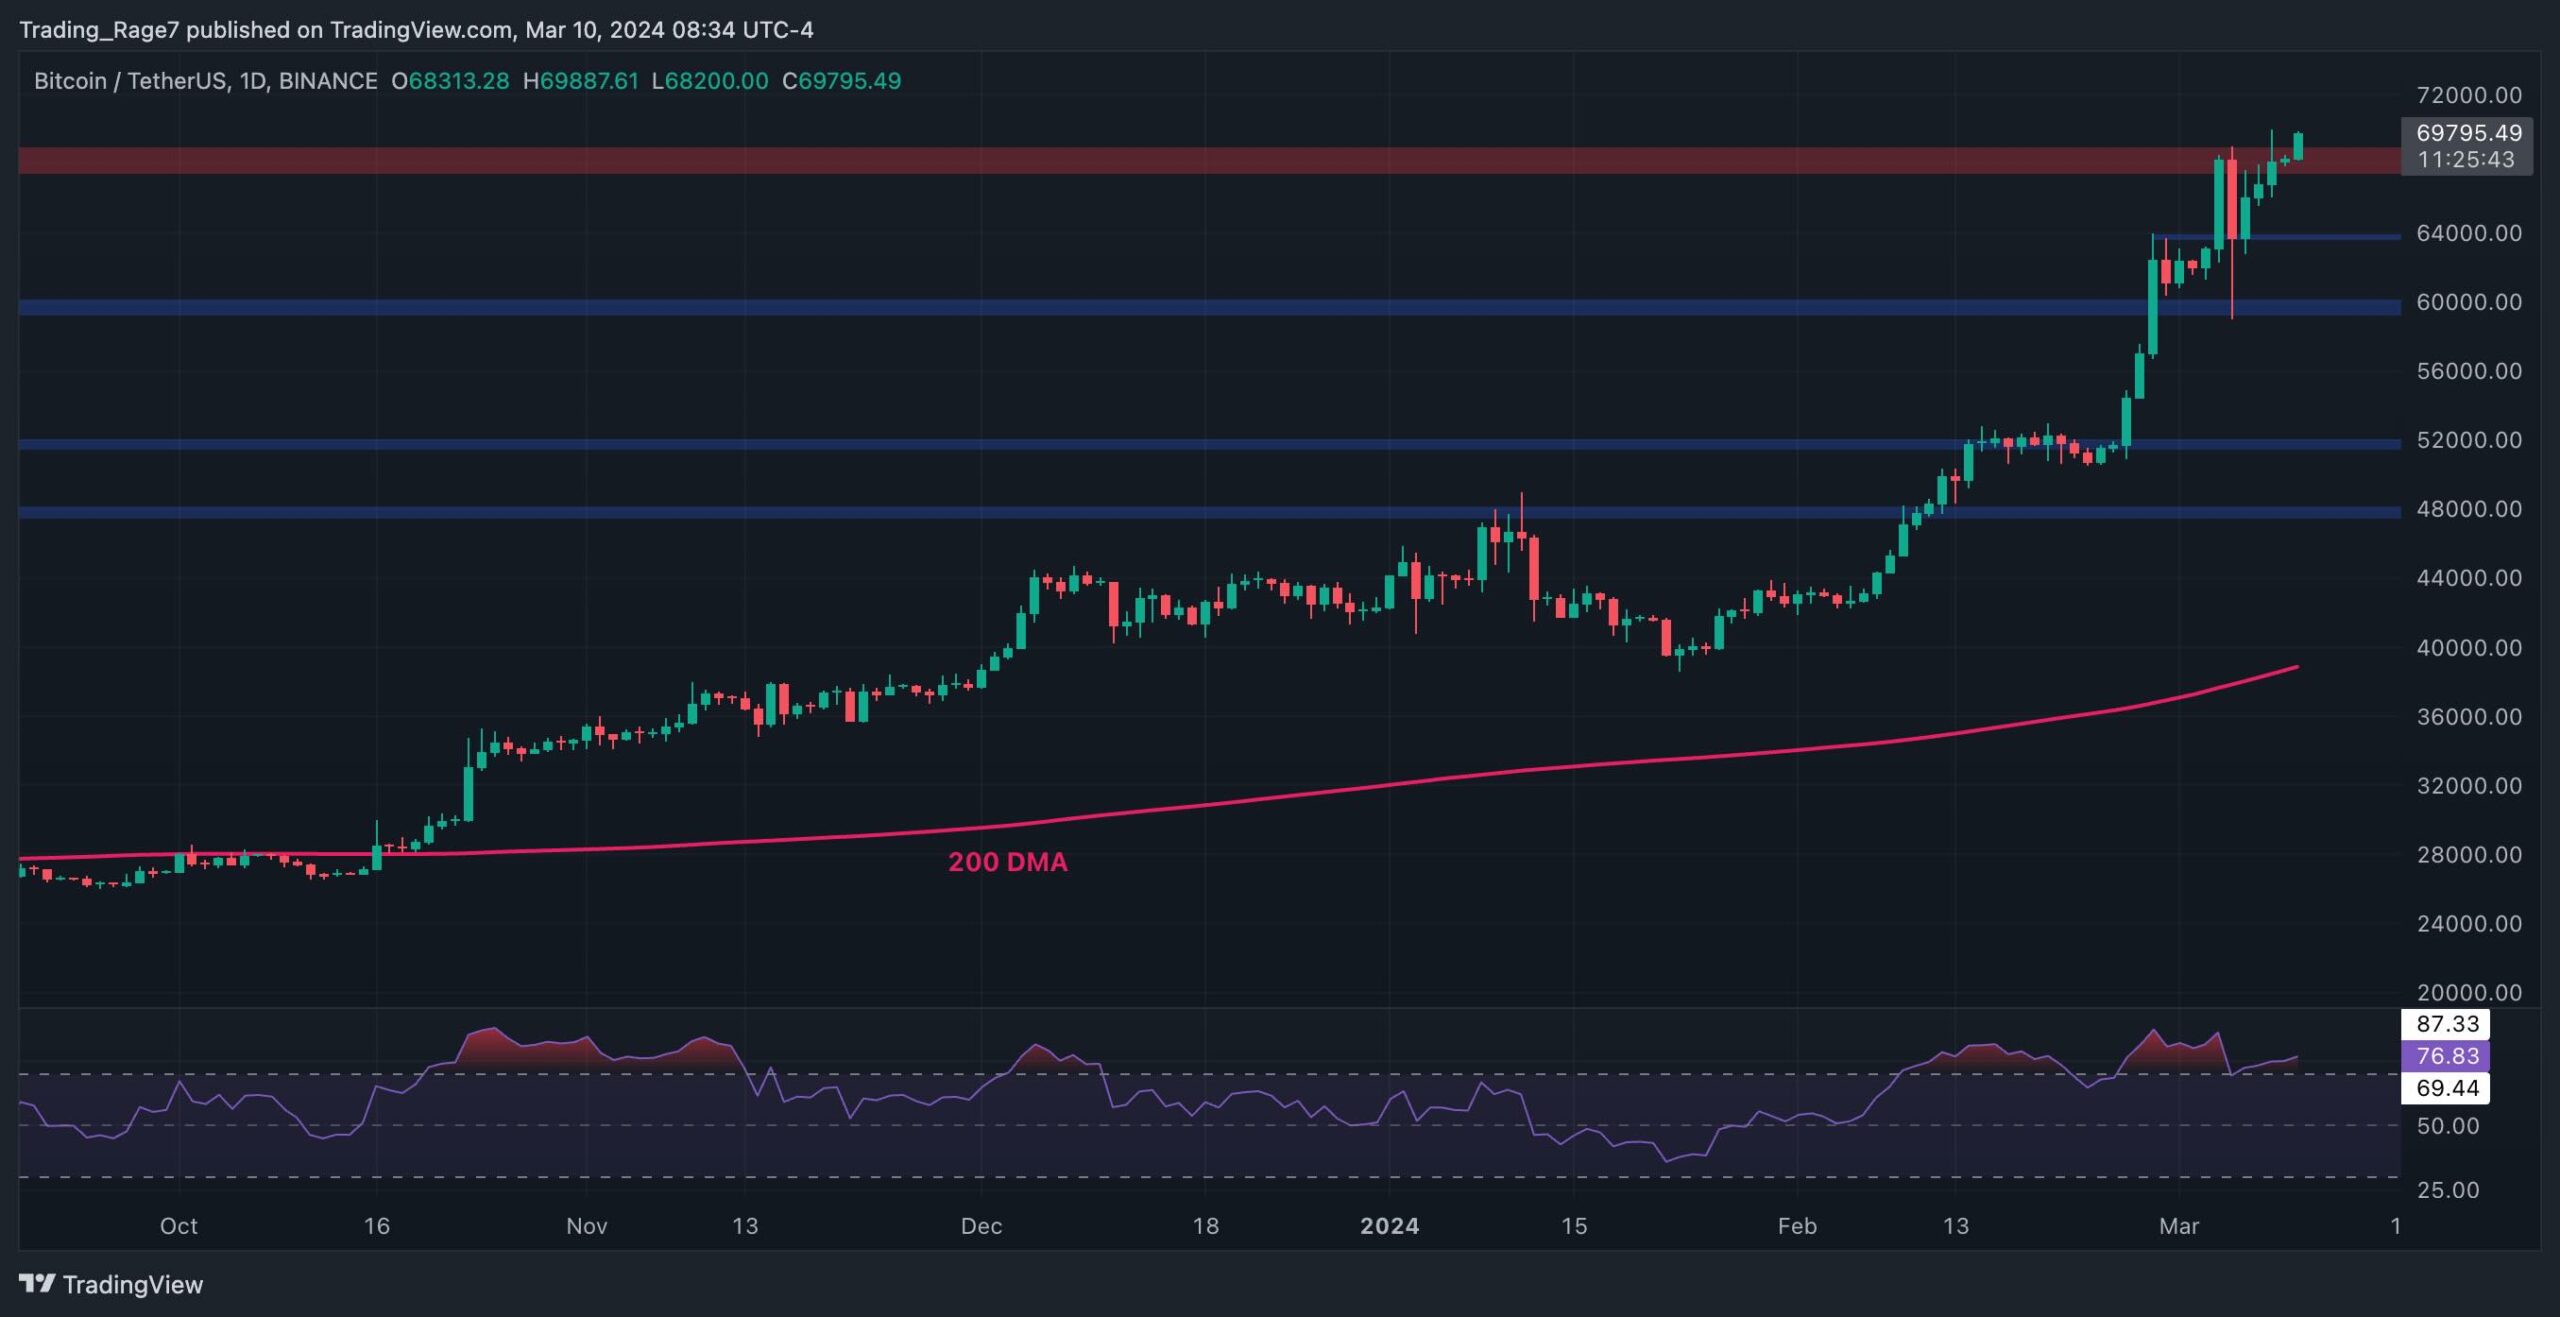
The Daily Chart
On the daily timeframe, the price is finally breaking the previous all-time high to the upside, with the price climbing toward the $70K level.
The psychological resistance levels of $70K and $80K might be the upcoming targets for BTC in the coming months. Yet, the Relative Strength Index displays a clear overbought signal, which can point to a potential correction or consolidation in the short term.
The 4-Hour Chart
Looking at the 4-hour timeframe, the recent consolidation becomes much more clear. The price is gradually climbing above the $69K resistance level, and a longer-term rally might soon begin.
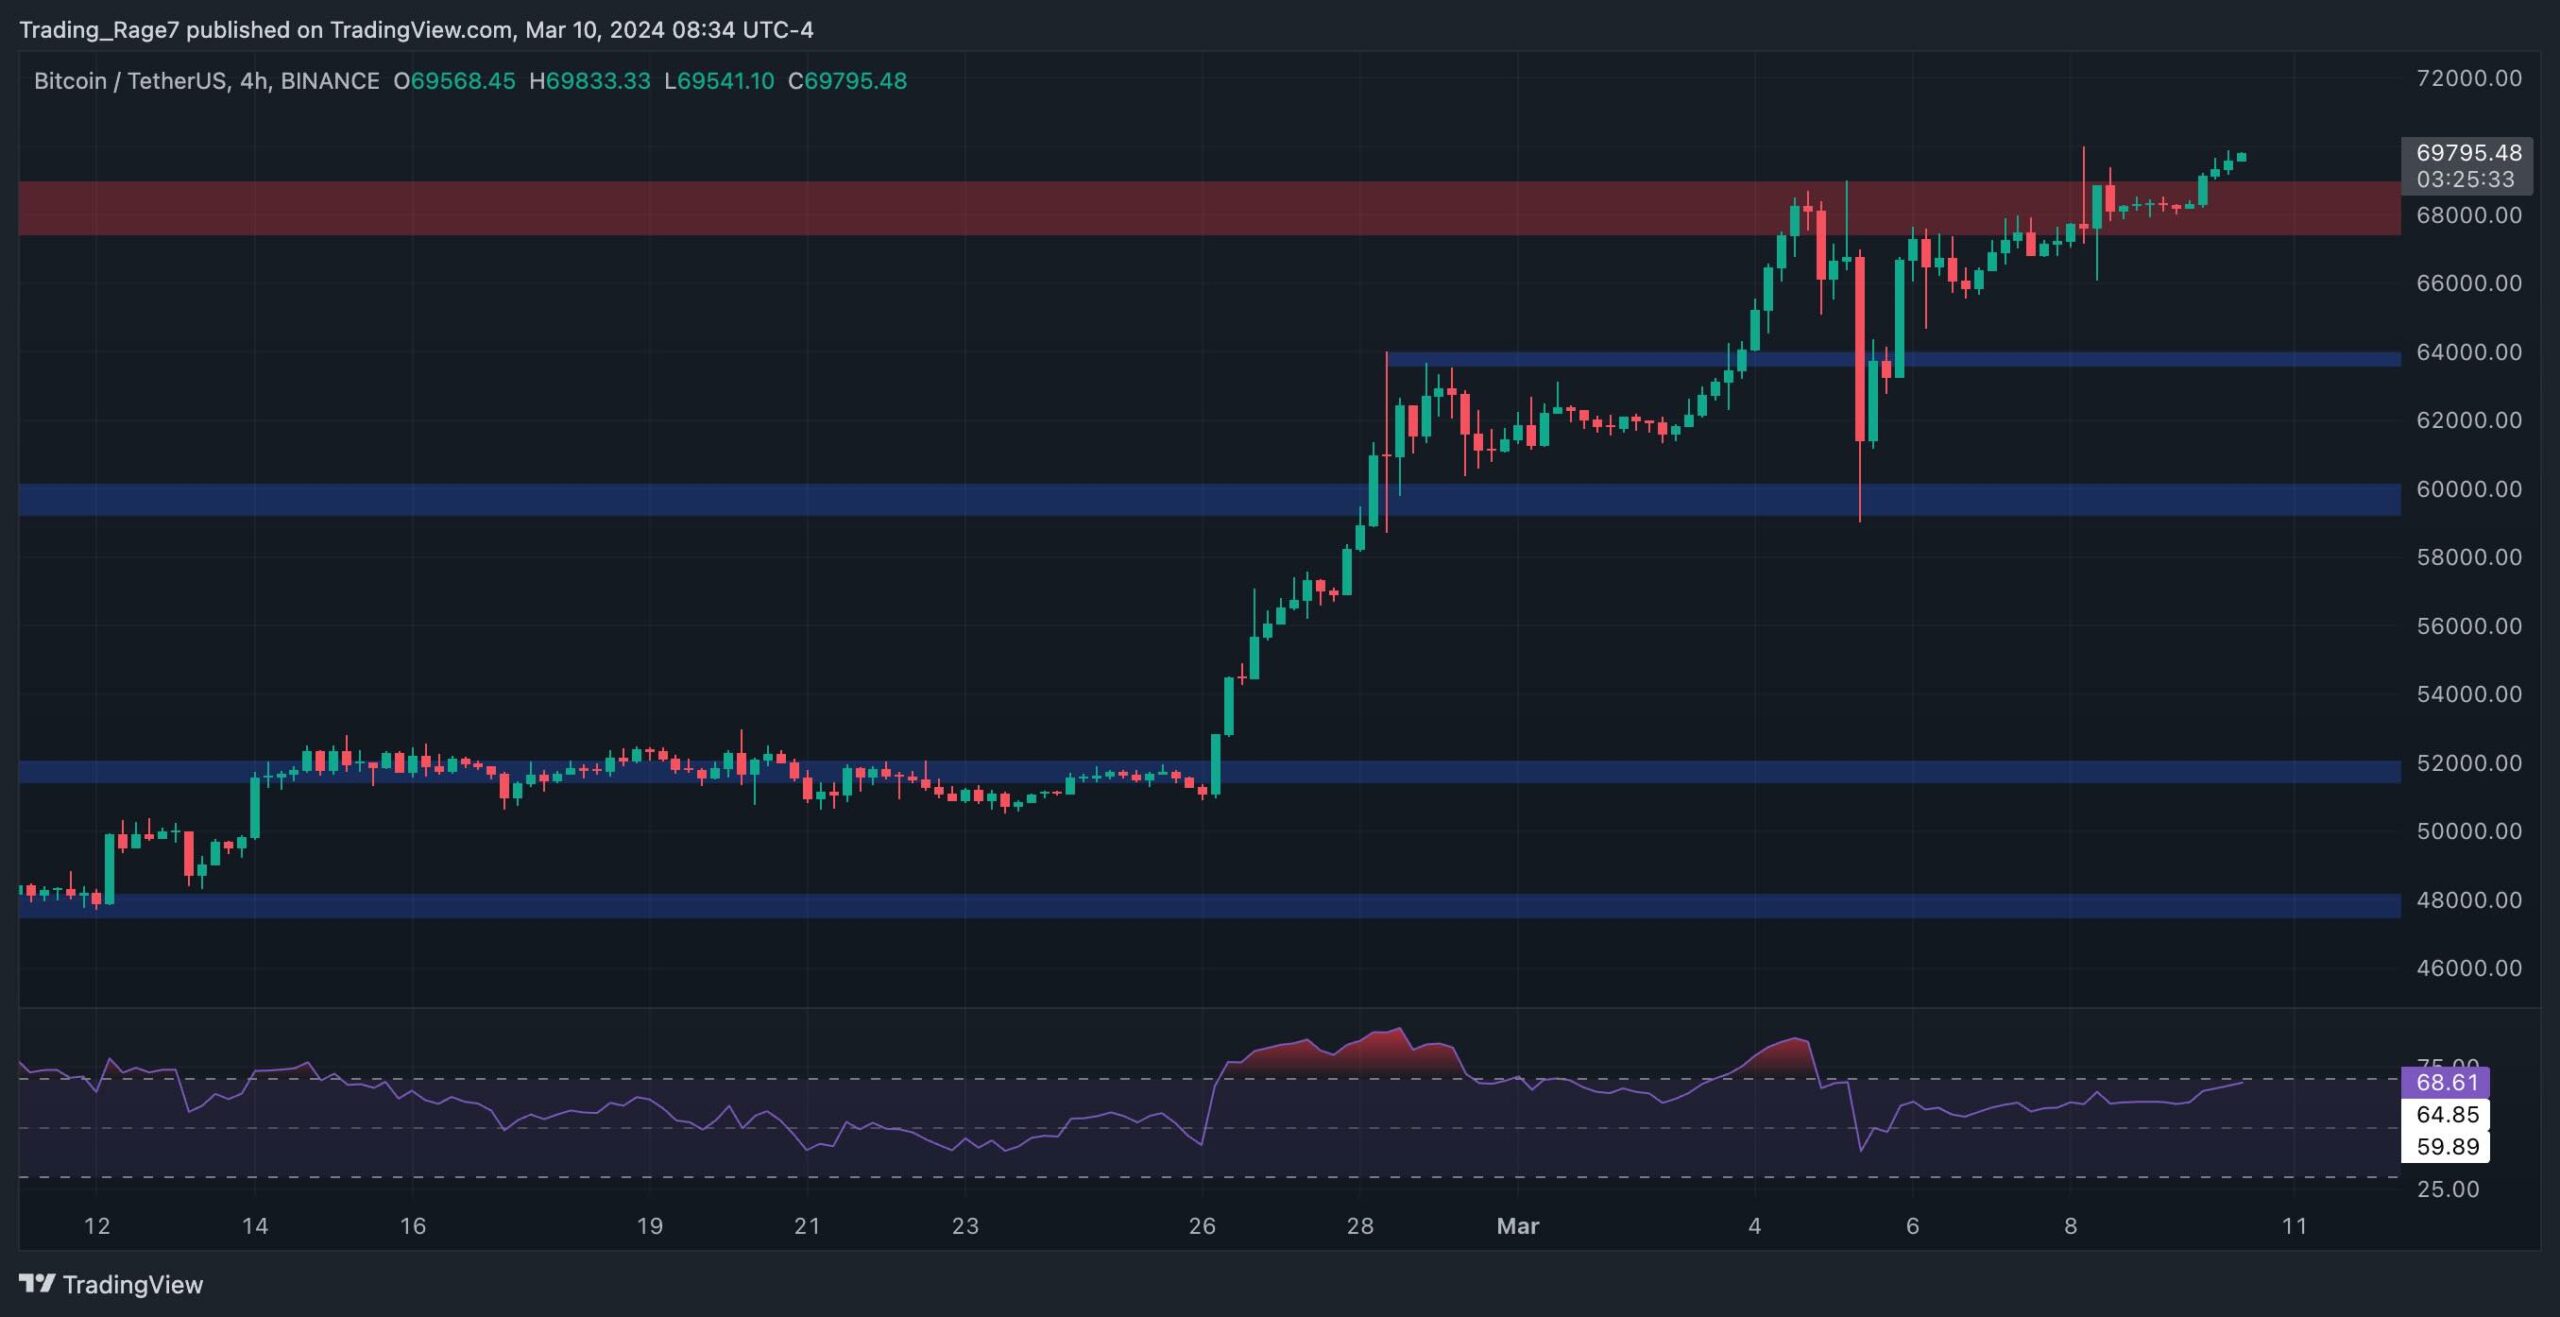
Yet, the Relative Strength Index is also entering the overbought region in this timeframe, indicating that the road ahead might get bumpier for the BTC price. If it goes through a pullback, the $64K support level might be a potential turning point toward higher prices.
Sentiment Analysis
By TradingRage
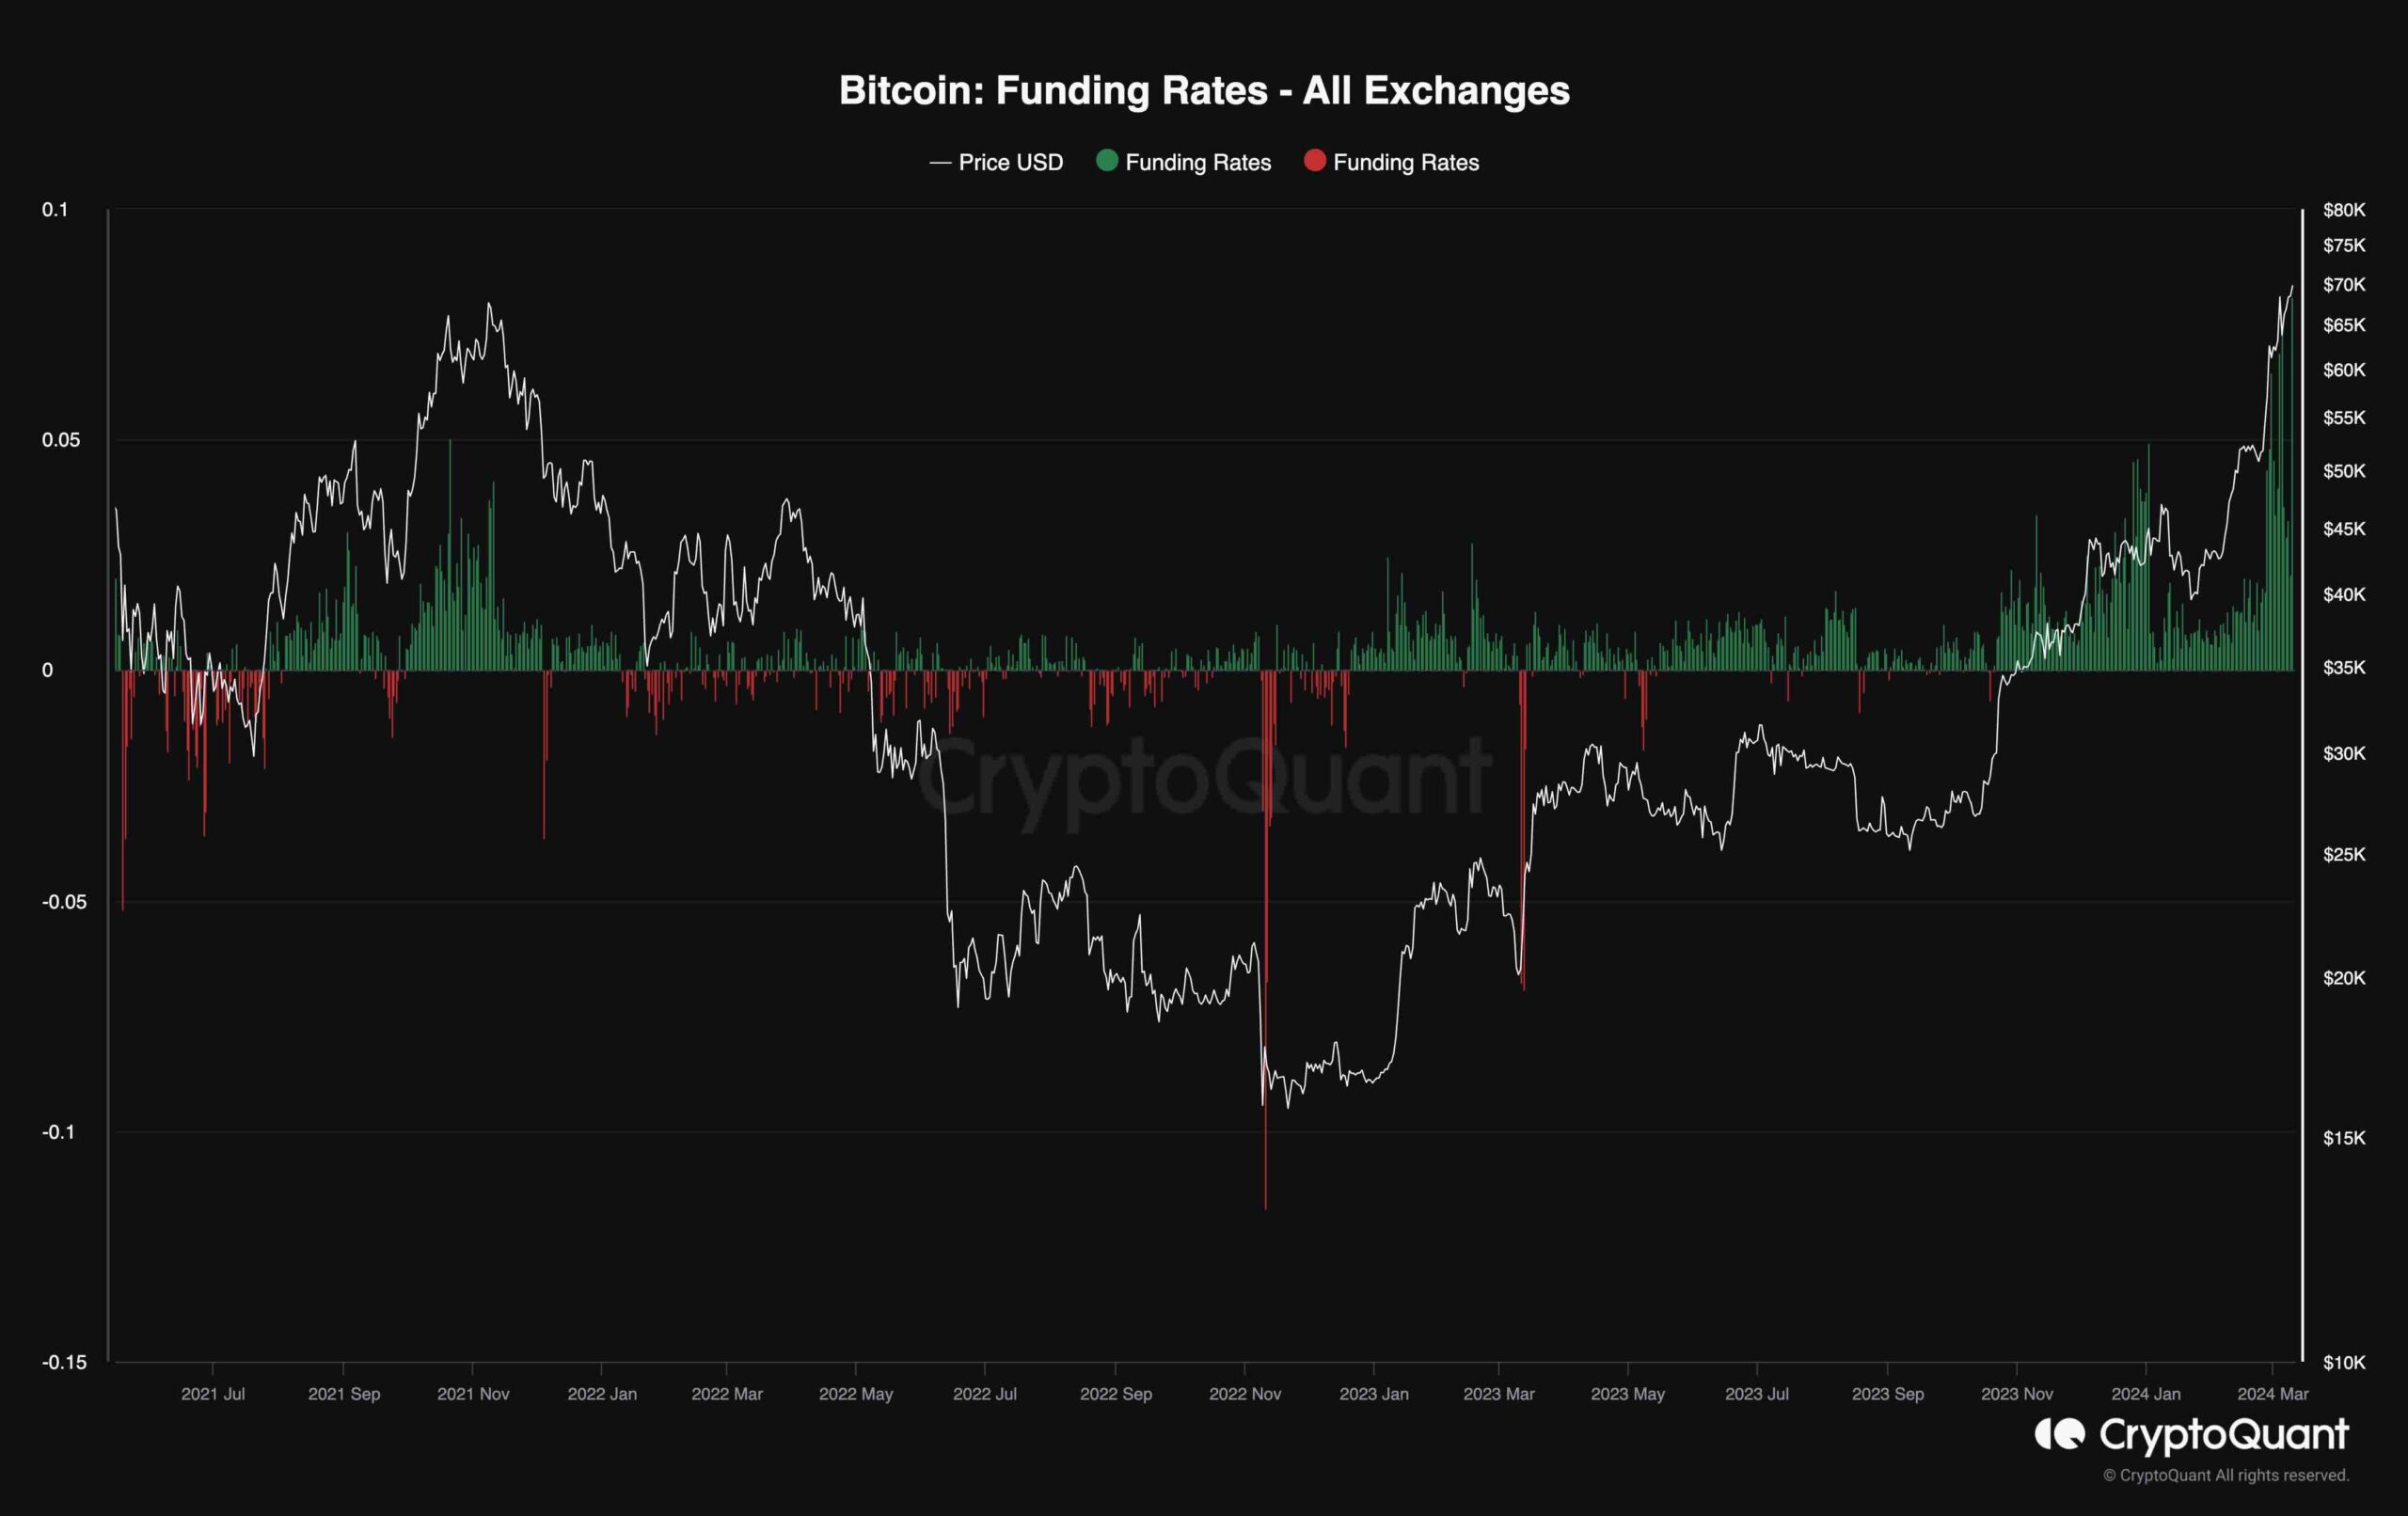
Bitcoin Funding Rates
While Bitcoin’s price has been rallying aggressively after making a new all-time high, market sentiment is in a euphoric state. However, this extreme optimism might prove costly for BTC.
This chart demonstrates the funding rates metric, which measures whether the buyers or sellers are executing their orders more aggressively. Positive values indicate bullish sentiment, while negative values are associated with bearish sentiment.
It is evident that the funding rates have been displaying highly positive values recently. The metric is even showing values higher than those witnessed during the previous all-time high. As a result, the probability of a long liquidation cascade seems very high in the short term, which could lead to a pullback or reversal.