Bitcoin’s price has entered a sideways consolidation phase following a notable surge toward the K resistance level, leaving market participants uncertain about its next direction. However, a short-term correction seems likely. Technical Analysis By Shayan The Daily Chart Analysis of the daily chart reveals a prolonged bull market for Bitcoin, characterized by its upward movement within a clearly defined ascending channel. This pattern indicates strong buyer dominance, potentially aiming for a new all-time high (ATH). Despite this bullish sentiment, Bitcoin has encountered a critical resistance zone near the K mark after its recent upward surge. Consequently, a period of consolidation correction is anticipated, allowing the market to find support levels around the
Topics:
CryptoVizArt considers the following as important: Bitcoin (BTC) Price, BTC Analysis, BTCEUR, BTCGBP, btcusd, btcusdt
This could be interesting, too:
Chayanika Deka writes XRP, SOL, and ADA Inclusion in US Crypto Reserve Pushes Traders on Edge
Chayanika Deka writes Why Arthur Hayes Is Bullish on Bitcoin Under Trump’s Economic Strategy
Mandy Williams writes Why the Bitcoin Market Is Stuck—and the Key Metric That Could Change It: CryptoQuant CEO
Wayne Jones writes Metaplanet Acquires 156 BTC, Bringing Total Holdings to 2,391
Bitcoin’s price has entered a sideways consolidation phase following a notable surge toward the $52K resistance level, leaving market participants uncertain about its next direction. However, a short-term correction seems likely.
Technical Analysis
By Shayan
The Daily Chart
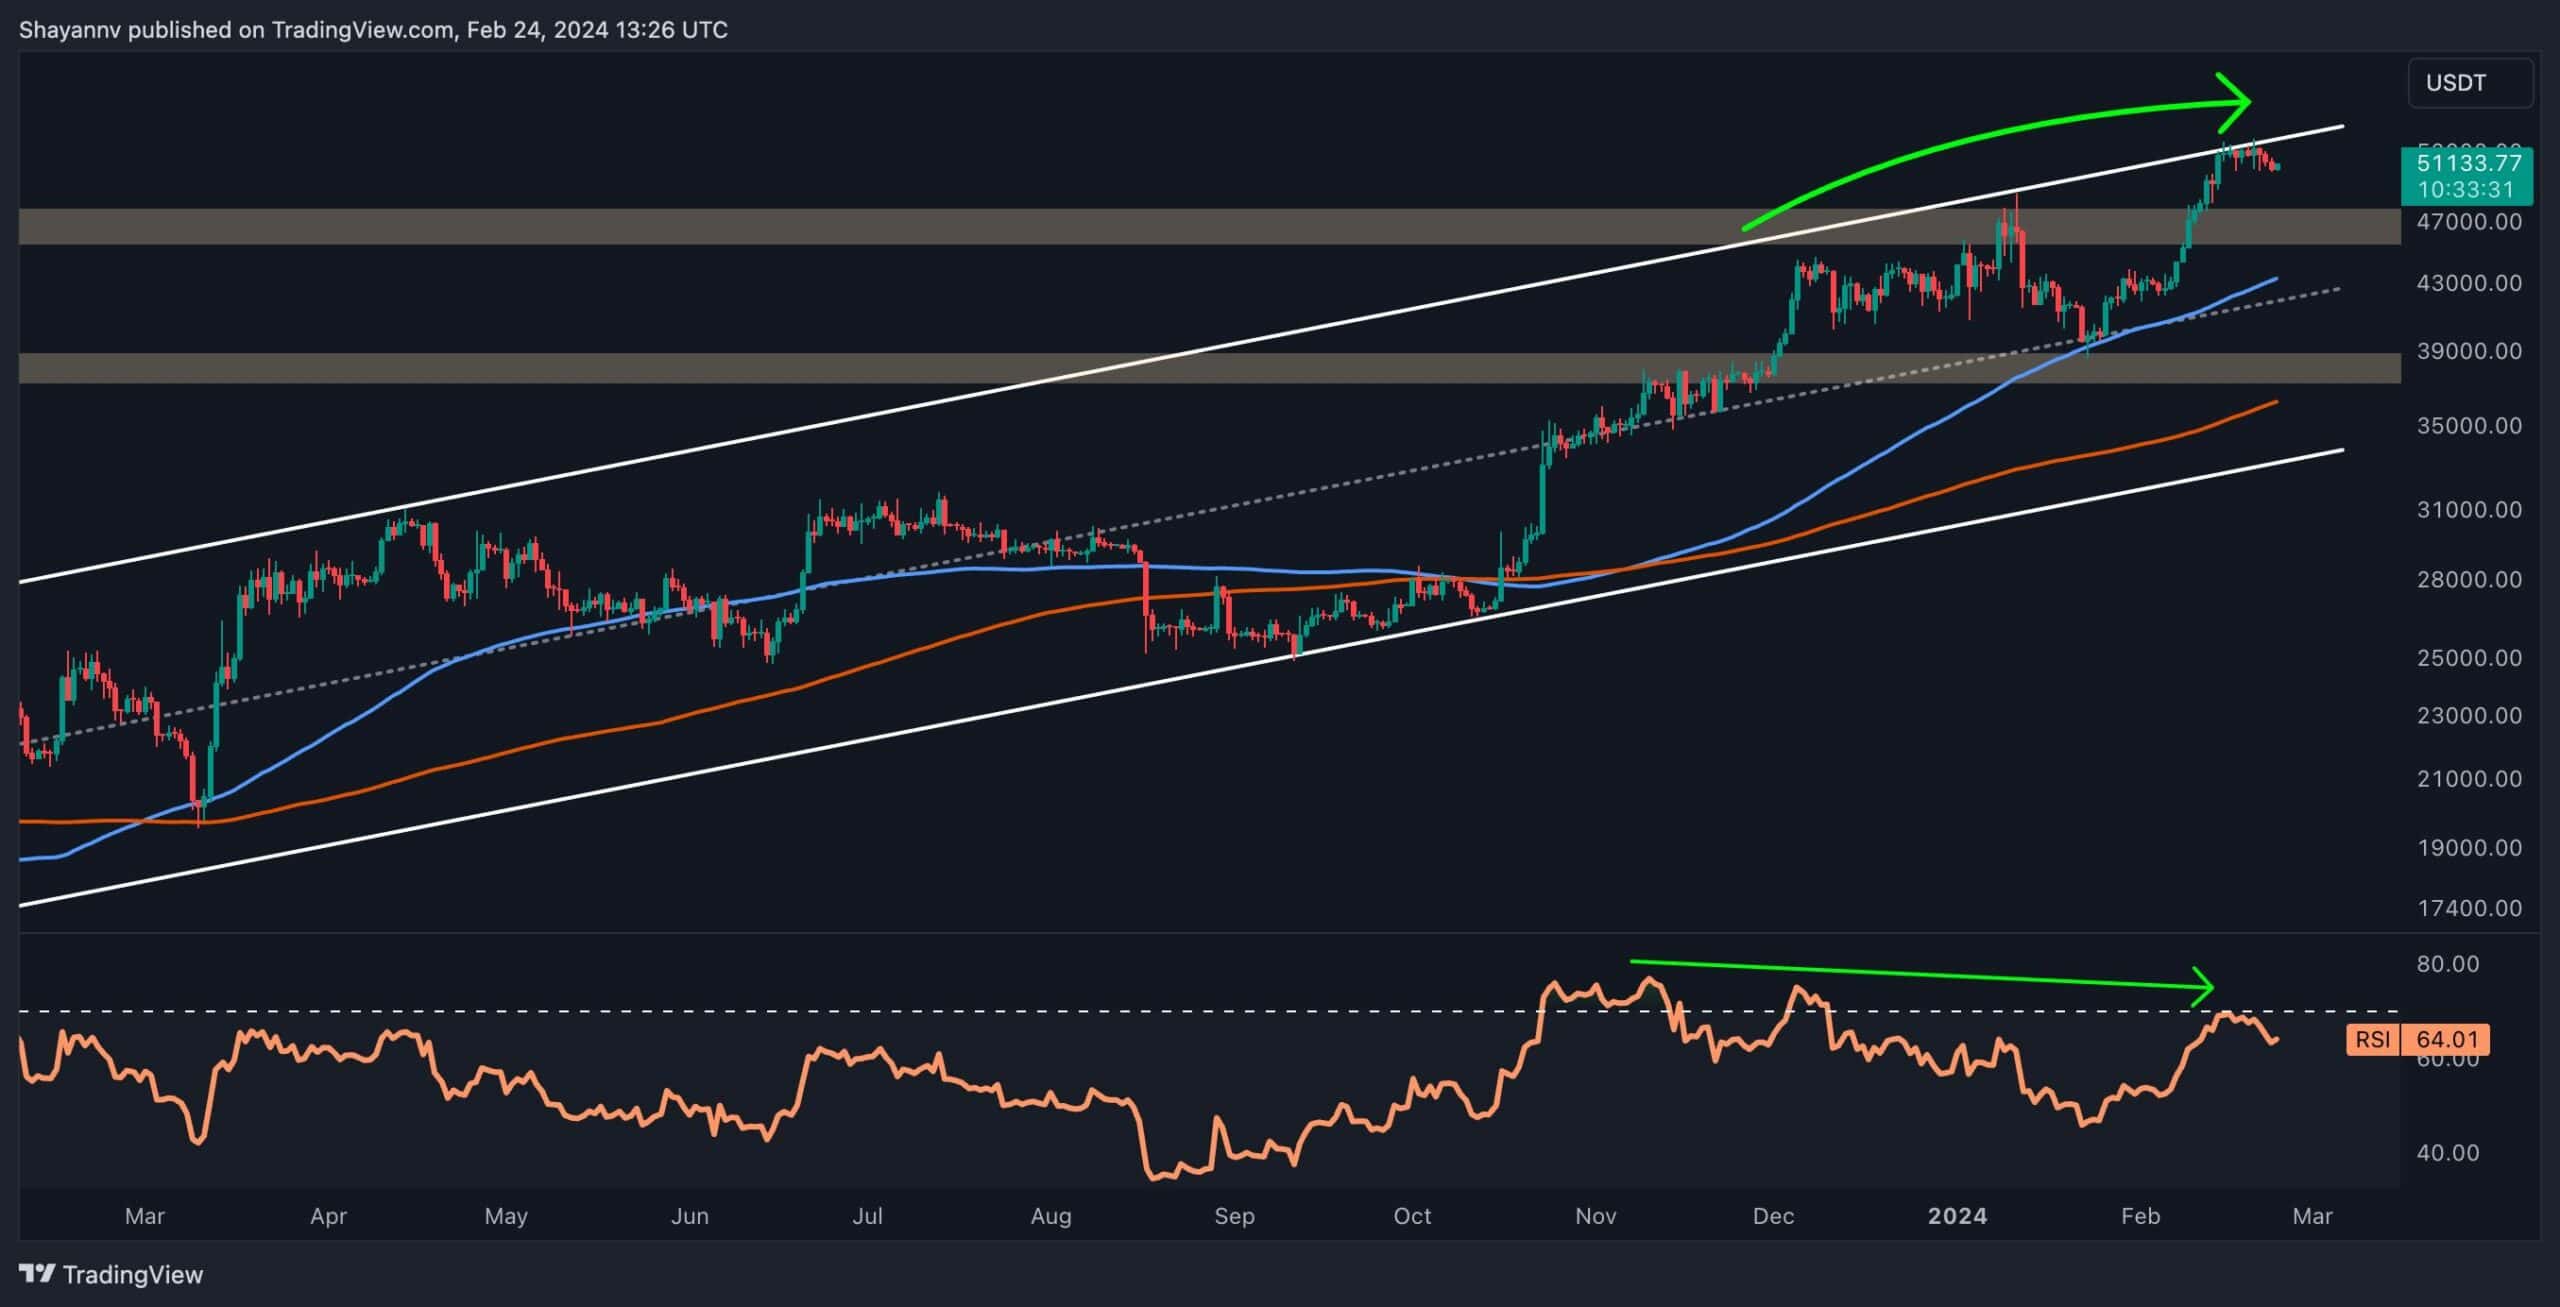
Analysis of the daily chart reveals a prolonged bull market for Bitcoin, characterized by its upward movement within a clearly defined ascending channel. This pattern indicates strong buyer dominance, potentially aiming for a new all-time high (ATH).
Despite this bullish sentiment, Bitcoin has encountered a critical resistance zone near the $52K mark after its recent upward surge.
Consequently, a period of consolidation correction is anticipated, allowing the market to find support levels around the channel’s mid-boundary and the 100-day moving average of $43K. However, a sudden breakthrough above the multi-month ascending channel could trigger a short-squeeze event, leading to another surge in the short term.
The 4-Hour Chart
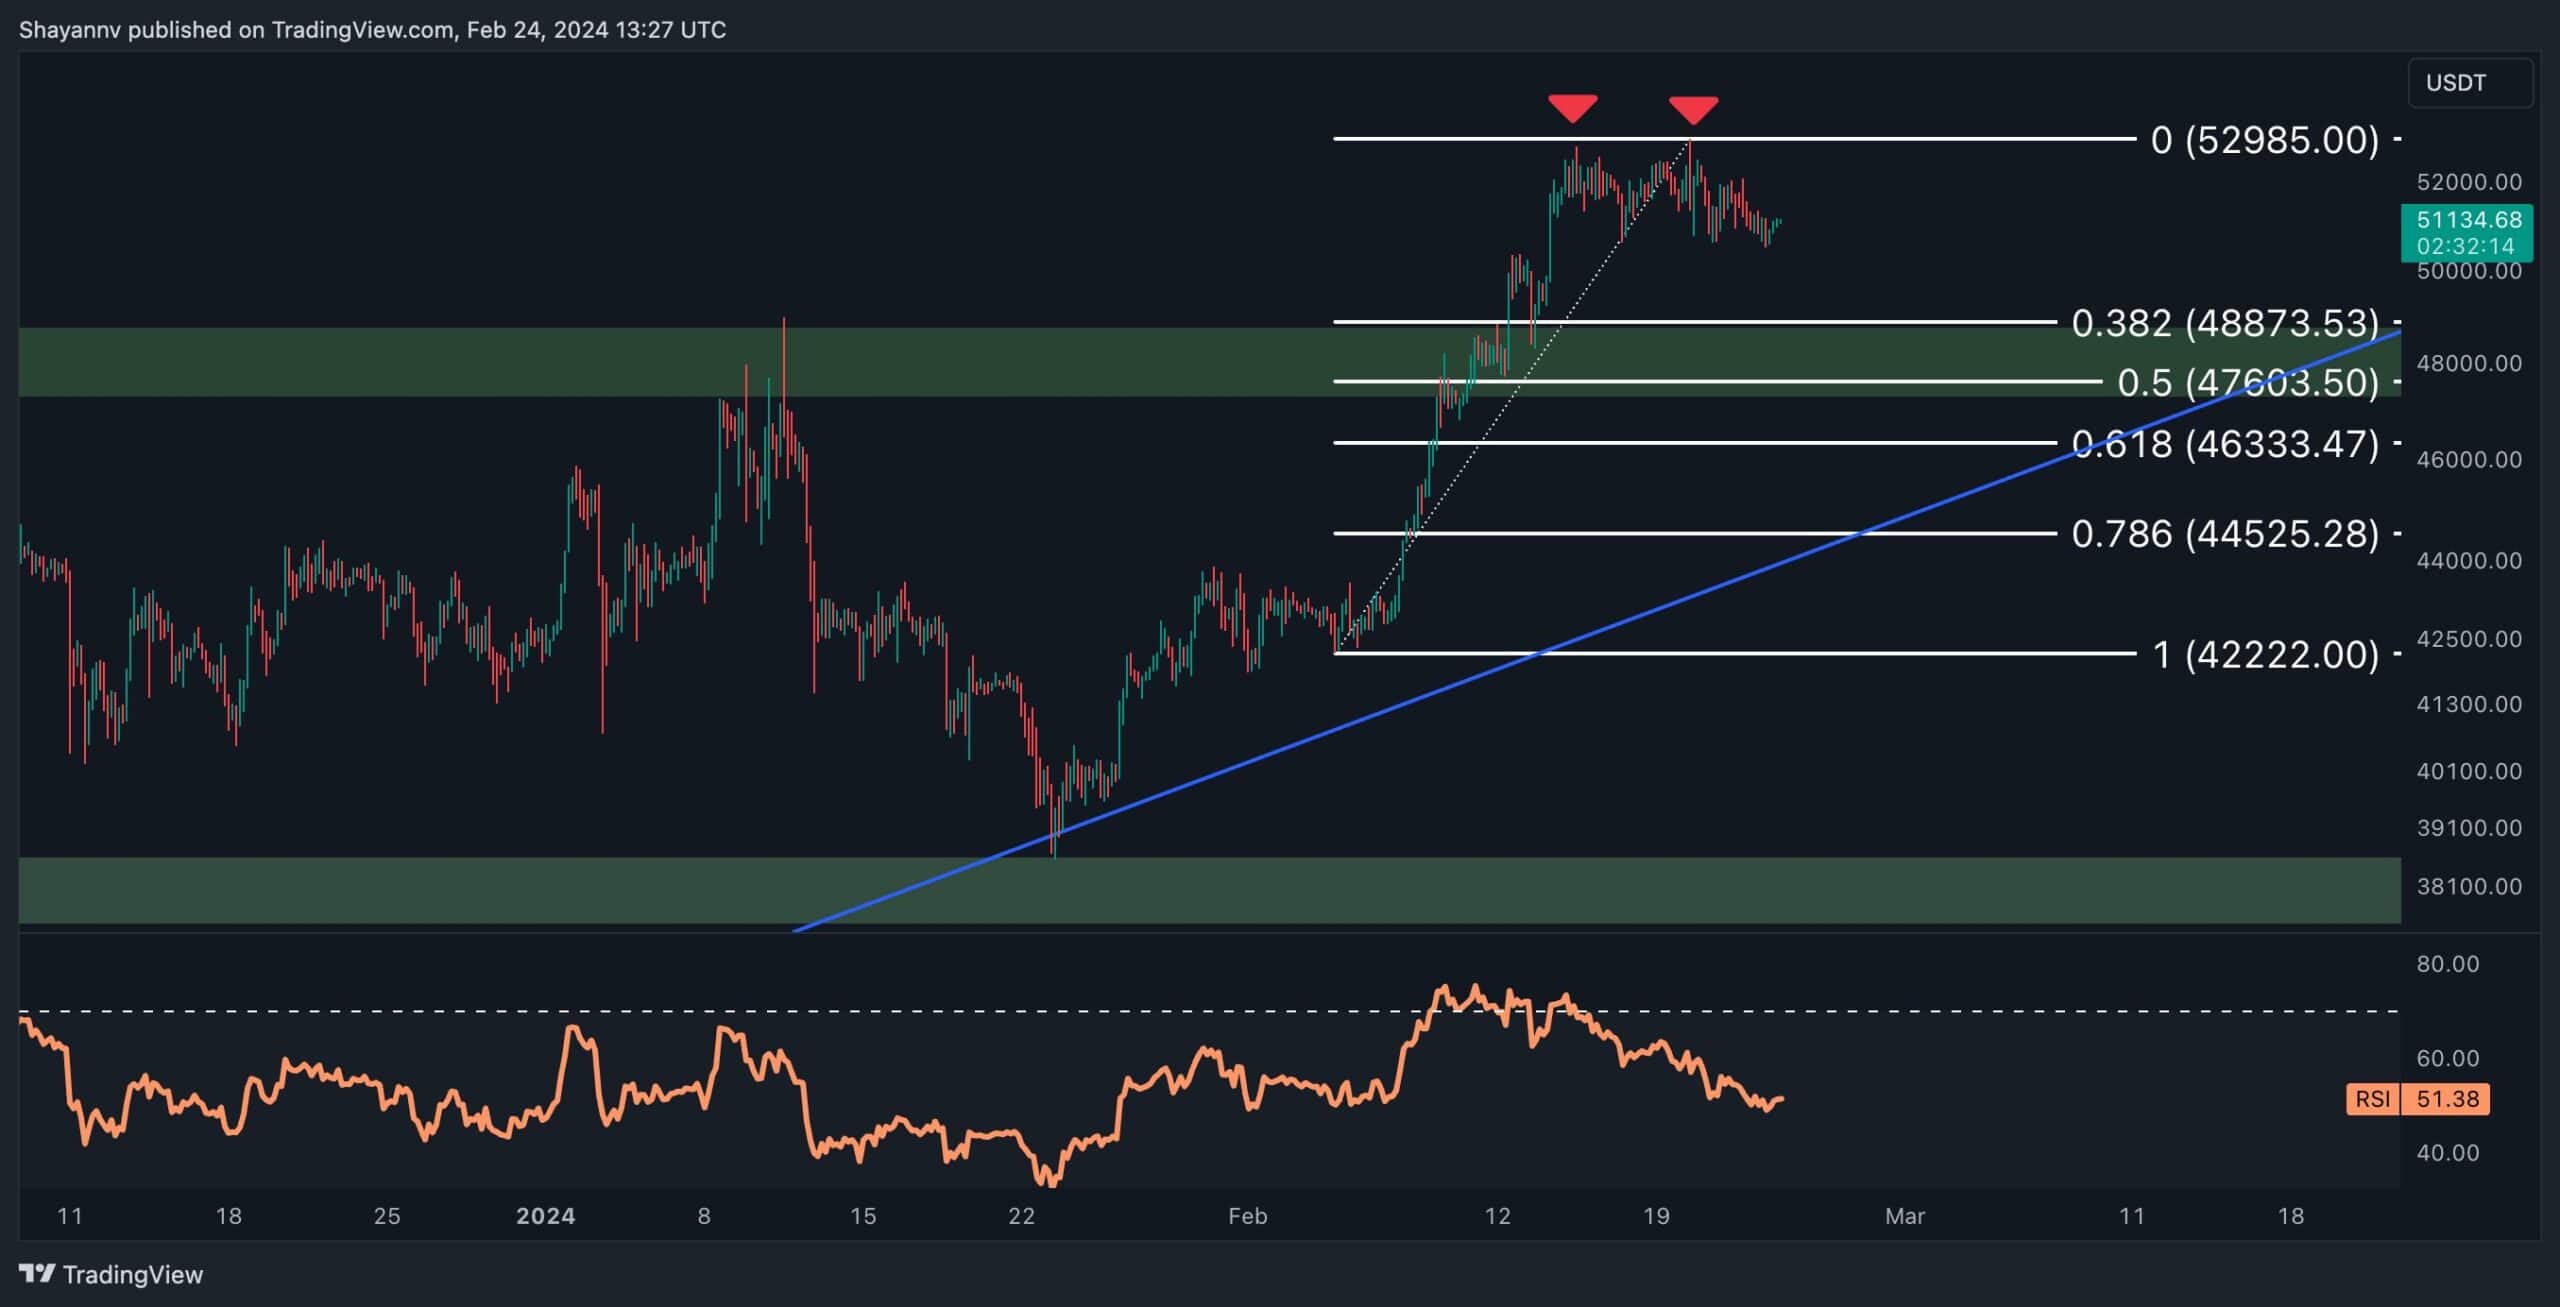
A closer look at the 4-hour chart reveals a period of subdued price action near the significant $52K resistance level, with low volatility following a strong bullish rally.
This consolidation phase with slight volatility suggests a balance between buyers and sellers until one group gains dominance. If sellers take control, a short-term corrective retracement toward the critical support zone around $48K may occur, aligning roughly with the 50% Fibonacci retracement level.
Conversely, if buyers prevail, an impulsive surge could be expected, aiming to breach the critical resistance region at $58K. Monitoring these crucial levels and market dynamics will be essential to navigate potential fluctuations, given the anticipated heightened volatility in the short term.
On-chain Analysis
By Shayan
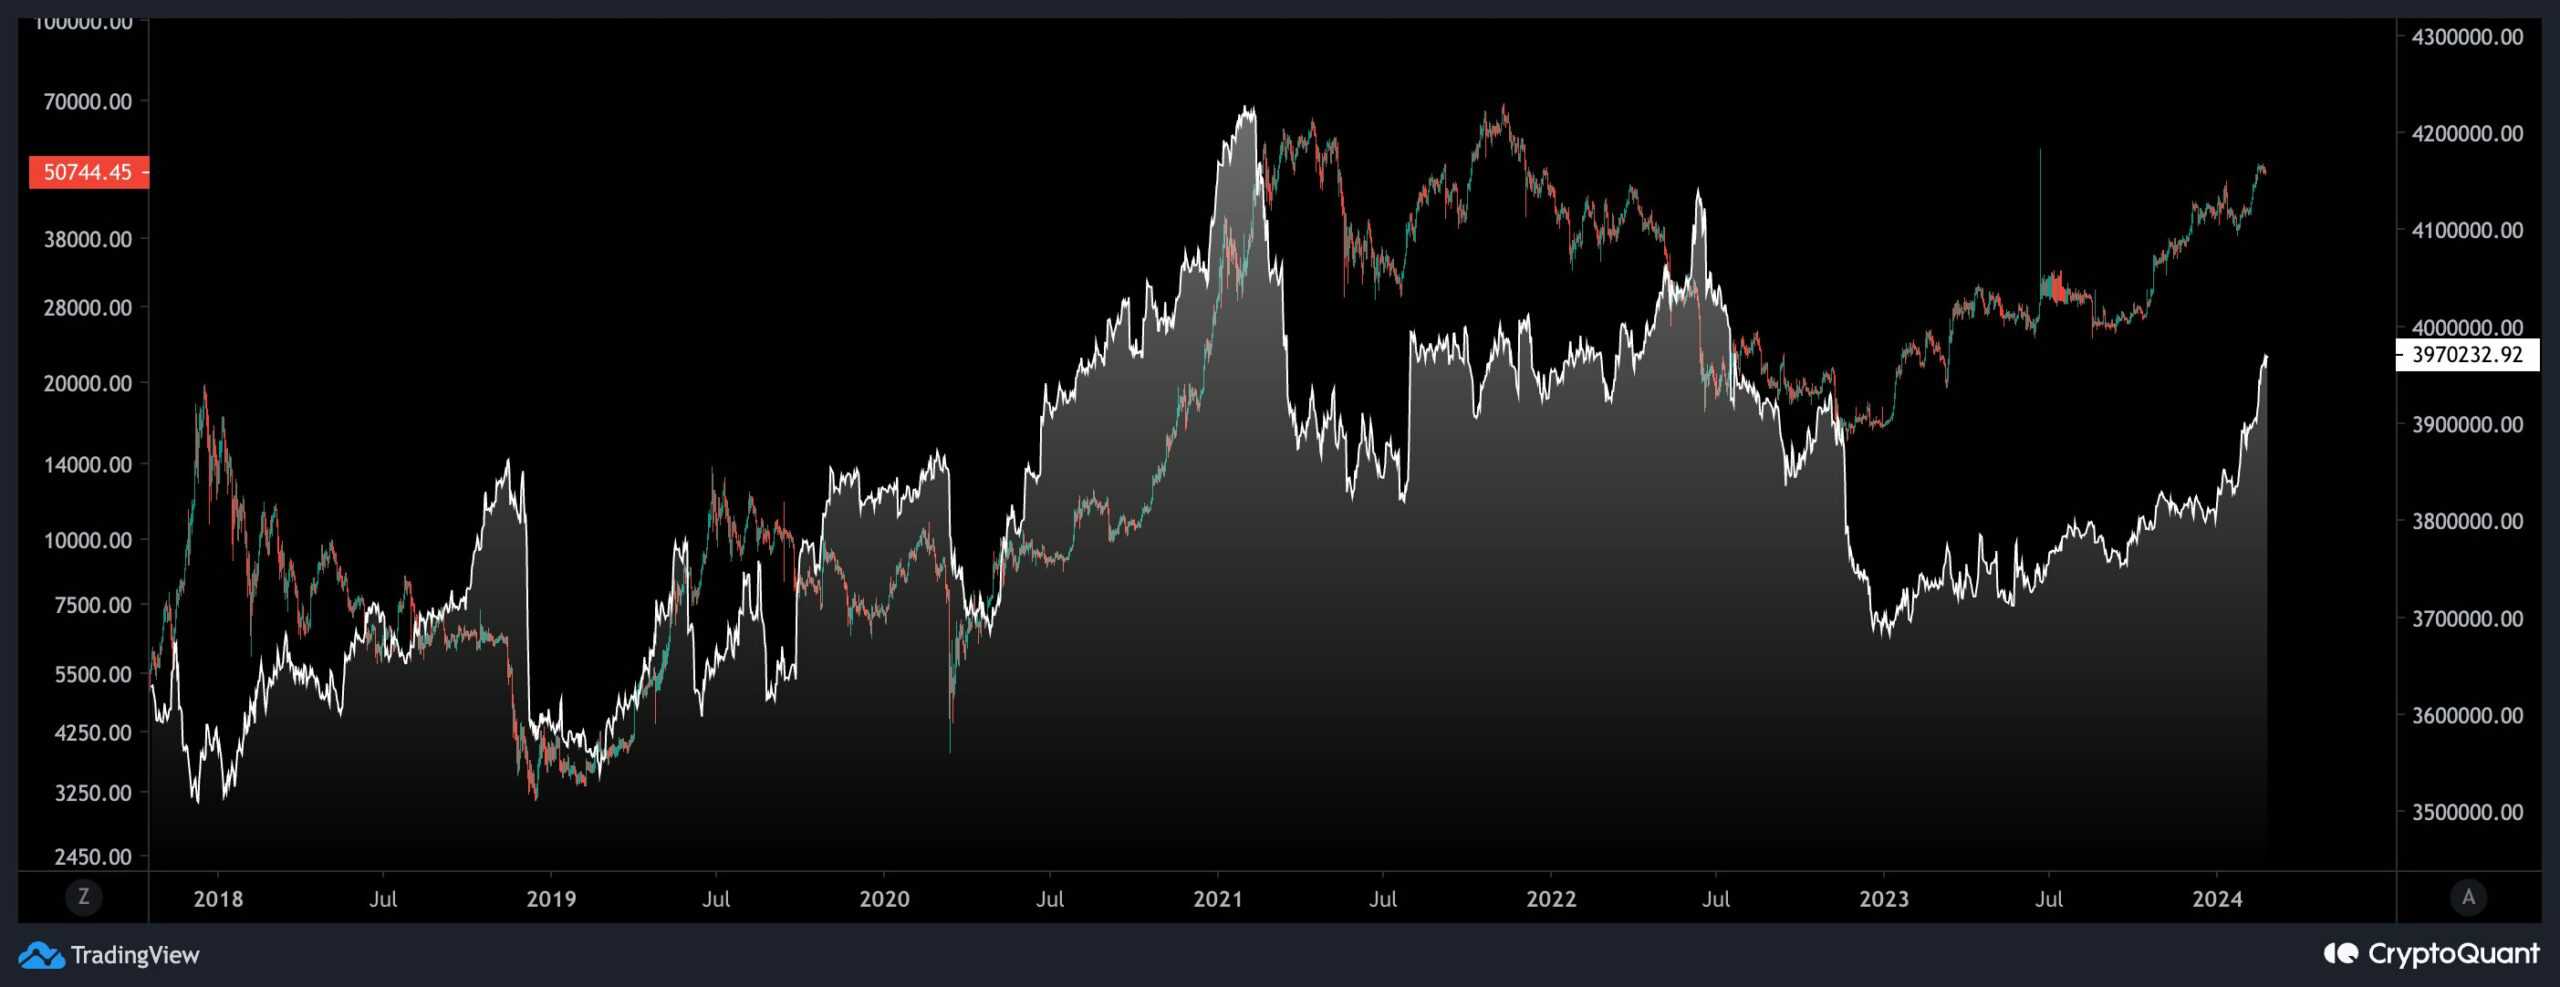
This chart depicts the UTXO (Unspent Transaction Output) value bands, specifically focusing on holdings of between 1K and 10K Bitcoins alongside Bitcoin’s price. This metric serves as a key indicator of big players’ accumulation or distribution behavior within the market.
An uptick in the metric signals accumulation among significant market participants, such as whales or institutional investors, while a decline suggests distribution. Recent data reveals a notable increase in the number of UTXOs ranging from 1K to 10K Bitcoins, a range typically associated with whales or institutions rather than individual investors. This surge, particularly following the approval of Bitcoin spot ETFs, underscores heightened activity among institutional players.
While not yet reaching the levels seen during the latter stages of the 2021 bull market, the influx of whales and institutions into the market is noteworthy. Historically, such influxes have often preceded the entry of new individual investors, marking a potential transition point in the market cycle.