Bitcoin’s price has recently recovered from a month of bearish price action. Considering the current upward momentum, the market might even make a new all-time high soon. Technical Analysis By TradingRage The Daily Chart On the daily chart, the price has found support at the K support level. The 200-day moving average, located around the K area, has also been reclaimed, along with the K level itself. Yet, the market is struggling to break above the K resistance level, as it has failed in the last three days. Meanwhile, with the RSI showing a clear bullish momentum, it could only be a matter of time before BTC trades above the K mark again. This scenario would fail if the price drops below K again. Source: TradingViewThe 4-Hour Chart Looking at the 4-hour
Topics:
CryptoVizArt considers the following as important: Bitcoin (BTC) Price, BTC Analysis, BTCEUR, BTCGBP, btcusd, btcusdt
This could be interesting, too:
Chayanika Deka writes XRP, SOL, and ADA Inclusion in US Crypto Reserve Pushes Traders on Edge
Chayanika Deka writes Why Arthur Hayes Is Bullish on Bitcoin Under Trump’s Economic Strategy
Mandy Williams writes Why the Bitcoin Market Is Stuck—and the Key Metric That Could Change It: CryptoQuant CEO
Wayne Jones writes Metaplanet Acquires 156 BTC, Bringing Total Holdings to 2,391
Bitcoin’s price has recently recovered from a month of bearish price action. Considering the current upward momentum, the market might even make a new all-time high soon.
Technical Analysis
By TradingRage
The Daily Chart
On the daily chart, the price has found support at the $56K support level. The 200-day moving average, located around the $60K area, has also been reclaimed, along with the $60K level itself.
Yet, the market is struggling to break above the $65K resistance level, as it has failed in the last three days. Meanwhile, with the RSI showing a clear bullish momentum, it could only be a matter of time before BTC trades above the $70K mark again. This scenario would fail if the price drops below $60K again.

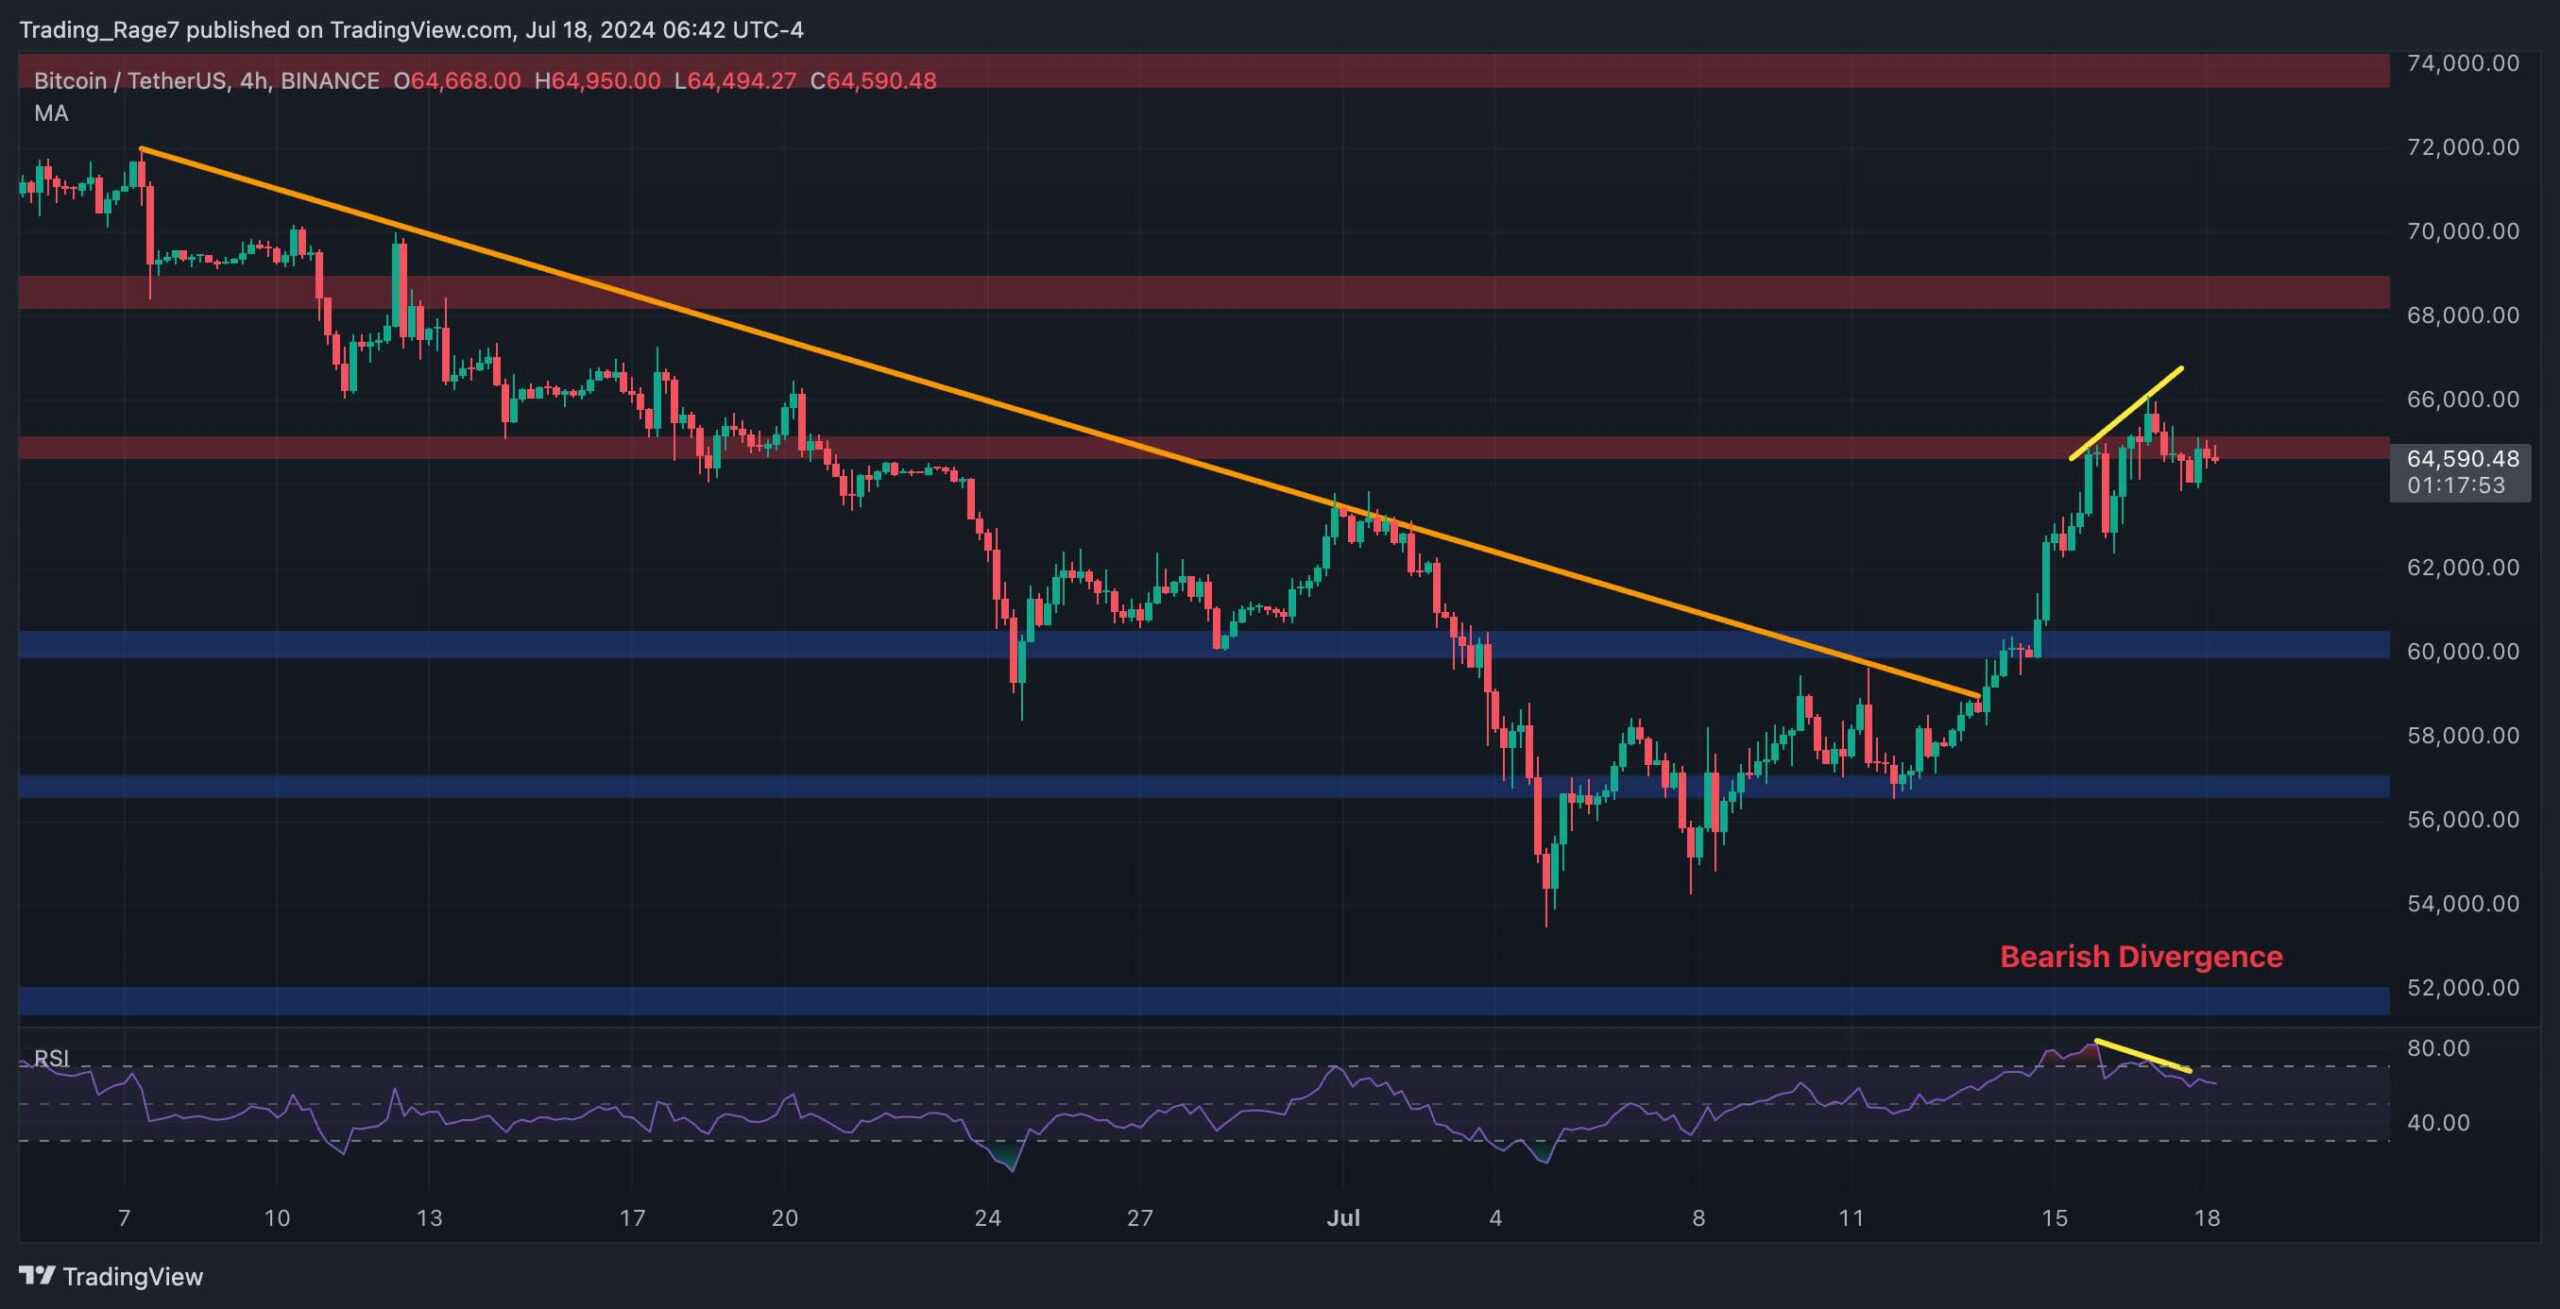
The 4-Hour Chart
Looking at the 4-hour timeframe, the market has begun an impulsive rally since breaking the bearish trendline to the upside. Yet, the attempts so far have been unsuccessful in getting past the $65K level, and a correction cannot be ruled out.
Moreover, the Relative Strength Index also shows a clear bearish divergence and overbought signal, which could induce a decline toward the $60K level. Yet, the overall market structure is still bullish in the short term.
On-Chain Analysis
By TradingRage
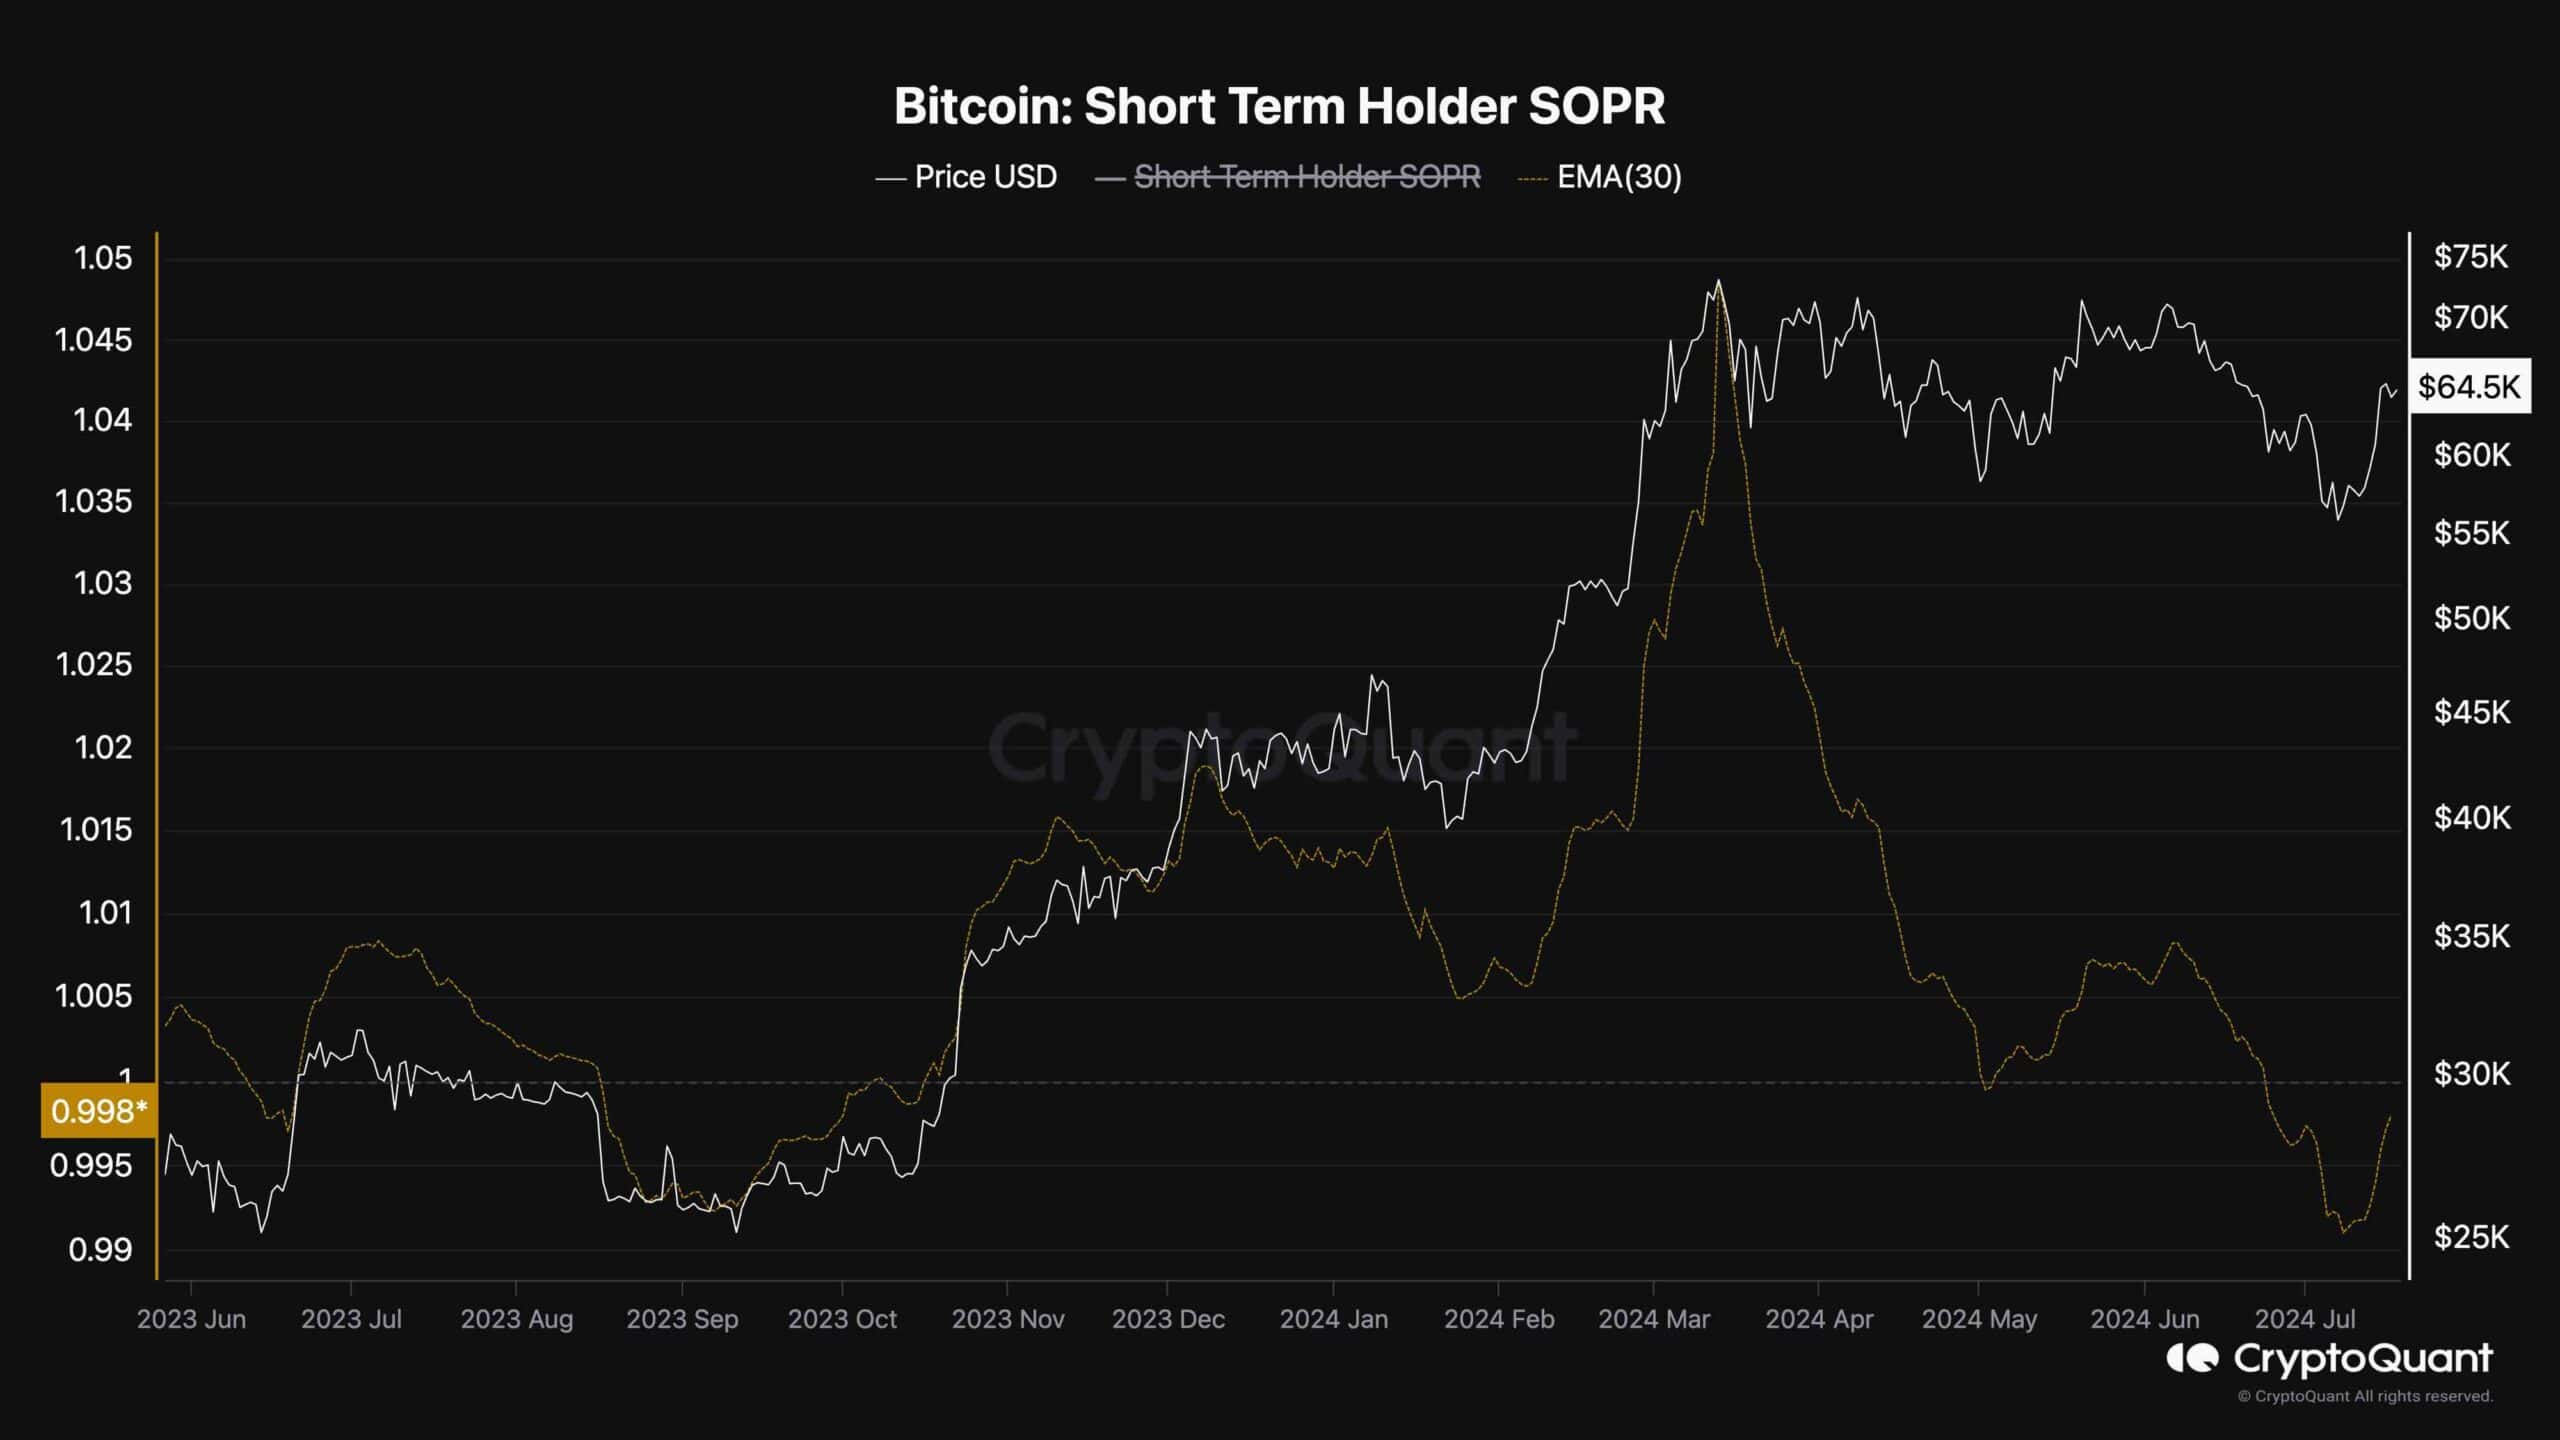
Bitcoin Short-Term Holder SOPR
The buying and selling behavior of short-term BTC holders is one of the key factors that shape the price action in the near term. Therefore, analyzing the Bitcoin Short-Term Holder SOPR metric can be beneficial in predicting price action in the upcoming weeks.
The Short-Term Holder SOPR metric, demonstrated in the chart above, determines whether the holders holding their coins for less than 6 months are realizing profits or losses. Values above 1 indicate selling at a profit, while values below 1 show loss realization.
As the chart displays, the 30-day exponential moving average of the STH SOPR has been below 1 lately, indicating that the short-term holders are selling their coins at a loss. This is a typical signal for correction bottoms during a long-term bull market. So, if the metric recovers above 1, the price will likely rally higher and create a new record high in the coming weeks.