Bitcoin’s price is currently at a critical level, and its reaction will likely determine the mid-term trend of the entire crypto market. Technical Analysis By Edris Derakhshi (TradingRage) The Daily Chart On the daily chart, the asset has been rallying since it rebounded from the K support level and has broken both the K and K levels to the upside with momentum. However, the market has finally reached the 200-day moving average, which coincides with the key K resistance level. A bullish breakout could lead to a new surge toward higher prices. Meanwhile, if the cryptocurrency gets rejected to the downside, the K level would likely support pushing it back higher. The 4-Hour Chart The 4-hour chart demonstrates a tricky situation for the BTC price, as it is
Topics:
CryptoVizArt considers the following as important: Bitcoin (BTC) Price, BTC Analysis, BTCEUR, BTCGBP, btcusd, btcusdt
This could be interesting, too:
Chayanika Deka writes XRP, SOL, and ADA Inclusion in US Crypto Reserve Pushes Traders on Edge
Chayanika Deka writes Why Arthur Hayes Is Bullish on Bitcoin Under Trump’s Economic Strategy
Mandy Williams writes Why the Bitcoin Market Is Stuck—and the Key Metric That Could Change It: CryptoQuant CEO
Wayne Jones writes Metaplanet Acquires 156 BTC, Bringing Total Holdings to 2,391
Bitcoin’s price is currently at a critical level, and its reaction will likely determine the mid-term trend of the entire crypto market.
Technical Analysis
By Edris Derakhshi (TradingRage)
The Daily Chart
On the daily chart, the asset has been rallying since it rebounded from the $52K support level and has broken both the $56K and $60K levels to the upside with momentum. However, the market has finally reached the 200-day moving average, which coincides with the key $64K resistance level.
A bullish breakout could lead to a new surge toward higher prices. Meanwhile, if the cryptocurrency gets rejected to the downside, the $60K level would likely support pushing it back higher.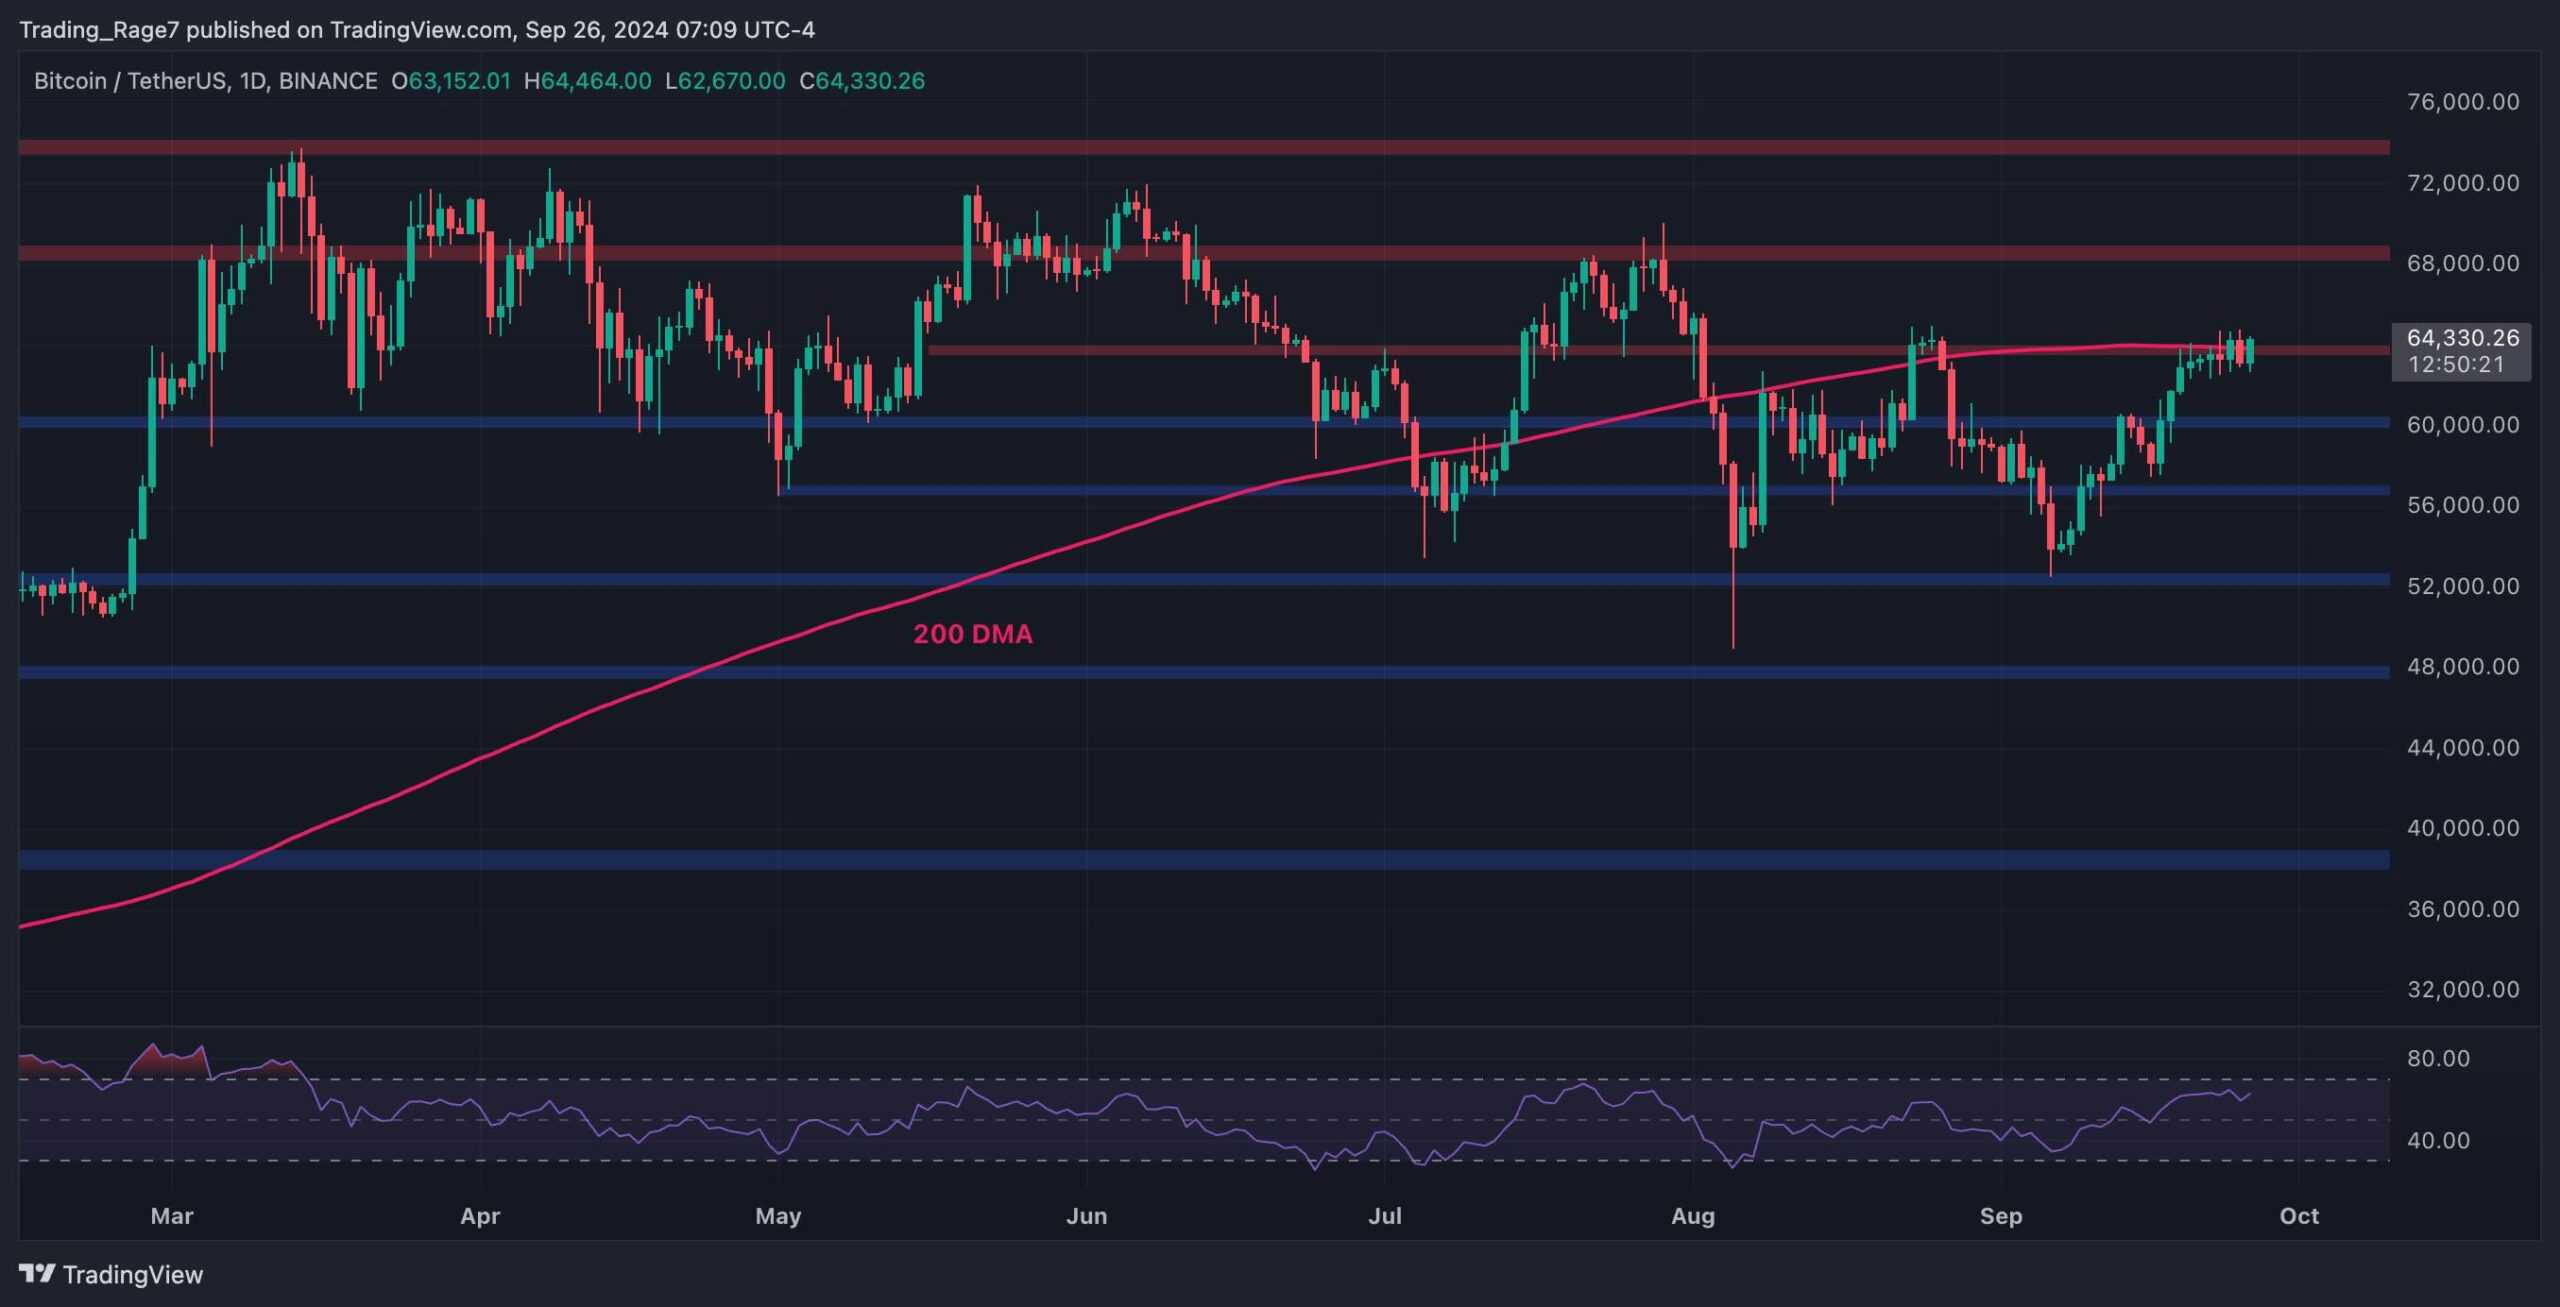
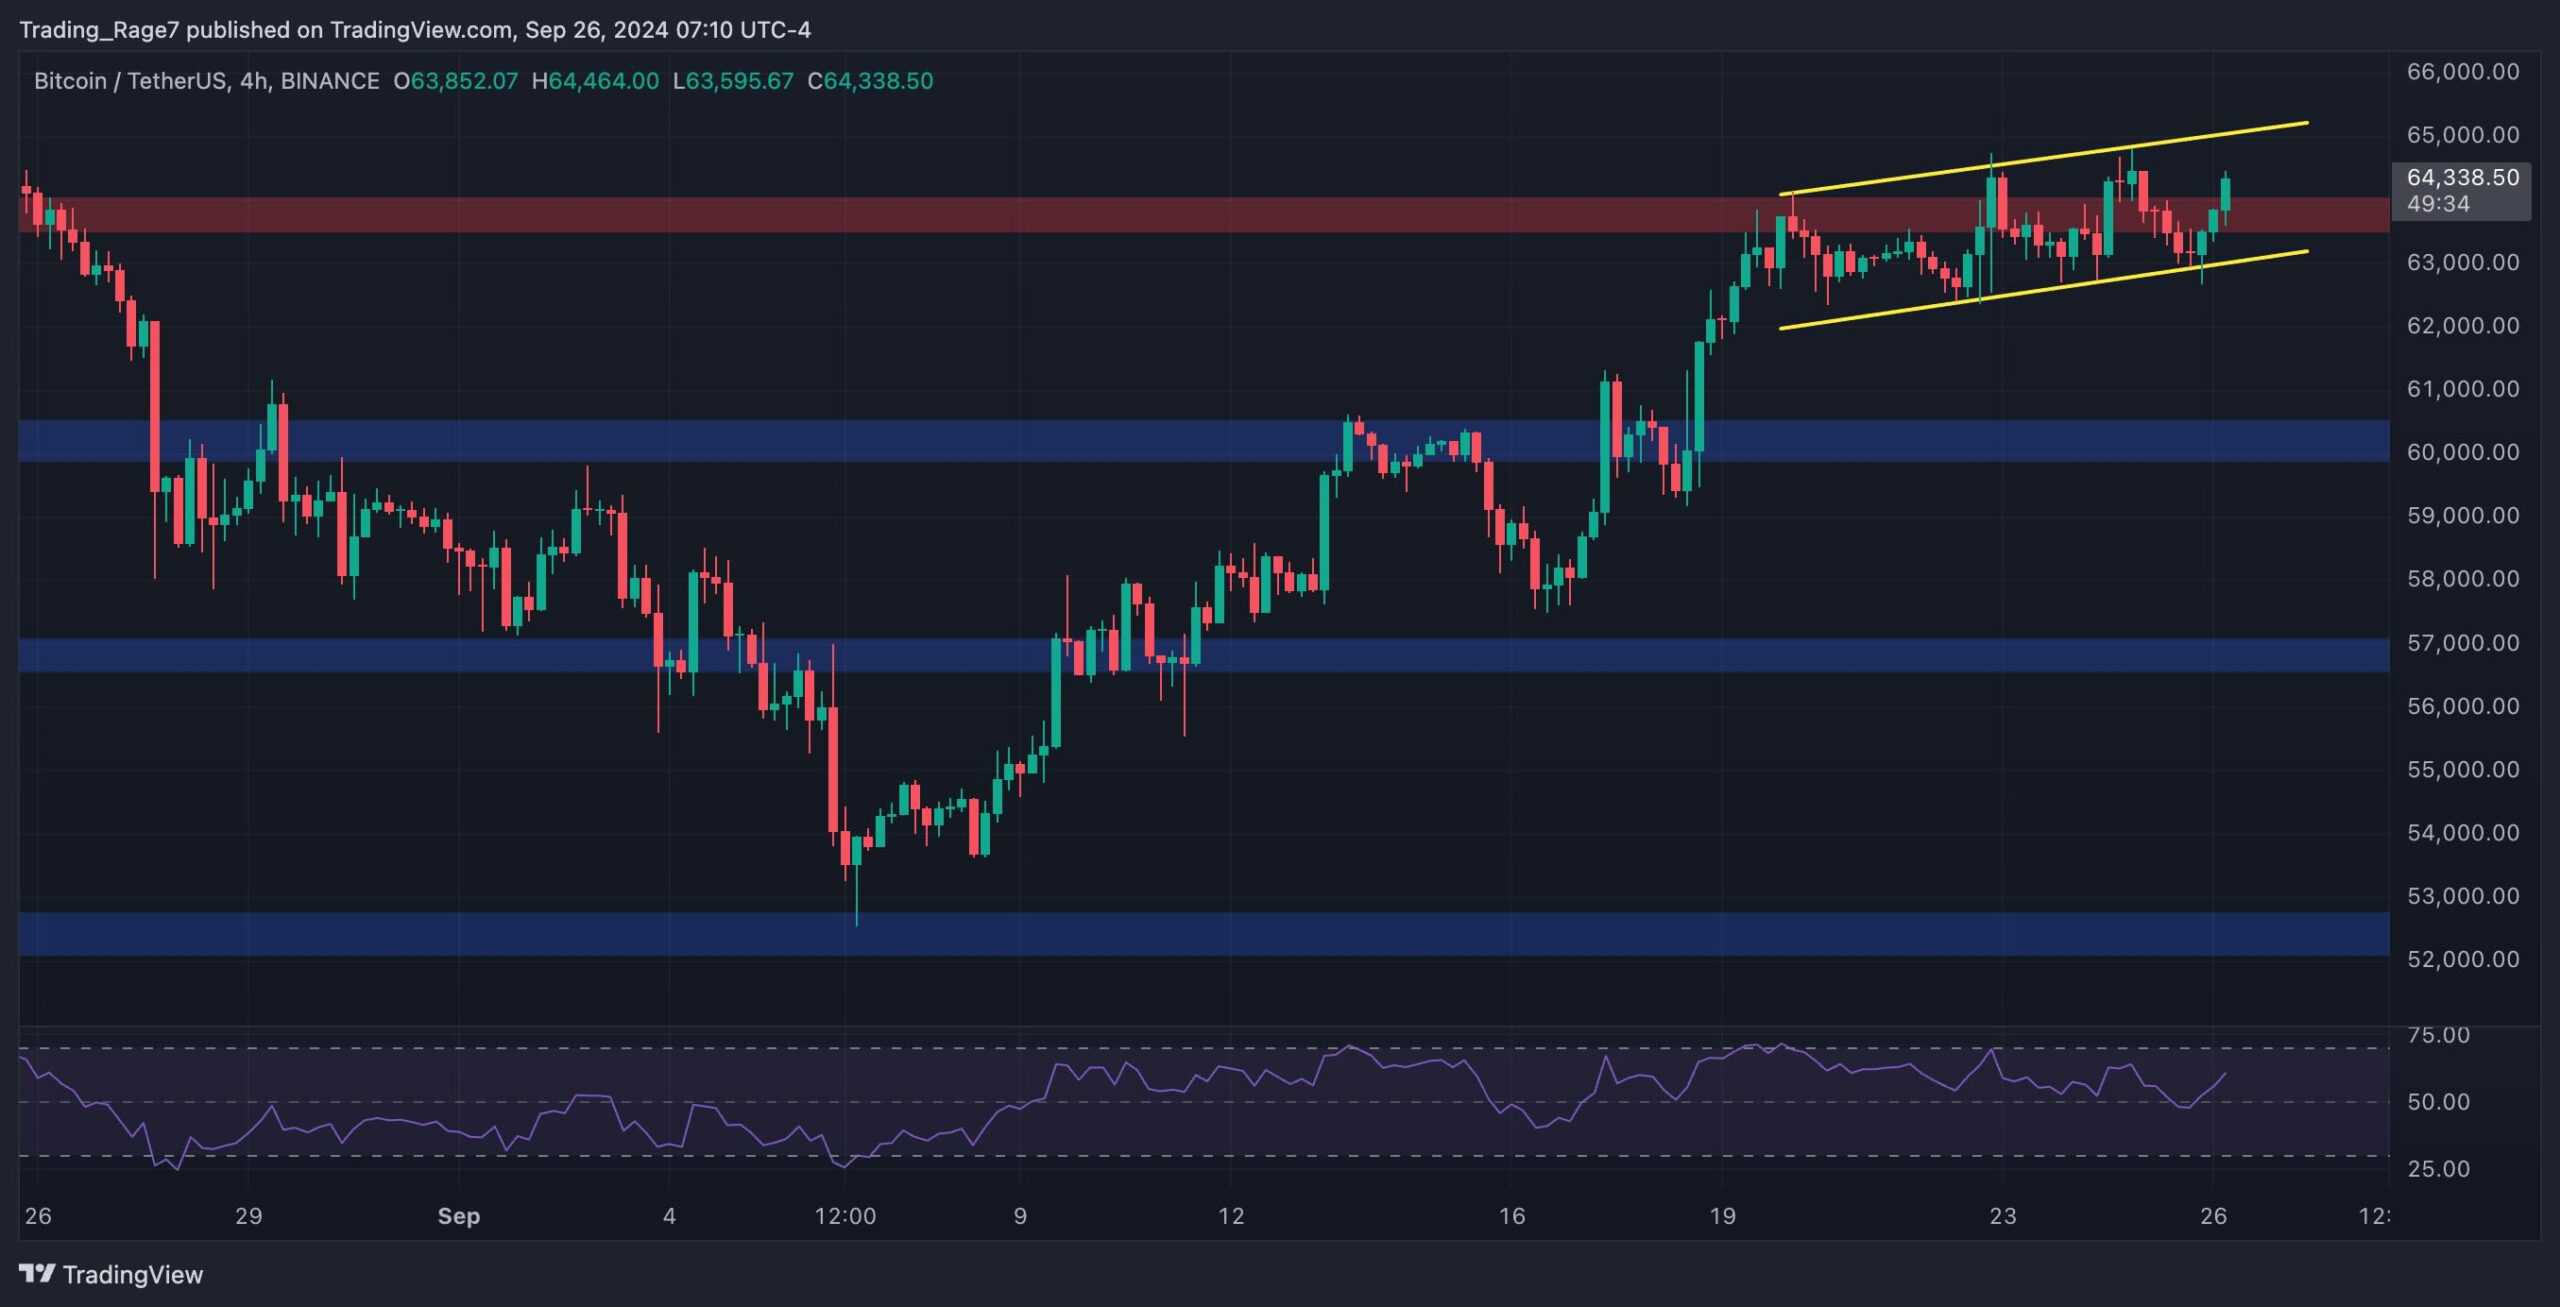
The 4-Hour Chart
The 4-hour chart demonstrates a tricky situation for the BTC price, as it is currently consolidating in a small descending channel at the $64K level.
If it gets broken to the downside, this becomes a classical bearish reversal price action pattern. Meanwhile, if the asset breaks higher, the pattern would fail, and a rapid rally toward the $70K area would be expected. With the RSI also showing values above 50%, the momentum still favors a bullish continuation.
On-Chain Analysis
By Edris Derakhshi (TradingRage)
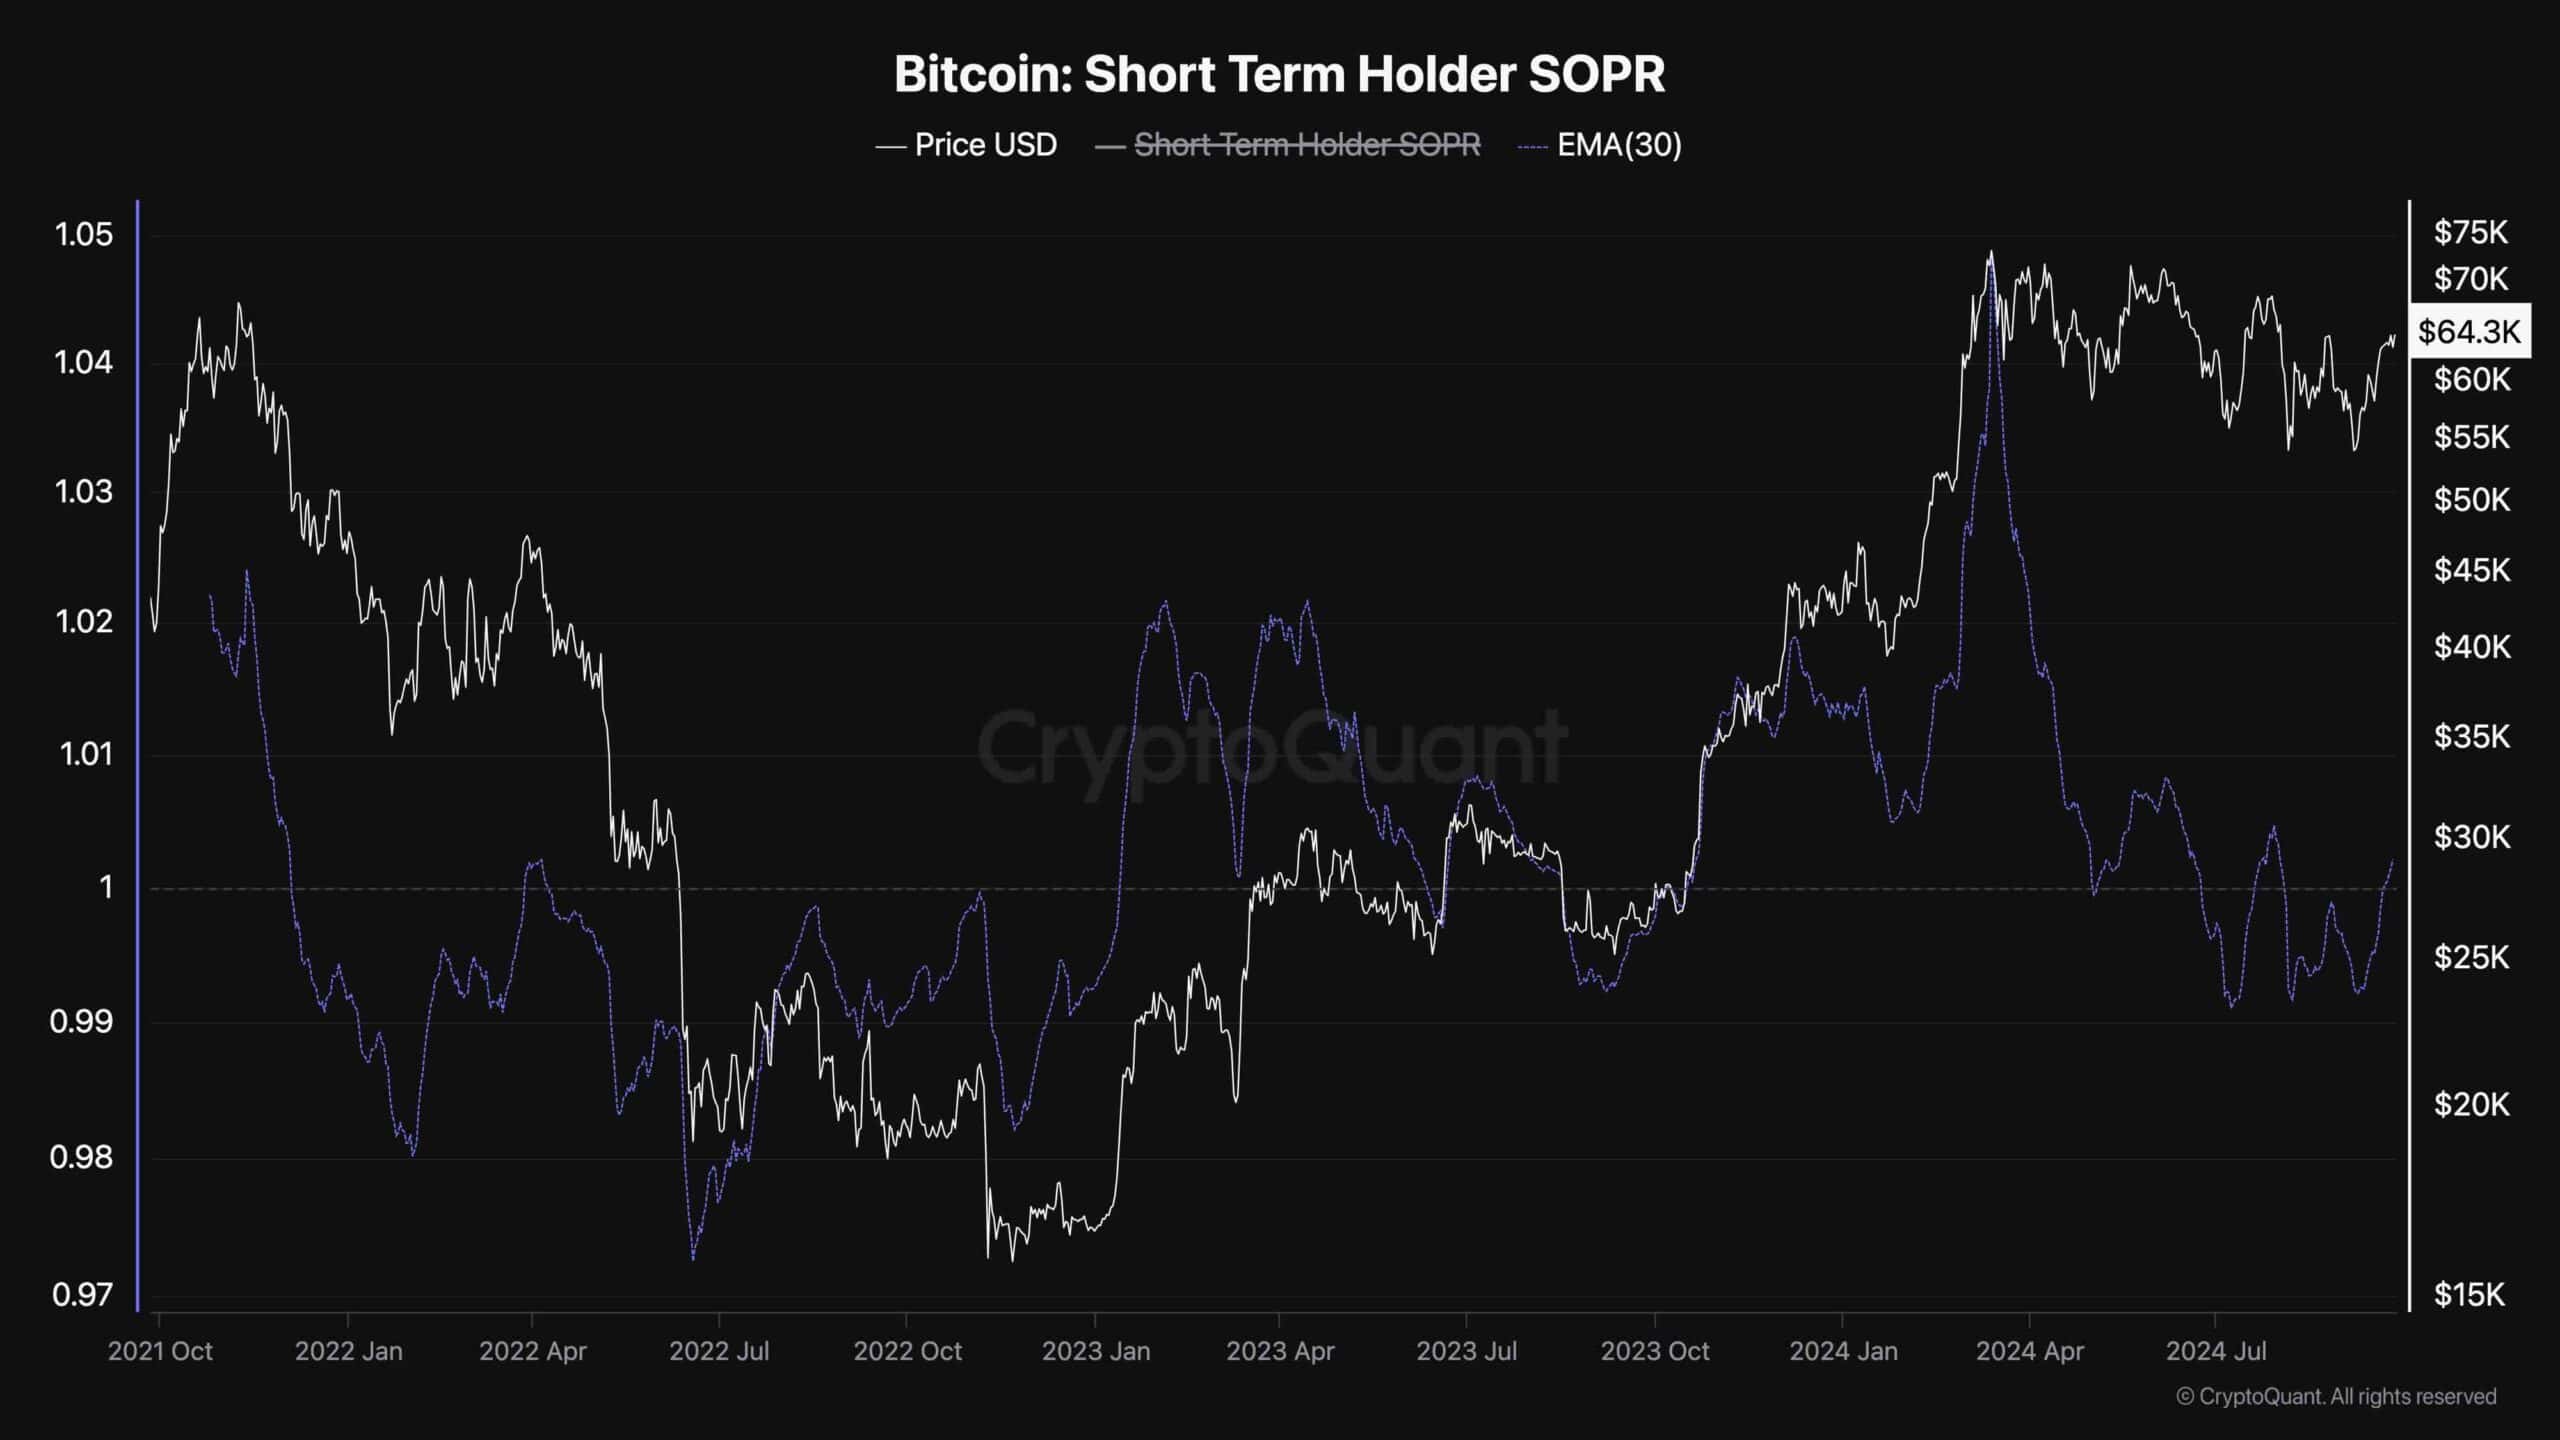
Bitcoin Short-Term Holder SOPR
During the recent Bitcoin price consolidation and gradual correction, many short-term holders have panicked and sold their holdings, even those not in profit. This chart shows the Bitcoin Short-Term Holder SOPR, which measures the ratio of profits/losses realized by short-term investors.
As the chart suggests, the STH SOPR made a new record high when the price hit $70K first, but it has rapidly declined during the past few months. Short-term holders have even realized losses since July, as the metric has dropped below one. However, with the recent price rally, these investors are now realizing profits again.
While this is a natural behavior in bull markets, if the selling pressure resulting from this profit-taking is not met with sufficient demand, the market could be overwhelmed and drop lower again.