Bitcoin’s price is finally showing some promising signs of bullish continuation. The big question now is if the consolidation period is over or if this is just a temporary bounce. Technical Analysis By Edris Derakhshi (TradingRage) The Daily Chart On the daily chart, BTC has been consolidating below the 200-day moving average (around the K mark) for some time now. However, today’s price action suggests the consolidation period is over, as the daily candle has broken through the 200-day moving average and the K resistance level. If the daily candle closes above these resistance elements, investors can be optimistic that the market could rally toward the K level in the short term. Source: TradingViewThe 4-Hour Chart The 4-hour timeframe also shows a completely
Topics:
CryptoVizArt considers the following as important: Bitcoin (BTC) Price, BTC Analysis, BTCEUR, BTCGBP, btcusd, btcusdt
This could be interesting, too:
Chayanika Deka writes XRP, SOL, and ADA Inclusion in US Crypto Reserve Pushes Traders on Edge
Chayanika Deka writes Why Arthur Hayes Is Bullish on Bitcoin Under Trump’s Economic Strategy
Mandy Williams writes Why the Bitcoin Market Is Stuck—and the Key Metric That Could Change It: CryptoQuant CEO
Wayne Jones writes Metaplanet Acquires 156 BTC, Bringing Total Holdings to 2,391
Bitcoin’s price is finally showing some promising signs of bullish continuation. The big question now is if the consolidation period is over or if this is just a temporary bounce.
Technical Analysis
By Edris Derakhshi (TradingRage)
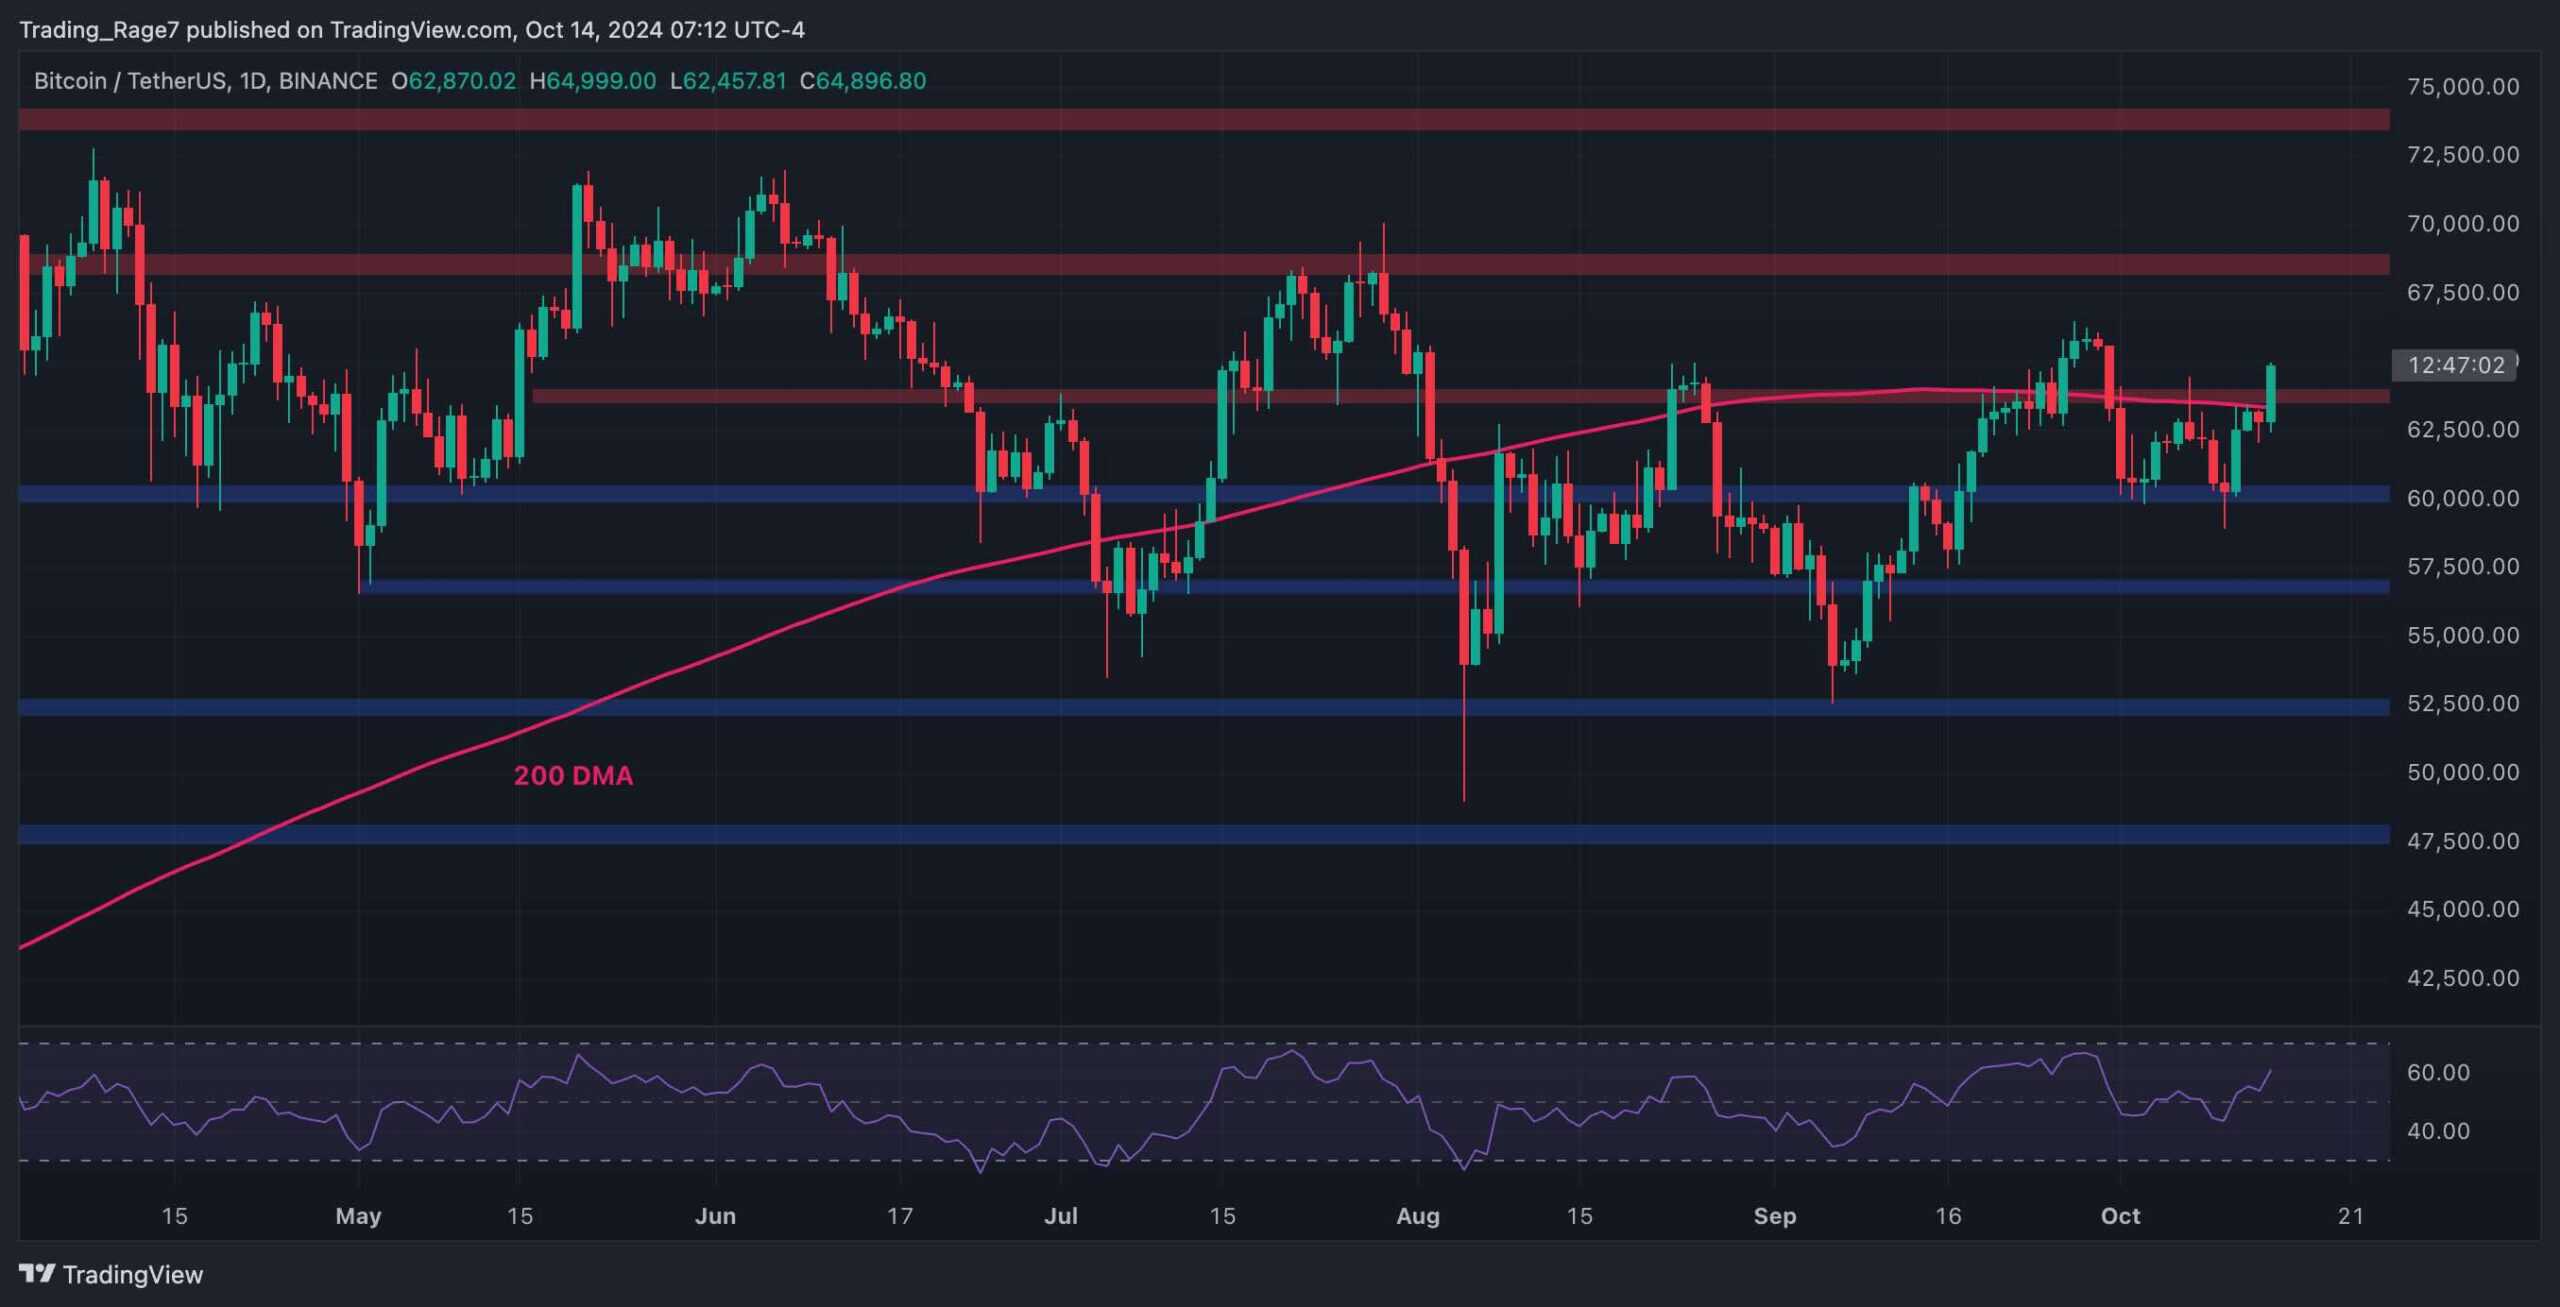
The Daily Chart
On the daily chart, BTC has been consolidating below the 200-day moving average (around the $64K mark) for some time now.
However, today’s price action suggests the consolidation period is over, as the daily candle has broken through the 200-day moving average and the $64K resistance level.
If the daily candle closes above these resistance elements, investors can be optimistic that the market could rally toward the $68K level in the short term.
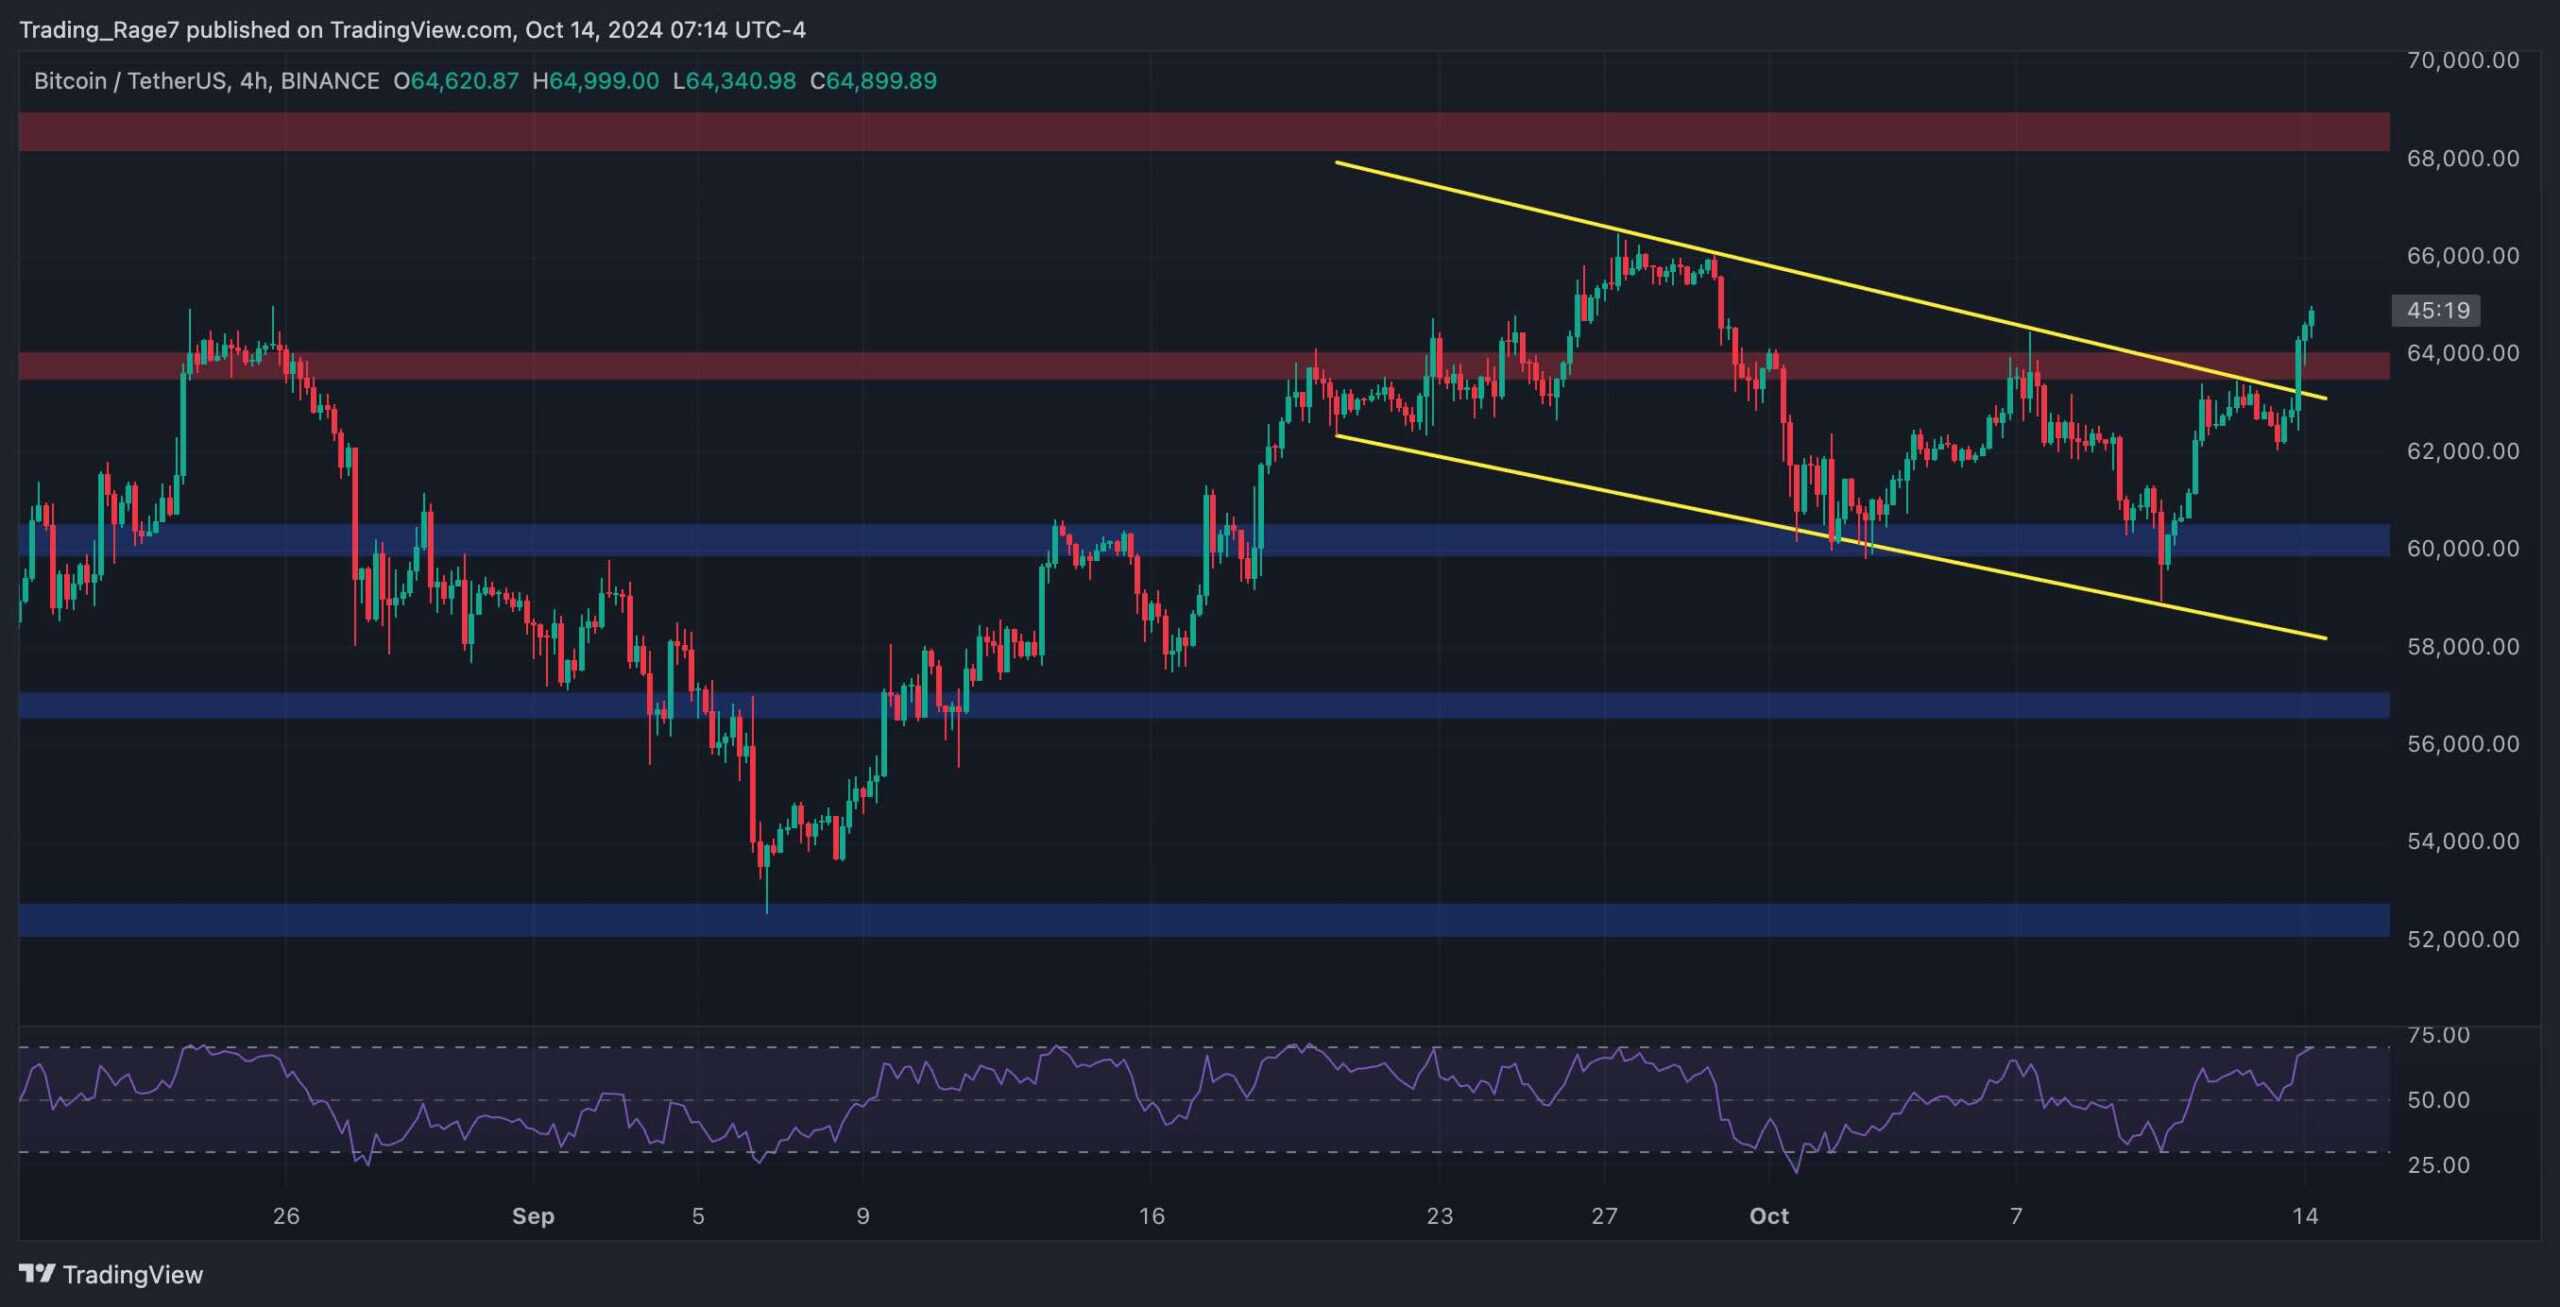
The 4-Hour Chart
The 4-hour timeframe also shows a completely bullish market structure. The price has finally broken the large bullish flag it has been trapped in for the last few weeks.
A breakout from a flag pattern is a clear continuation signal based on classical price action.
Therefore, if this breakout proves valid and the price holds above the $64K level, the $68K resistance zone would be a feasible target.
On-Chain Analysis
By Edris Derakhshi (TradingRage)
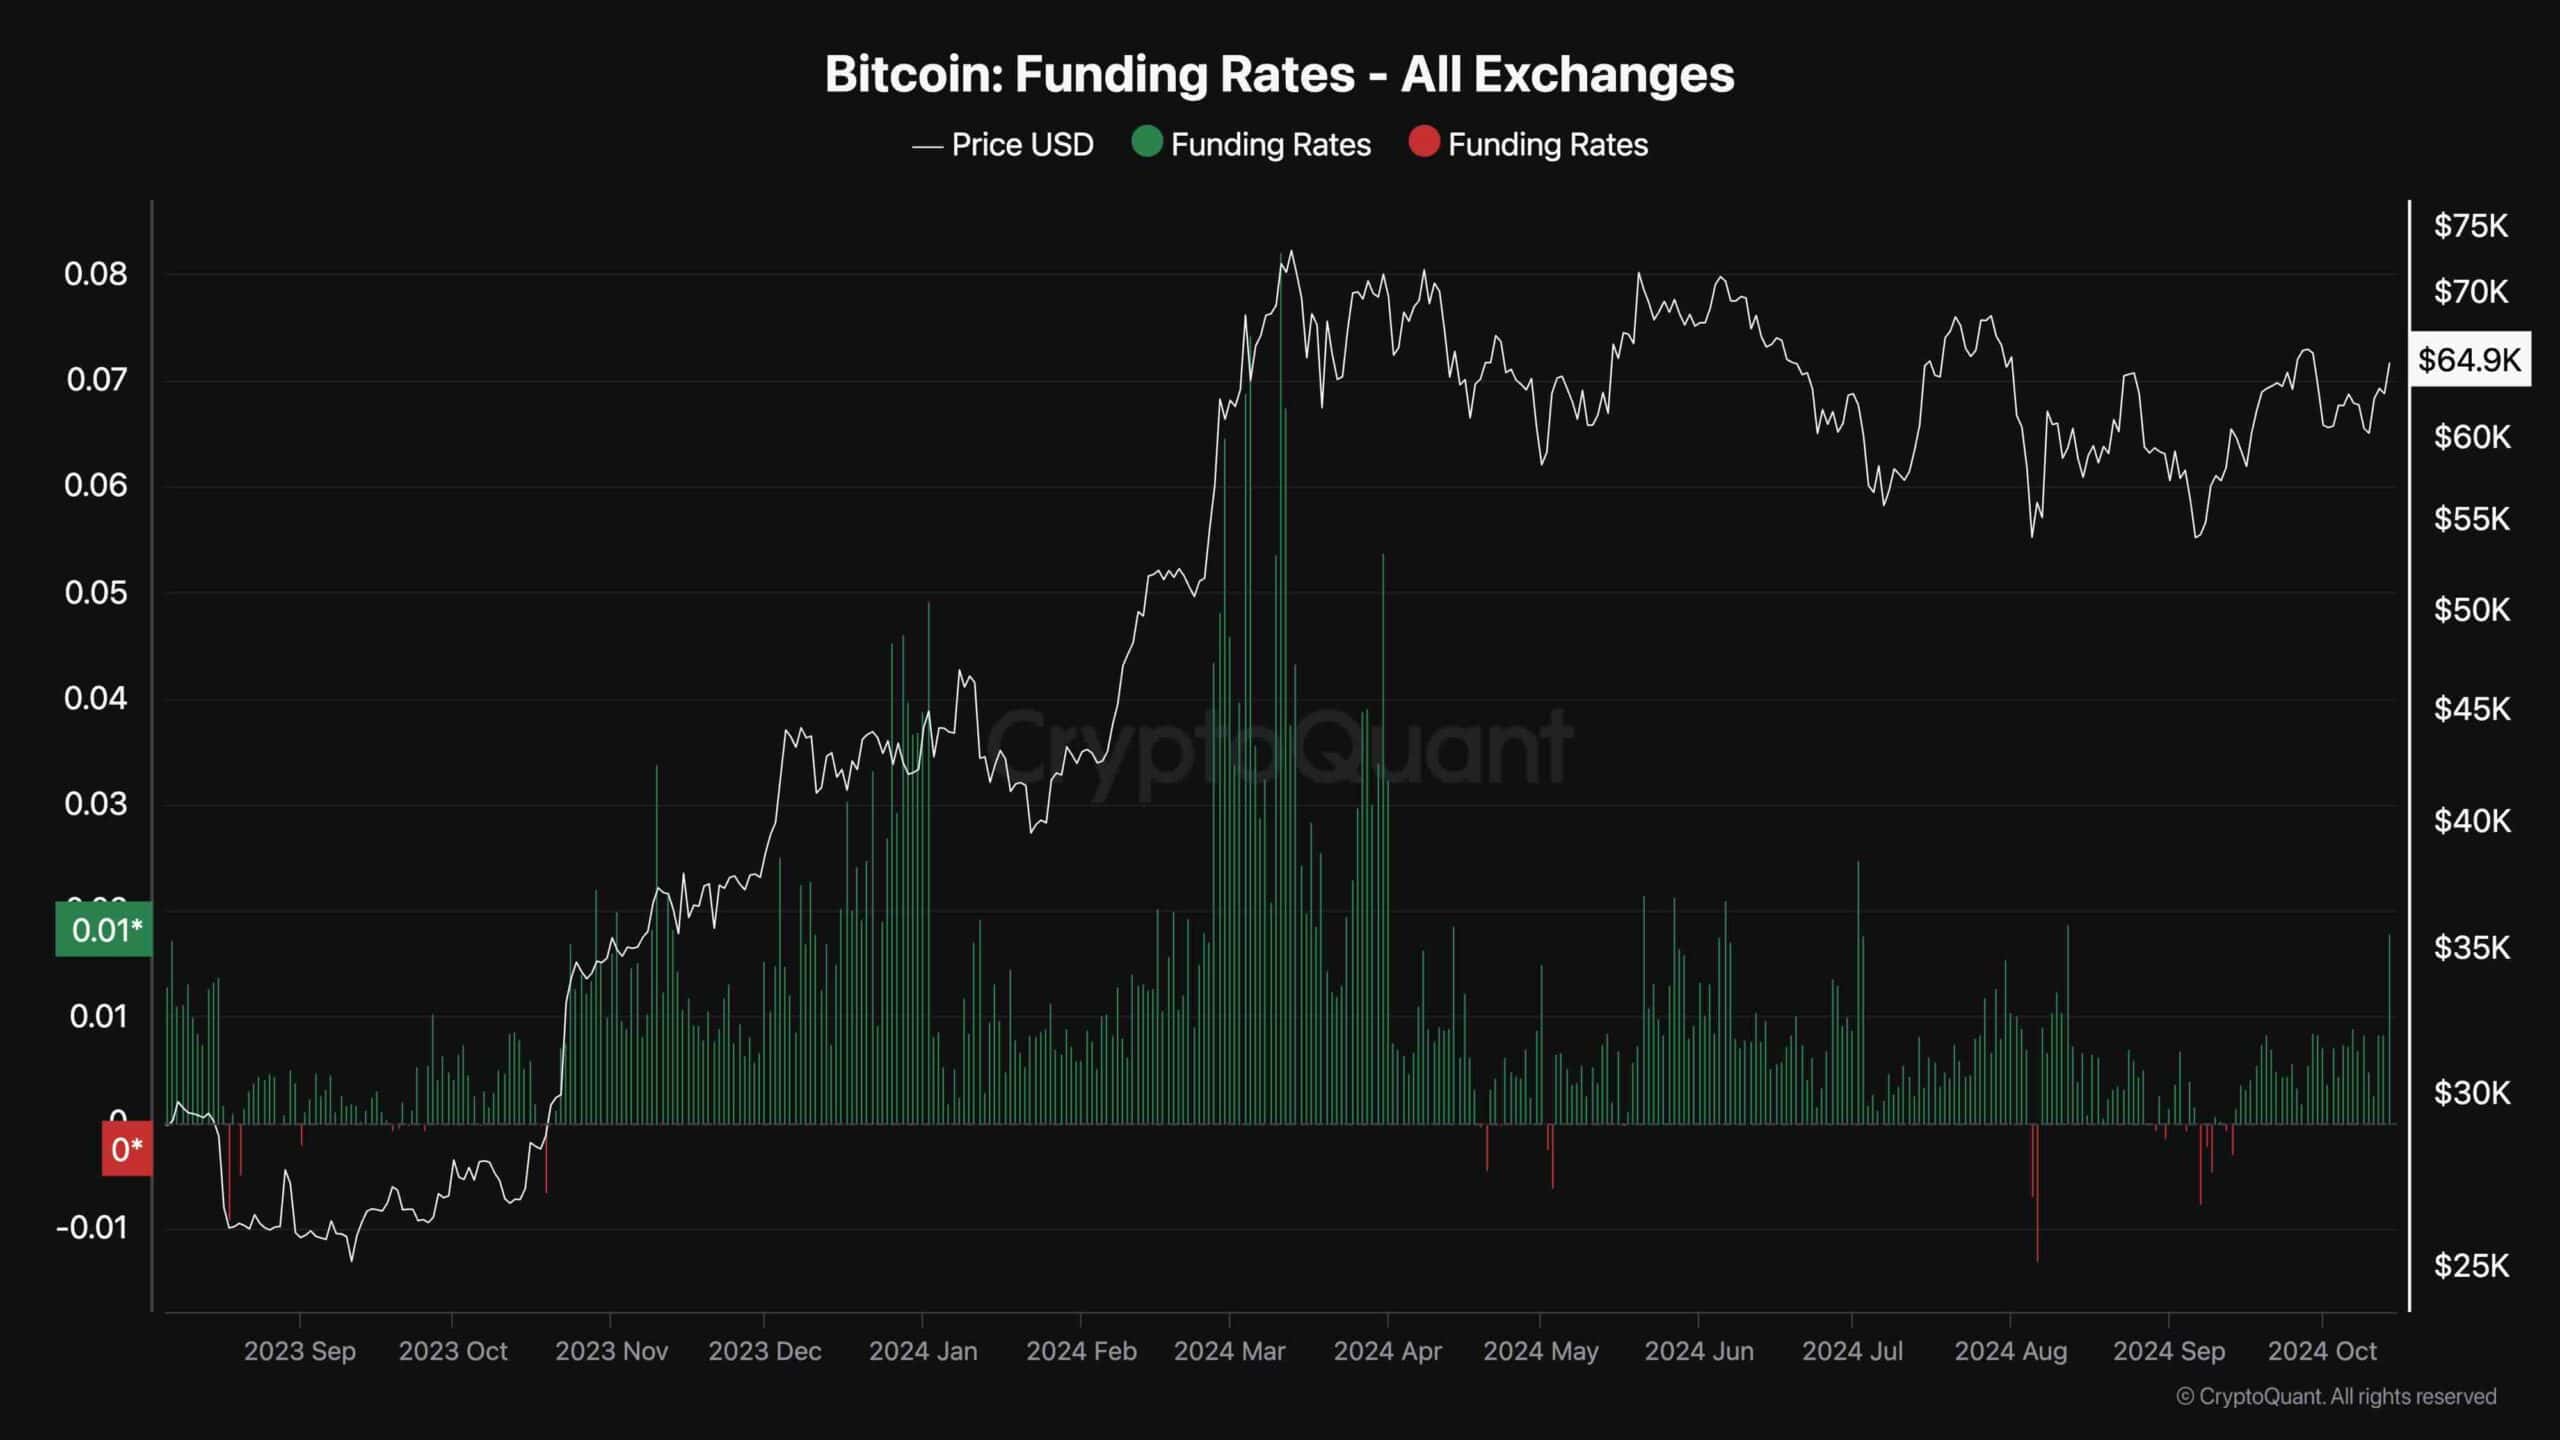
Bitcoin Funding Rates
While Bitcoin’s price finally shows some desire to continue its long-term bullish trend, the futures market sentiment also points to an increase in optimism by market participants.
This chart demonstrates the BTC funding rates metric, which measures whether buyers or sellers are executing their perpetual futures orders more aggressively. Positive values indicate bullish sentiment, while negative values are associated with bearish expectations.
As the chart suggests, funding rates spiked significantly today, as the market is on the verge of breaking above a key resistance level.
Yet, while it might seem natural, investors should still be cautious. A sudden surge in funding rates might lead to a long liquidation cascade, which could halt the market’s rally.