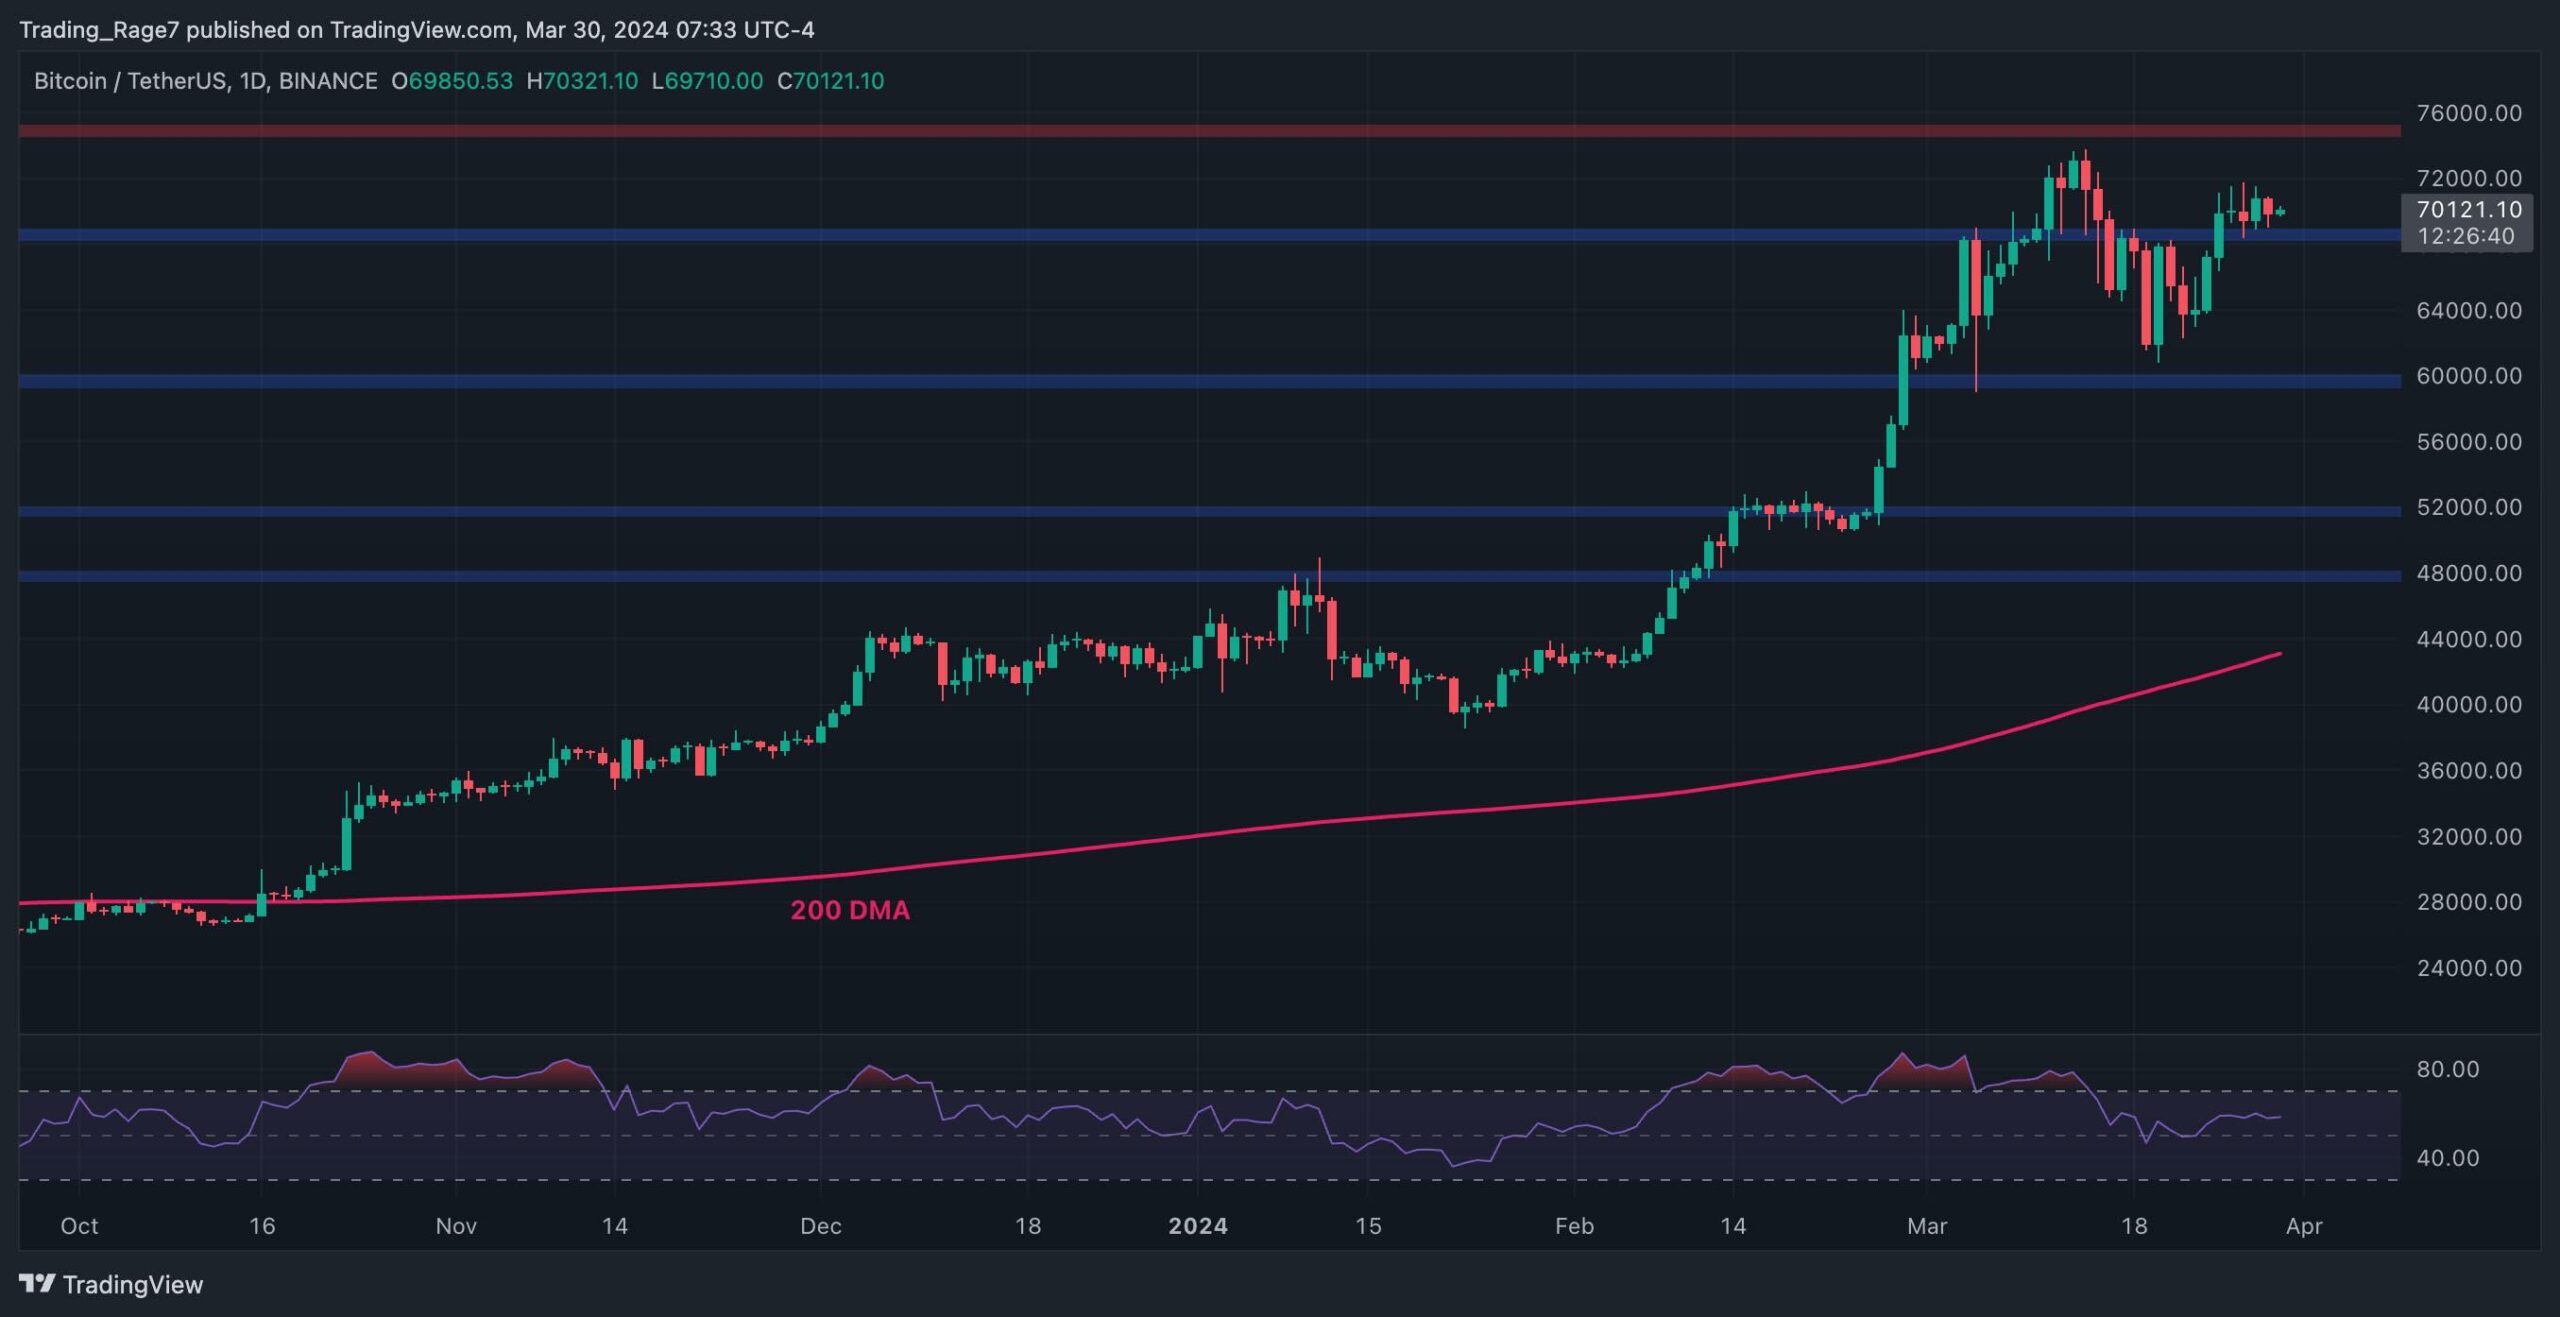
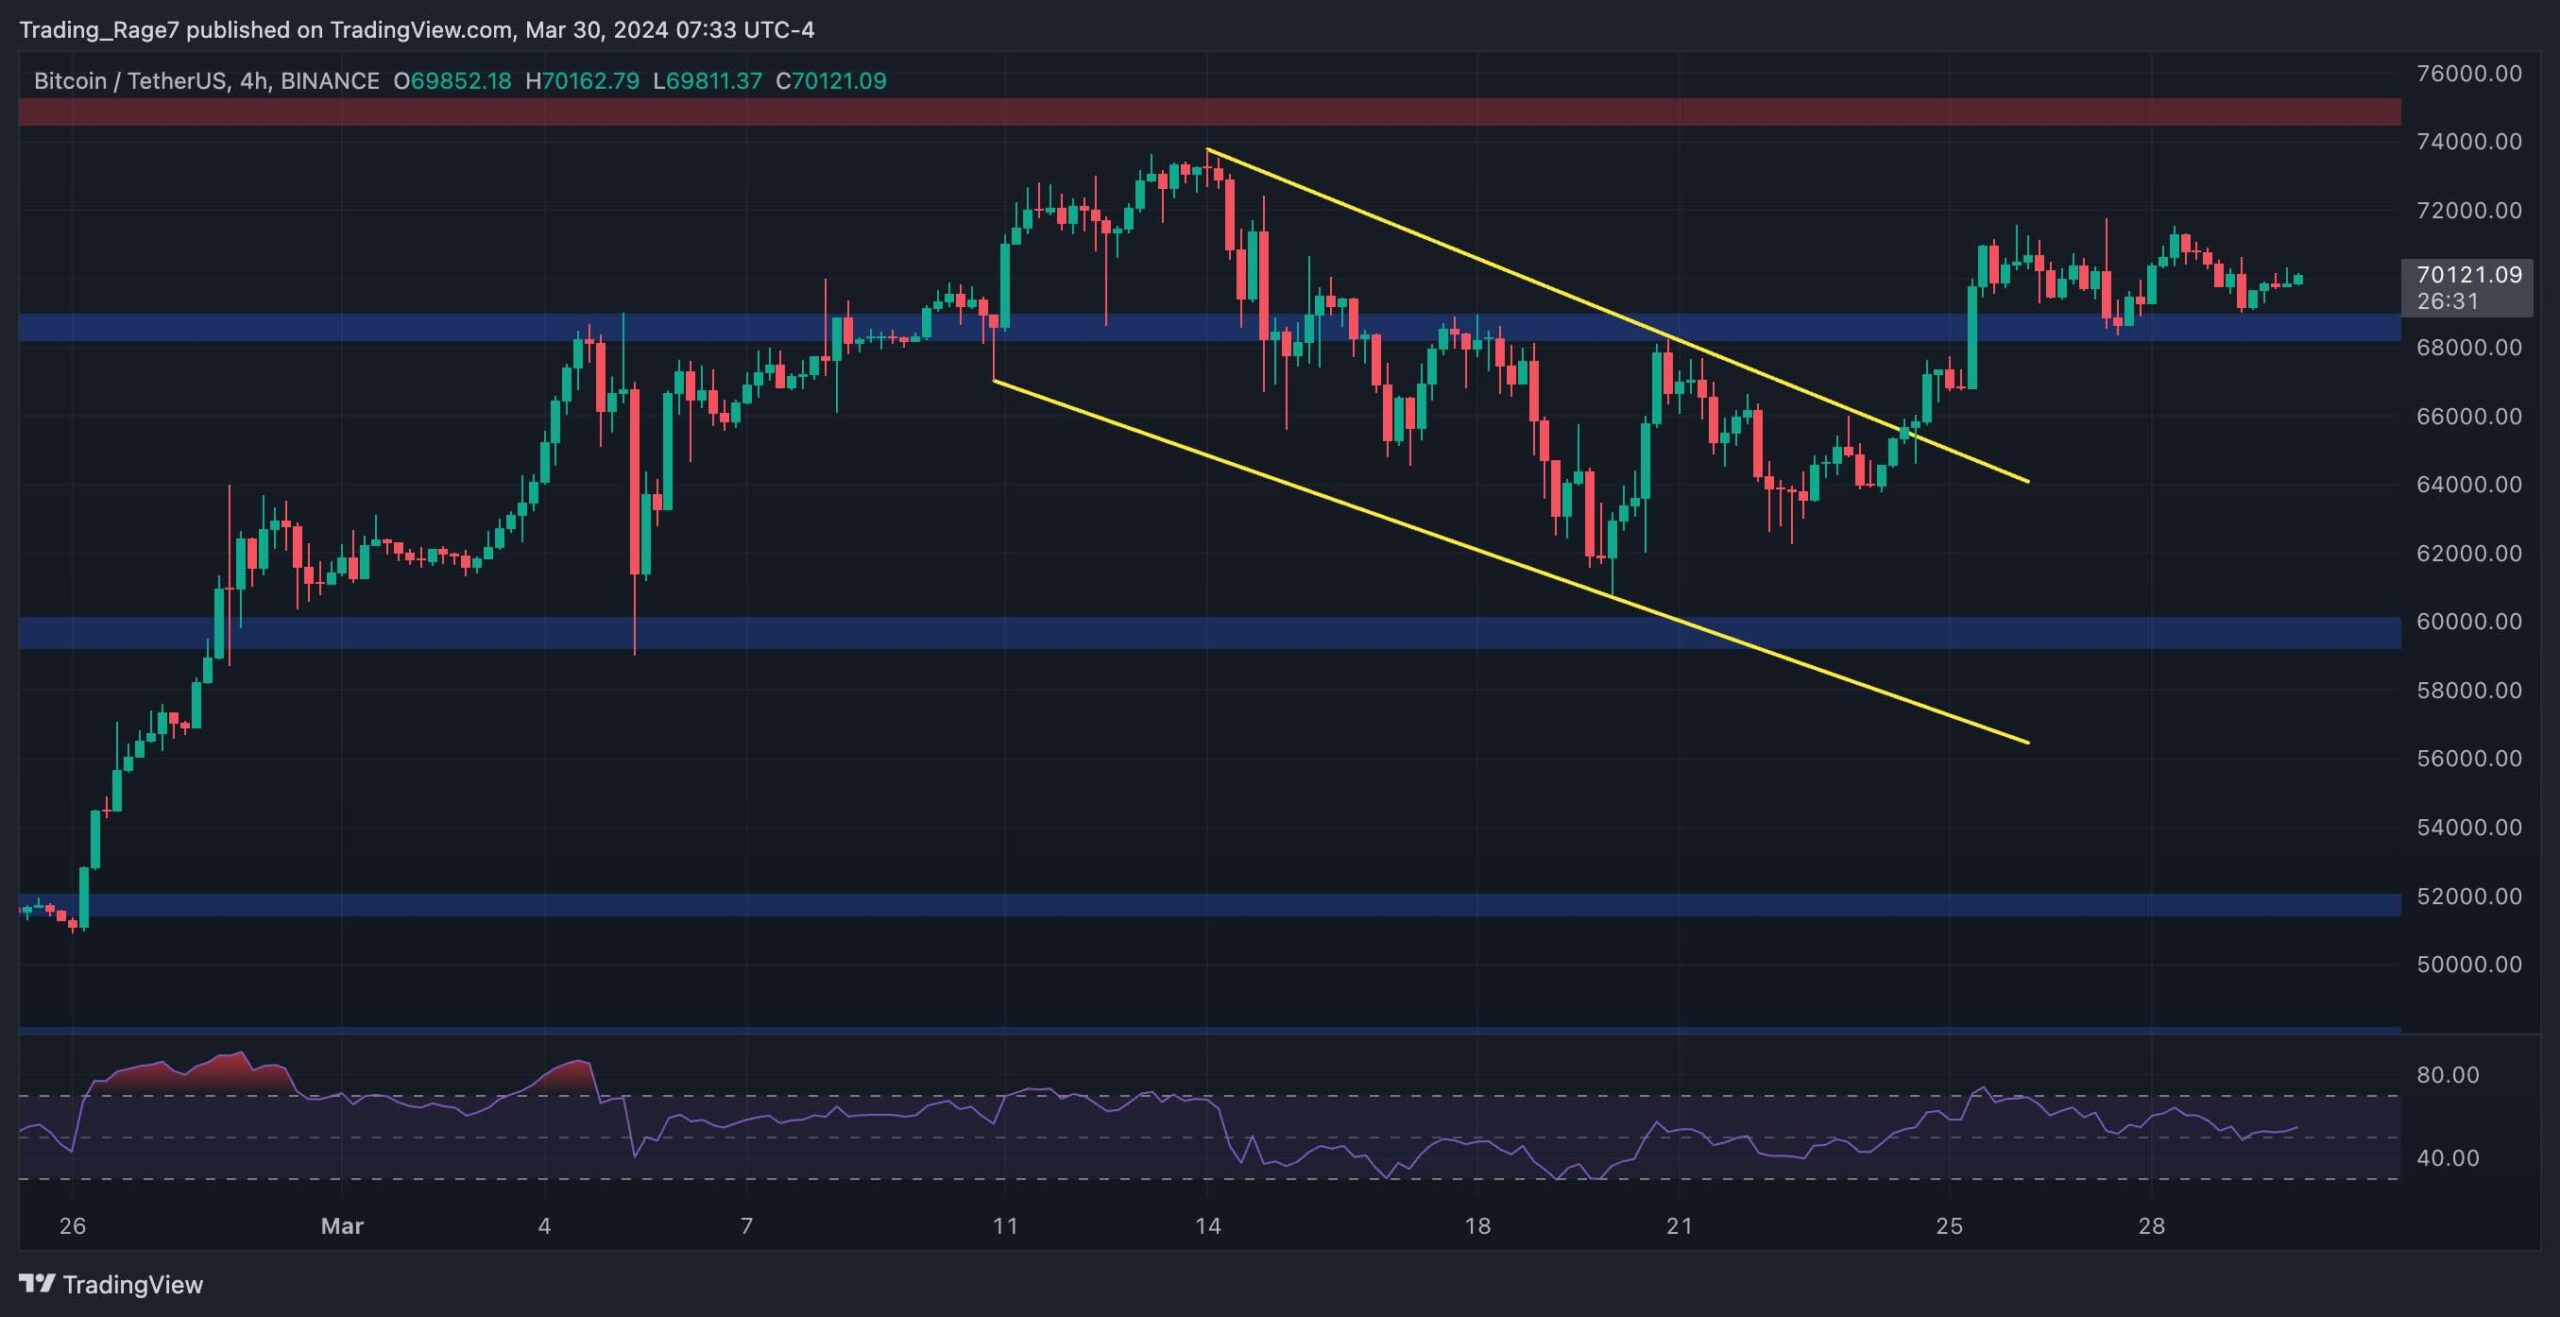
Bitcoin’s price has recovered from its sudden drop from K and is currently targeting the same level again. Market participants are eagerly waiting for the market to make a new record high soon. Technical Analysis By TradingRage The Daily Chart On the daily chart, the price has rebounded from the K support zone and broken the K resistance level to the upside. BTC is currently climbing toward the K resistance once more. The Relative Strength Index is also showing values above 50%, indicating that the momentum is in favor of a bullish continuation. It might be time before Bitcoin makes a new record high. Source: TradingViewThe 4-Hour Chart Looking at the 4-hour timeframe, it is evident that the price has broken the large descending channel pattern to the upside.
Topics:
CryptoVizArt considers the following as important: Bitcoin (BTC) Price, BTC Analysis, BTCEUR, BTCGBP, btcusd, btcusdt
This could be interesting, too:
Chayanika Deka writes XRP, SOL, and ADA Inclusion in US Crypto Reserve Pushes Traders on Edge
Chayanika Deka writes Why Arthur Hayes Is Bullish on Bitcoin Under Trump’s Economic Strategy
Mandy Williams writes Why the Bitcoin Market Is Stuck—and the Key Metric That Could Change It: CryptoQuant CEO
Wayne Jones writes Metaplanet Acquires 156 BTC, Bringing Total Holdings to 2,391
Bitcoin’s price has recovered from its sudden drop from $75K and is currently targeting the same level again. Market participants are eagerly waiting for the market to make a new record high soon.
Technical Analysis
By TradingRage
The Daily Chart
On the daily chart, the price has rebounded from the $60K support zone and broken the $69K resistance level to the upside. BTC is currently climbing toward the $75K resistance once more.
The Relative Strength Index is also showing values above 50%, indicating that the momentum is in favor of a bullish continuation. It might be time before Bitcoin makes a new record high.
The 4-Hour Chart
Looking at the 4-hour timeframe, it is evident that the price has broken the large descending channel pattern to the upside.
It has also retested the $69K level after breaking above it and is on its way toward the $75K resistance zone once more. Judging by the price action and the fact that the RSI shows that the momentum is bullish, a new higher high seems imminent in the short term.
On-Chain Analysis
By TradingRage
Bitcoin Exchange Reserve
The recent decline in Bitcoin exchange reserves, reaching new lows amidst rapid drops, suggests a tightening of available supply in the market. This diminishing reserve trend often correlates with increased demand for Bitcoin, potentially setting the stage for a surge in its price in the upcoming weeks.
As supply dwindles and demand remains steady or grows, basic economic principles suggest that the value of Bitcoin is poised to rise, reflecting a bullish sentiment among investors and traders.
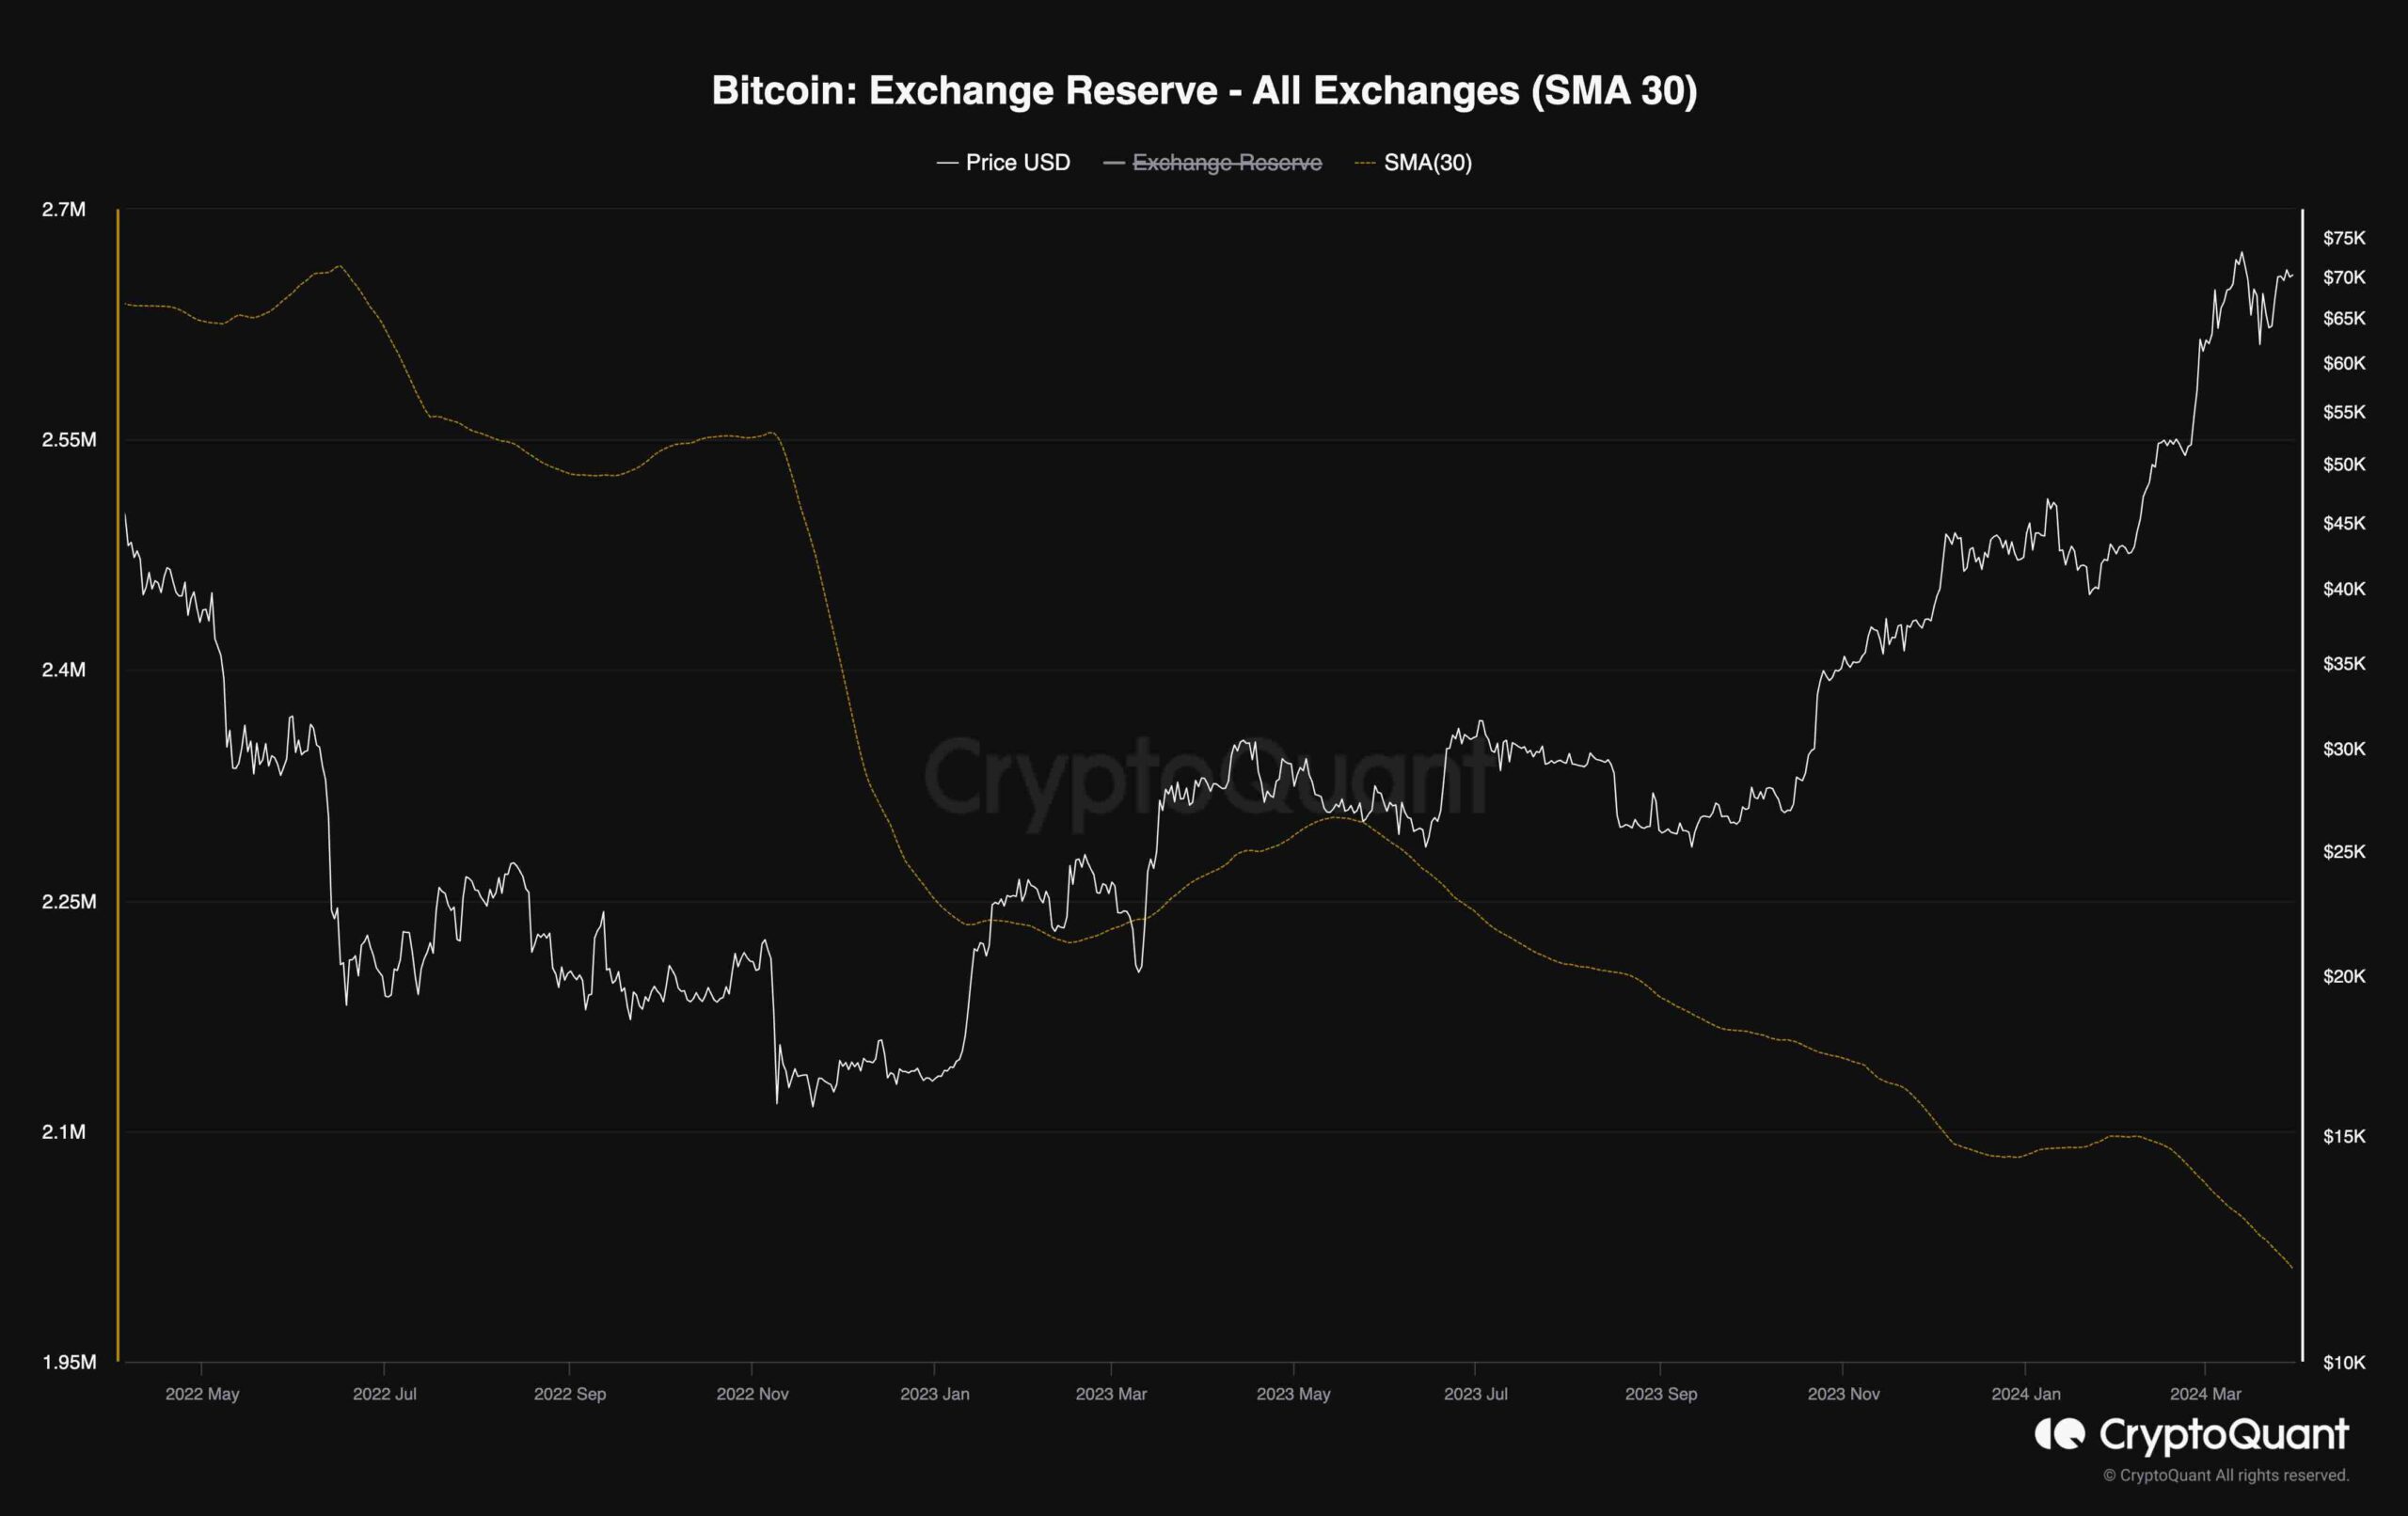
Yet, it’s essential to note that while historical patterns may indicate a potential increase, the future performance of Bitcoin remains uncertain and subject to various factors, including market sentiment, regulatory developments, and macroeconomic trends.