Bitcoin’s price has been making lower highs and lows recently, following a decisive rejection from the significant K level. Investors are now wondering whether the uptrend is over or a new all-time high is still on the cards. Technical Analysis By TradingRage The Daily Chart On the daily chart, the price has been formed and broken below an ascending channel below the K resistance level. This is a corrective (or bearish reversal) pattern, especially in case the price fails to climb back inside the channel. Currently, The K support zone is preventing the market from dropping lower. Yet, with the Relative Strength Index showing values below 50%, the probability of further decline is still considerable. It’s worth noting that, at the time of this writing, BTC’s price
Topics:
CryptoVizArt considers the following as important: Bitcoin (BTC) Price, BTC Analysis, BTCEUR, BTCGBP, btcusd, btcusdt
This could be interesting, too:
Chayanika Deka writes XRP, SOL, and ADA Inclusion in US Crypto Reserve Pushes Traders on Edge
Chayanika Deka writes Why Arthur Hayes Is Bullish on Bitcoin Under Trump’s Economic Strategy
Mandy Williams writes Why the Bitcoin Market Is Stuck—and the Key Metric That Could Change It: CryptoQuant CEO
Wayne Jones writes Metaplanet Acquires 156 BTC, Bringing Total Holdings to 2,391
Bitcoin’s price has been making lower highs and lows recently, following a decisive rejection from the significant $48K level.
Investors are now wondering whether the uptrend is over or a new all-time high is still on the cards.
Technical Analysis
By TradingRage
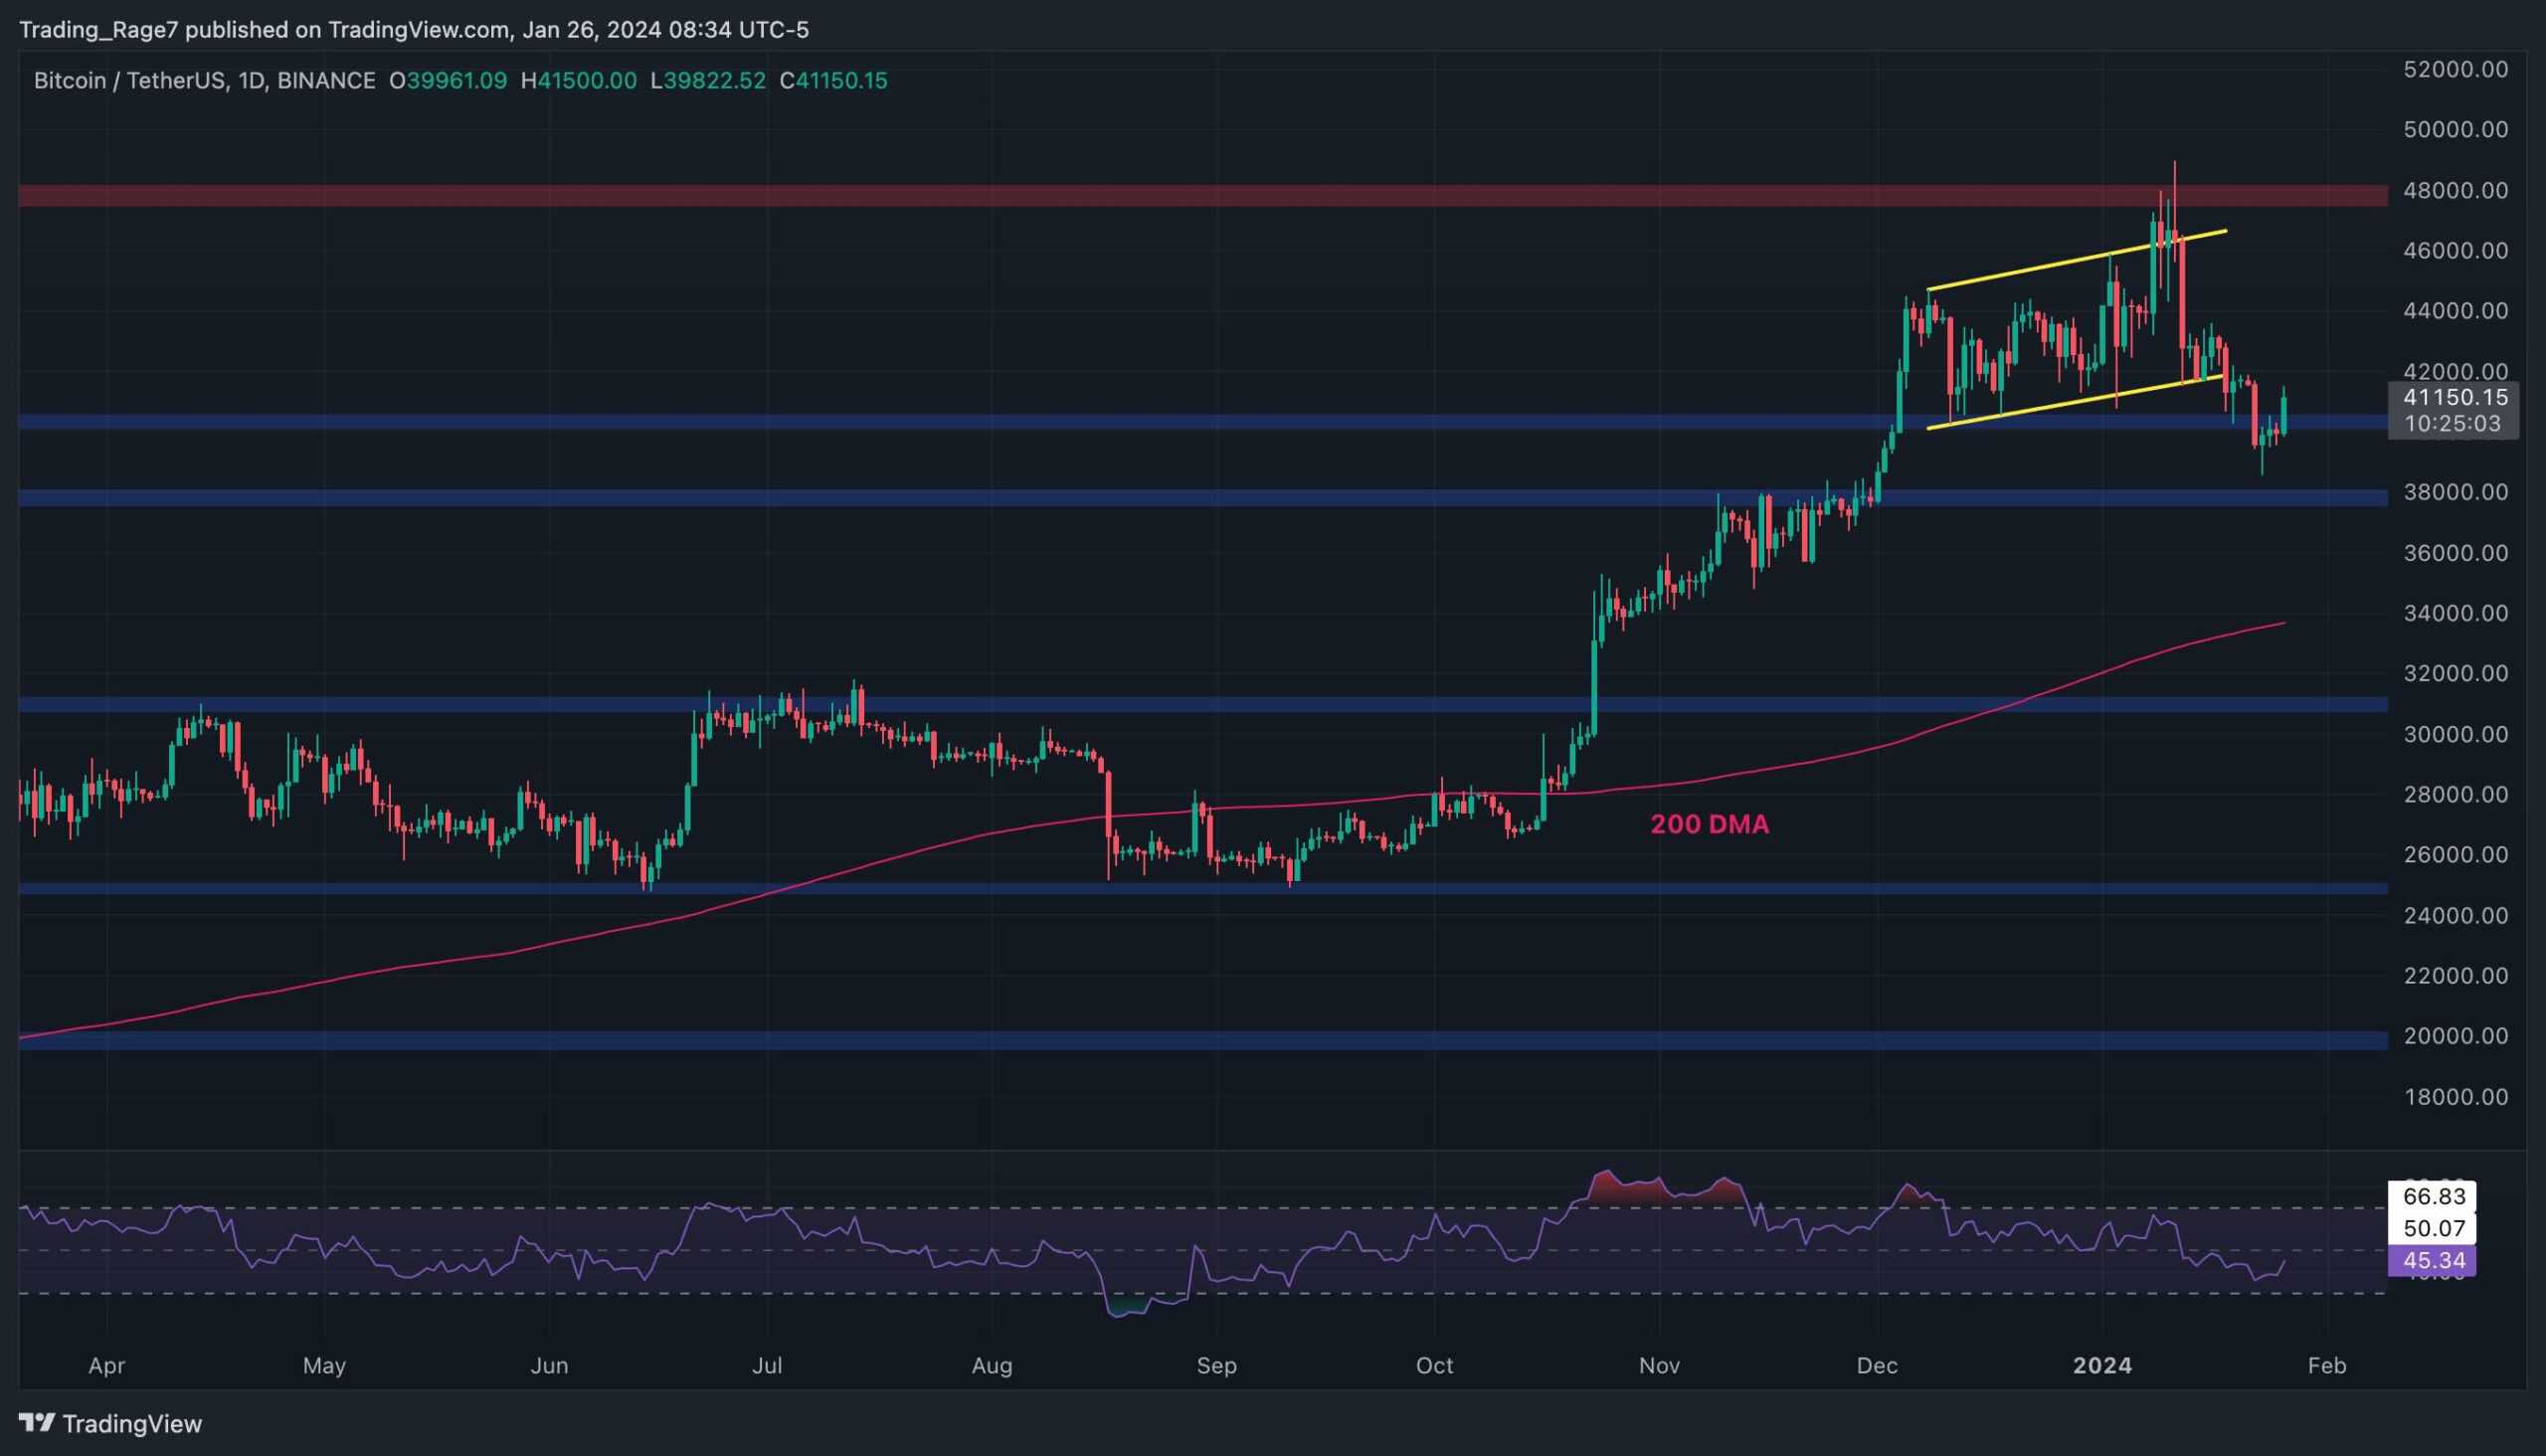
The Daily Chart
On the daily chart, the price has been formed and broken below an ascending channel below the $48K resistance level. This is a corrective (or bearish reversal) pattern, especially in case the price fails to climb back inside the channel.
Currently, The $40K support zone is preventing the market from dropping lower. Yet, with the Relative Strength Index showing values below 50%, the probability of further decline is still considerable.
It’s worth noting that, at the time of this writing, BTC’s price soared above $41K and is gaining momentum to challenge the $42K level.
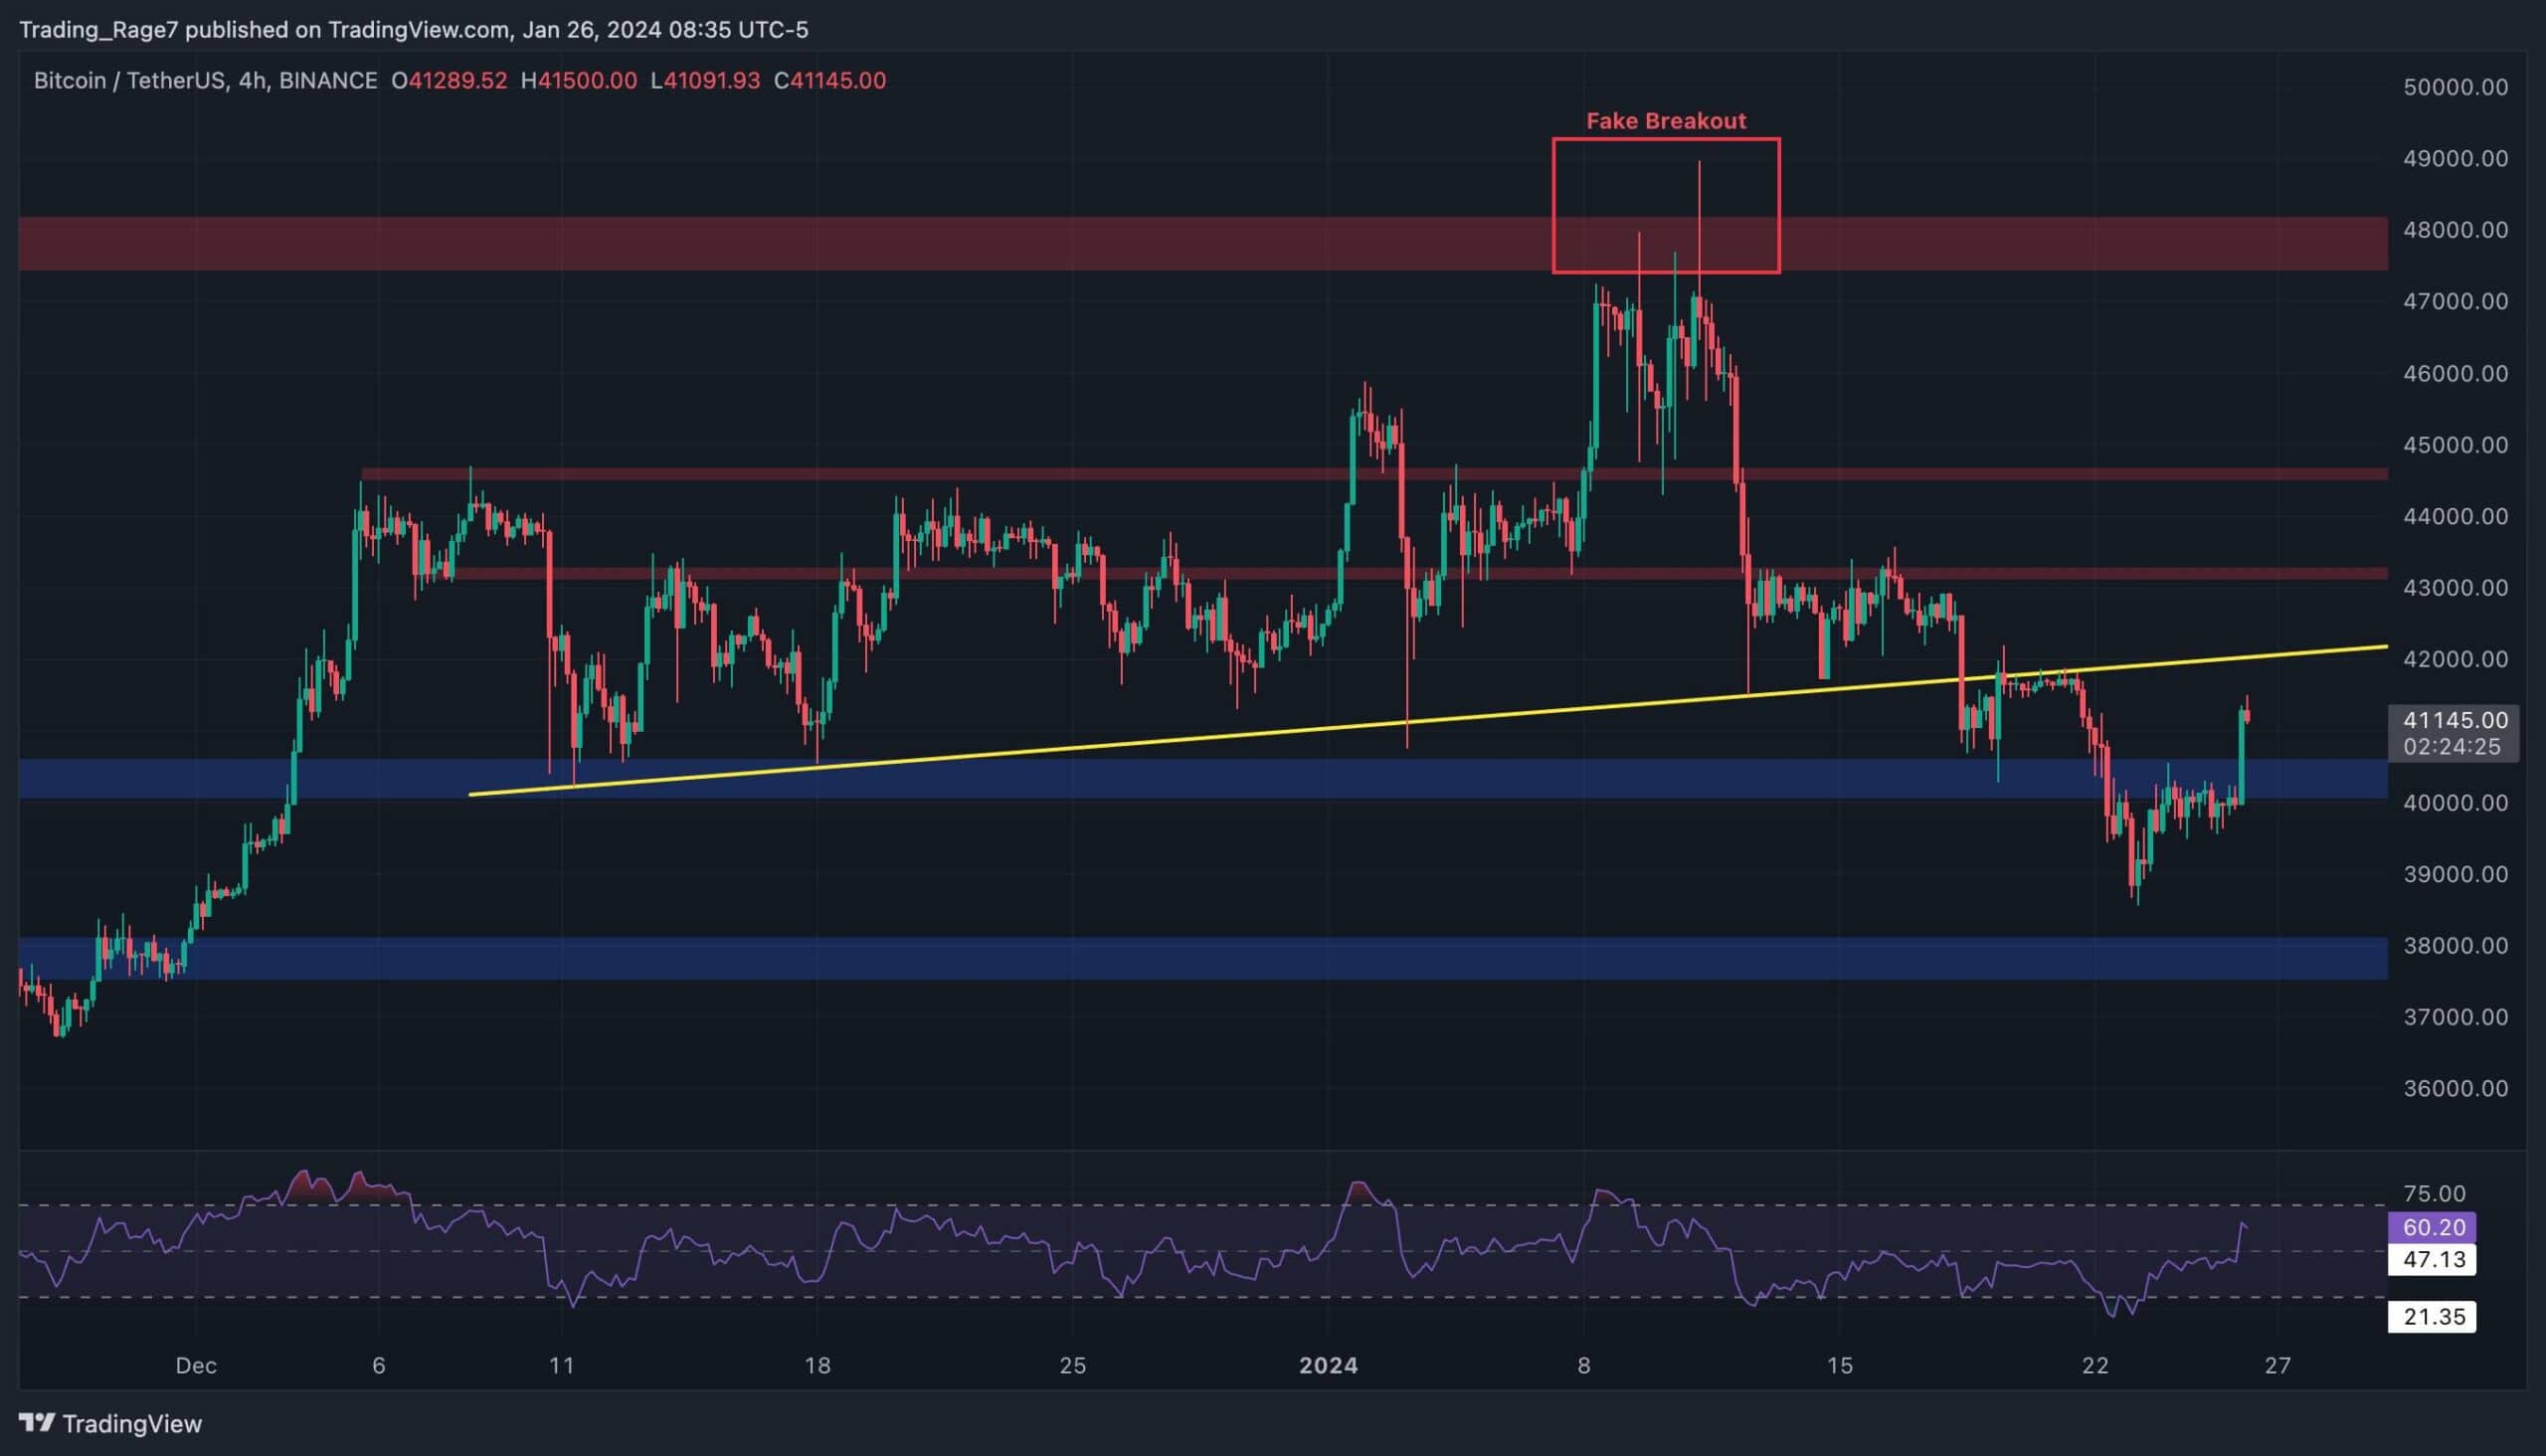
The 4-Hour Chart
The 4-hour timeframe provides more clues on the potential short-term price action of Bitcoin. The cryptocurrency has recovered above the $40K level and is en route to retesting the broken trendline (the lower boundary of the broken ascending channel).
If the price fails to break above, it would be a potential turning point that would drive the price even lower, potentially toward the $38K support level, in the coming weeks.
On-Chain Analysis
By TradingRage
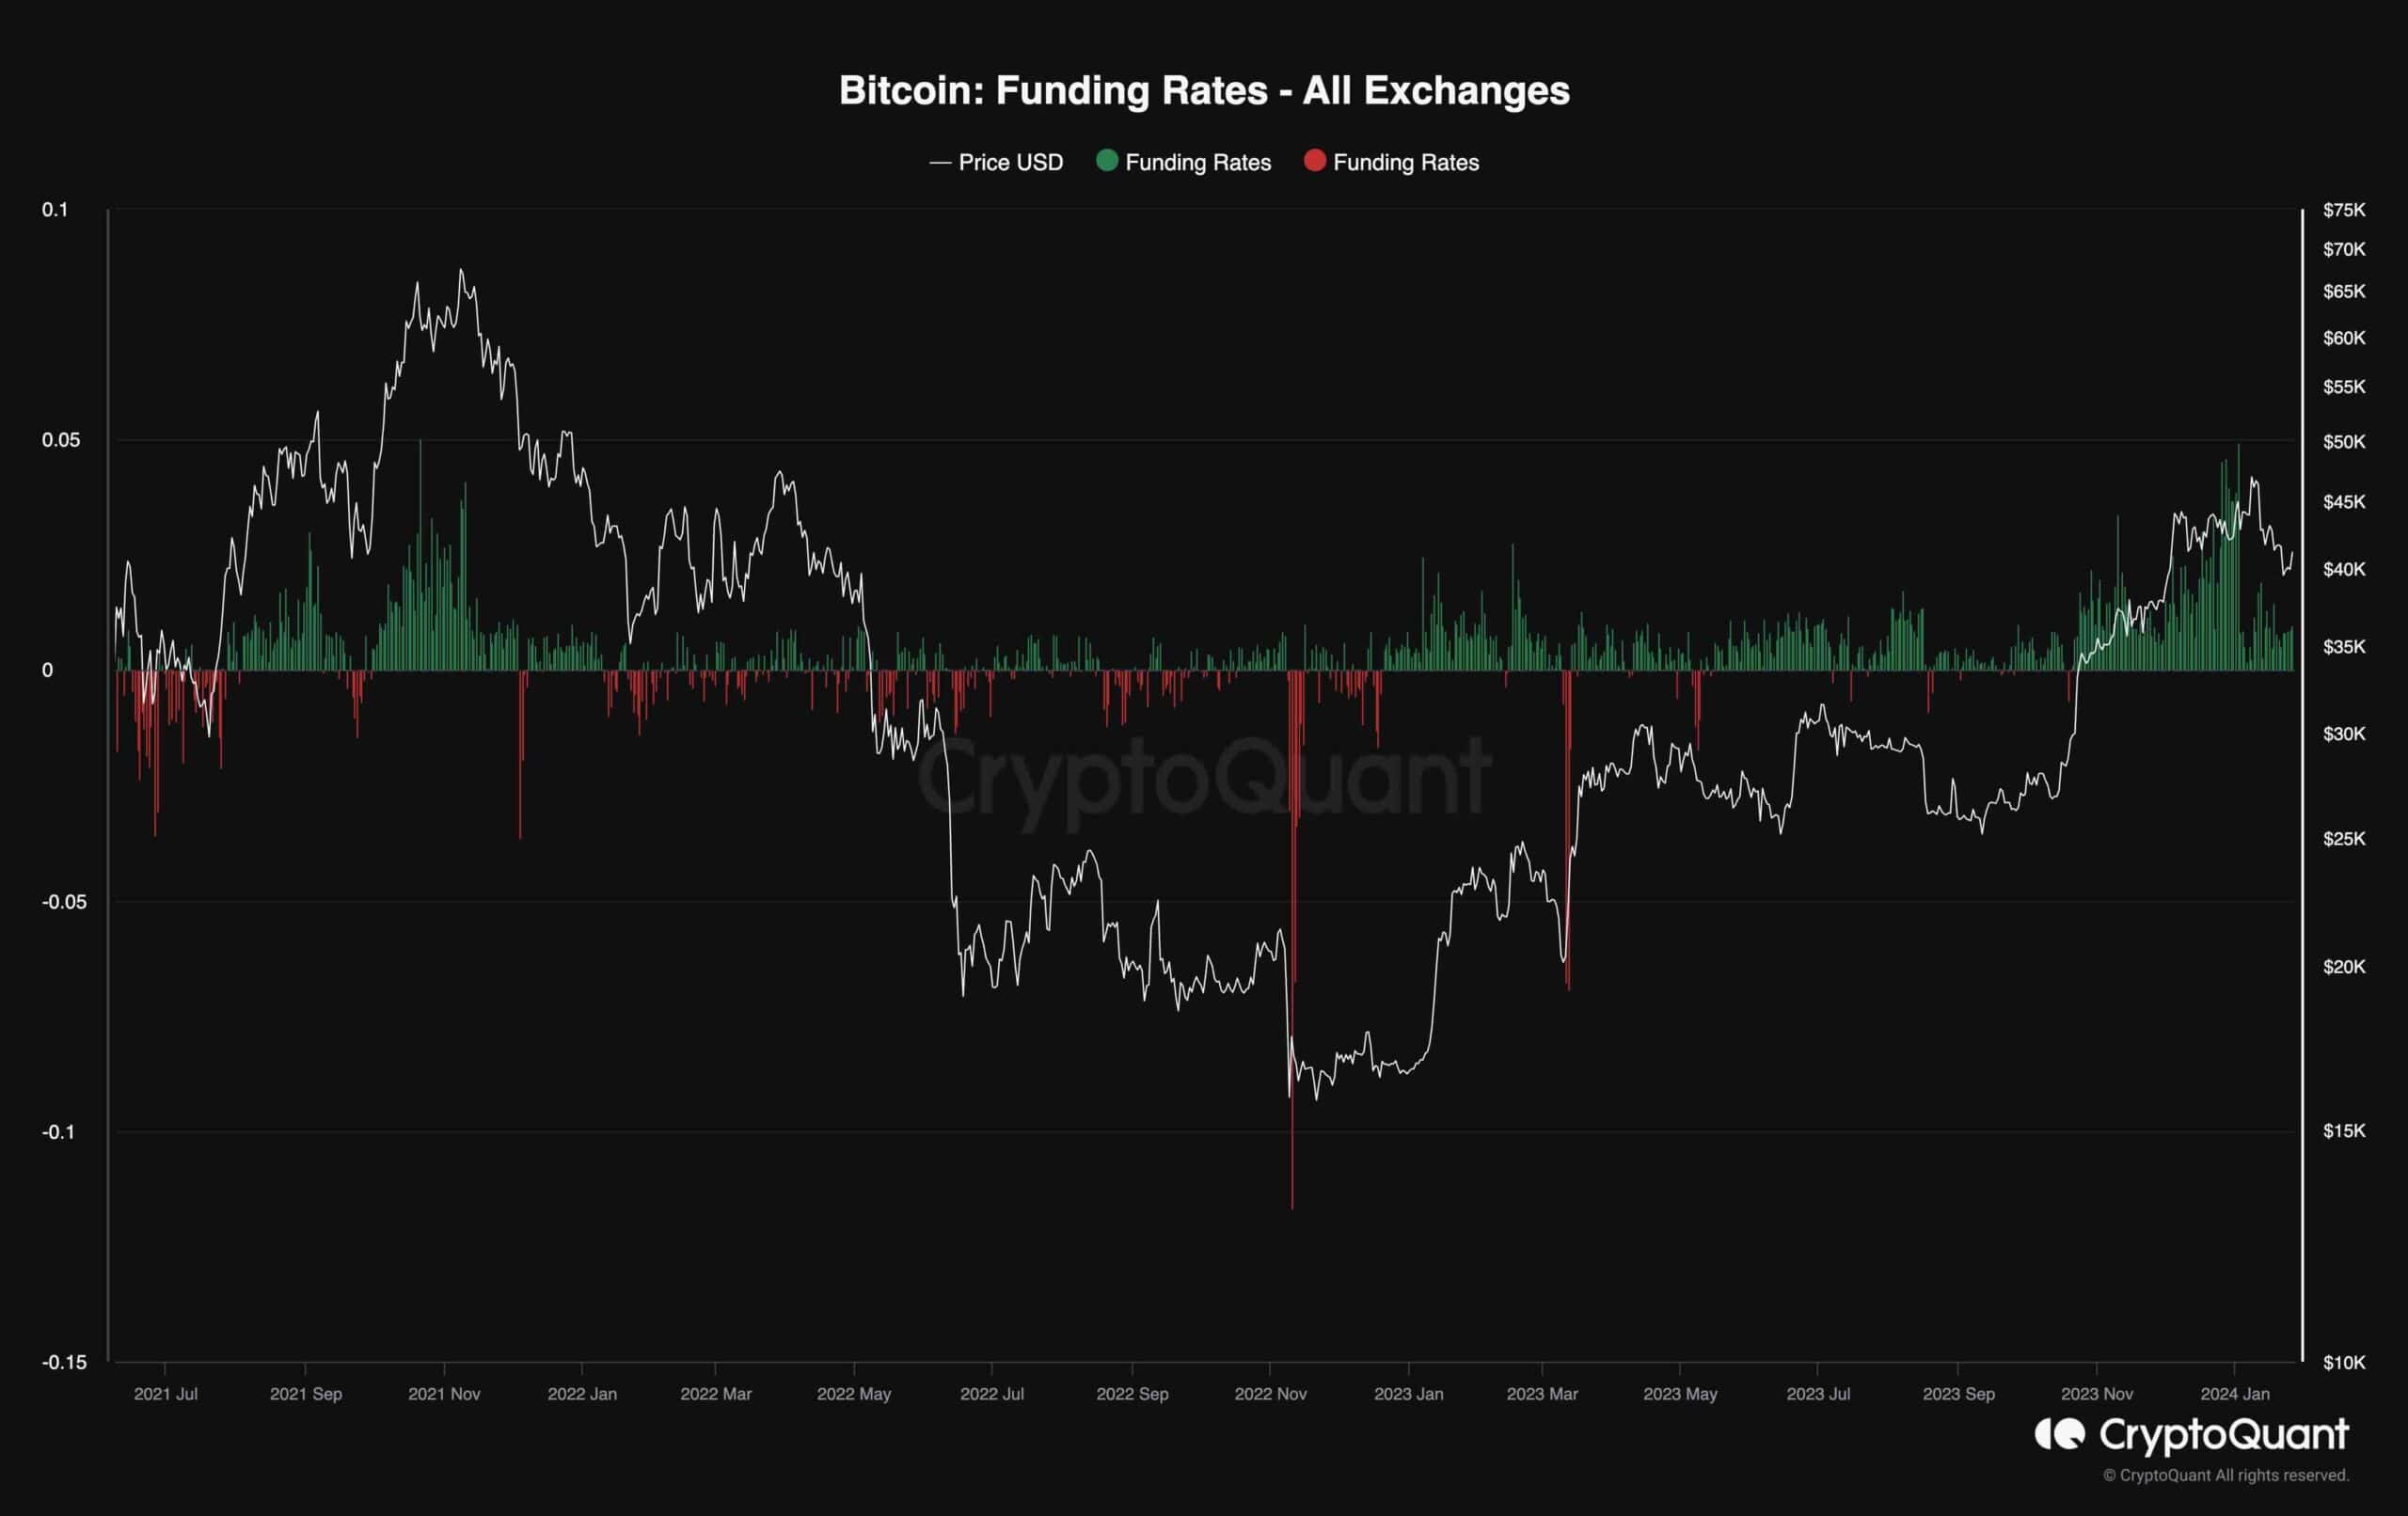
Funding Rates
During the final weeks of the recent uptrend, the market participants had become extremely positive that BTC was soon going to reach a new all-time high. This euphoric sentiment may have been one of the culprits for the drop in the last couple of weeks.
This chart demonstrates the Bitcoin funding rates, one of the valuable measures for future market sentiment evaluation. The metric indicates whether the buyers or the sellers are executing their orders more aggressively on aggregate. Positive values indicate optimistic market sentiment, while values below zero are associated with pessimism.
As the chart suggests, the funding rates have reached extremely high values during the recent high. These values were similar to those observed during the $69K all-time high range. As a result, a deep correction or even a bearish reversal could have been expected as things were unraveling the same.