Following an impulsive rally, Bitcoin lost its bullish momentum upon reaching the K threshold, indicating the presence of sellers in the market. Nevertheless, considering that the price is hovering above the crucial 100-day MA, the continuation of the consolidation stage seems possible in the short term before initiating the next move. Technical Analysis By Shayan The Daily Chart A detailed analysis of Bitcoin’s daily chart reveals that after decisively breaking above the 100-day moving average of .4K, the price continued its upward momentum toward the crucial and psychological resistance zone of K. However, upon reaching it, the cryptocurrency lost its momentum, indicating a potential increase in selling pressure. Nevertheless, as long as the price hovers above
Topics:
CryptoVizArt considers the following as important: Bitcoin (BTC) Price, BTC Analysis
This could be interesting, too:
Chayanika Deka writes XRP, SOL, and ADA Inclusion in US Crypto Reserve Pushes Traders on Edge
Chayanika Deka writes Why Arthur Hayes Is Bullish on Bitcoin Under Trump’s Economic Strategy
Mandy Williams writes Why the Bitcoin Market Is Stuck—and the Key Metric That Could Change It: CryptoQuant CEO
Jordan Lyanchev writes Liquidations Top 0M as Bitcoin Falls K, Reversing Trump-Driven Rally
Following an impulsive rally, Bitcoin lost its bullish momentum upon reaching the $70K threshold, indicating the presence of sellers in the market.
Nevertheless, considering that the price is hovering above the crucial 100-day MA, the continuation of the consolidation stage seems possible in the short term before initiating the next move.
Technical Analysis
By Shayan
The Daily Chart
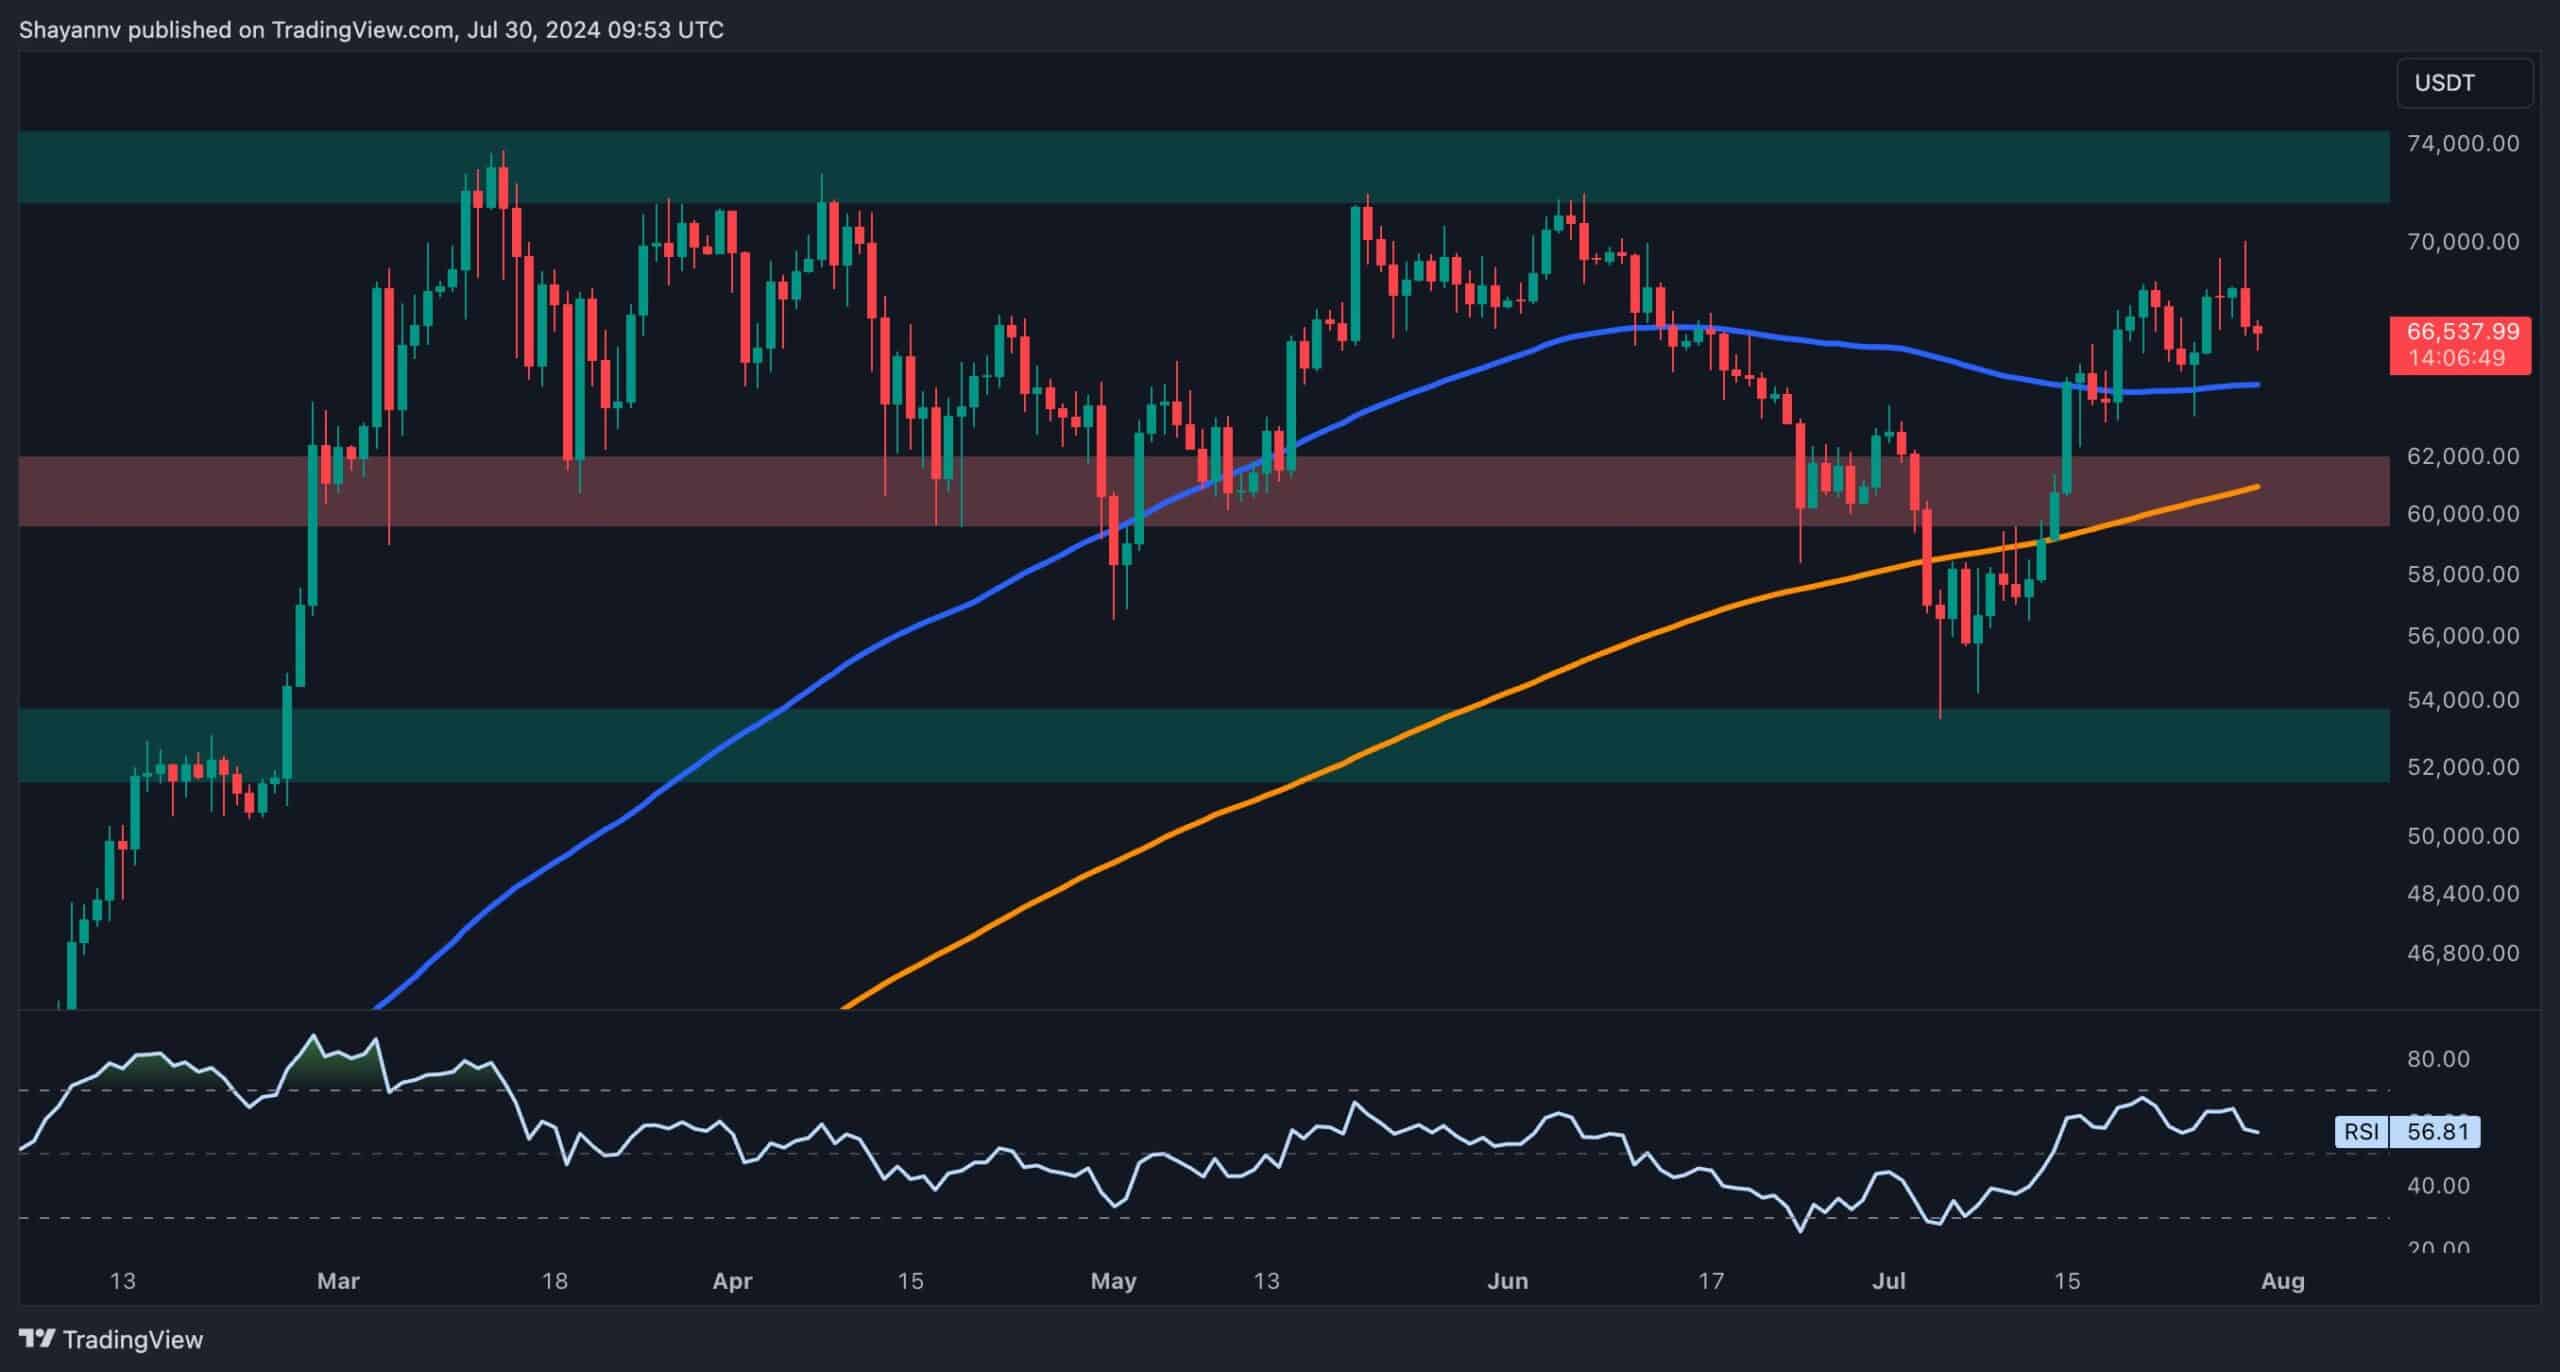
A detailed analysis of Bitcoin’s daily chart reveals that after decisively breaking above the 100-day moving average of $64.4K, the price continued its upward momentum toward the crucial and psychological resistance zone of $70K.
However, upon reaching it, the cryptocurrency lost its momentum, indicating a potential increase in selling pressure. Nevertheless, as long as the price hovers above both the 100 and 200-day MAs, the overall market state remains bullish, with buyers aiming to mark a new ATH in the upcoming days.
If BTC breaks below the 100-day MA in the near future, this will signal a notable bearish trend, possibly leading to a plunge toward the $60K pivot. Overall, Bitcoin is expected to continue its sideways consolidation in the short term, ultimately receiving support and initiating a fresh bullish surge.
The 4-Hour Chart
On the 4-hour chart, following an impulsive surge initiated from the crucial $55K support region, Bitcoin surpassed multiple key resistance levels, including $60K and $65K. Nevertheless, as the chart demonstrates, the price faced heightened selling pressure upon reaching the descending wedge’s upper boundary at $68K, resulting in faded bullish momentum and weaker price action.
Upon reaching the wedge’s upper threshold, the cryptocurrency formed an ascending wedge pattern, consolidating between the pattern’s boundaries.
The formation of this pattern, coupled with a bearish divergence between the price and the RSI indicator, indicates a potential bearish reversal in the short term, with the price retracing back toward the $65K crucial support region. This bearish scenario is only valid if BTC first breaks below the ascending wedge’s lower boundary.
Nevertheless, if buyers ultimately manage to breach the wedge’s upper boundary and reclaim the substantial resistance of $70K, an impulsive surge will become imminent, potentially liquidating numerous short positions.

On-chain Analysis
By Shayan
Understanding the futures market metrics for Bitcoin can be a great complement to price analysis. This chart highlights the Taker Buy/Sell Ratio, which measures whether buyers or sellers are more aggressive in executing their orders on aggregate.
As the chart demonstrates, following a slight rejection from the $70K price zone, a substantial volume of market sell orders has been executed in the futures market, causing the Taker Buy/Sell Ratio to drop below one. This suggests that futures market traders anticipate a further decline in Bitcoin’s price in the short term, raising the expectations for an extended consolidation phase with possible minor retracements.
